Which of the following graphs correctly represents the variation of β=−(dVdP)/V with P for an ideal gas at constant temperature
A
_E01_393_O01.png)
B
_E01_393_O02.png)
C
_E01_393_O03.png)
D
_E01_393_O04.png)
Video Solution
Text Solution
The correct Answer is:A
At constant temperature PV = constant So PdV+VdP=0
⇒dVdP=−VP
⇒β=−dV/dPV=1P
|
Topper's Solved these Questions
- GEOMETRICAL OPTICSBOOK - ALLENCHAPTER - GEOMETRICAL OPTICSEXERCISE - EXERCISE - 05 (B) (MCQ)
9 Videos
- GEOMETRICAL OPTICSBOOK - ALLENCHAPTER - GEOMETRICAL OPTICSEXERCISE - EXERCISE - 05 (B) (MATCH THE COLUMN)
3 Videos
- GEOMETRICAL OPTICSBOOK - ALLENCHAPTER - GEOMETRICAL OPTICSEXERCISE - EXERCISE - 05 (A)
73 Videos
- CURRENT ELECTRICITYBOOK - ALLENCHAPTER - CURRENT ELECTRICITYEXERCISE - All Questions
427 Videos
- GRAVITATIONBOOK - ALLENCHAPTER - GRAVITATIONEXERCISE - EXERCISE 4
9 Videos
Similar Questions
Knowledge Check
Which of the following graphs correctly represents the variation of β=−(dVdP)1V with P for an ideal gas at constant temperature ?
A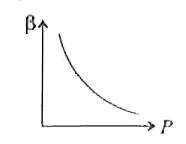 B
B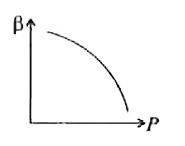 C
C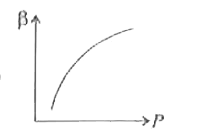 D
D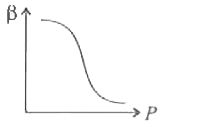
Which of the following graphs correctly represents the variation of β=−dV/dPV
with P for an ideal gas at constant temperature?A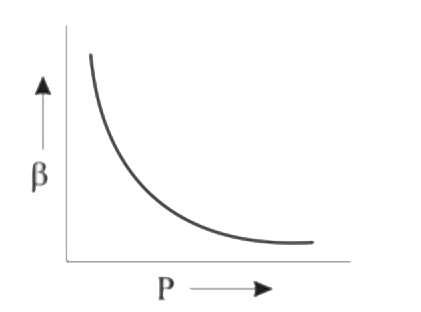 B
B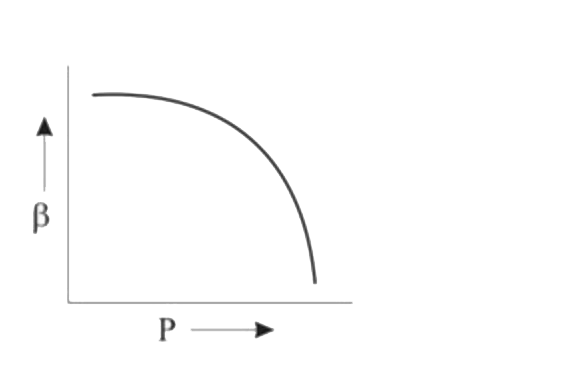 C
C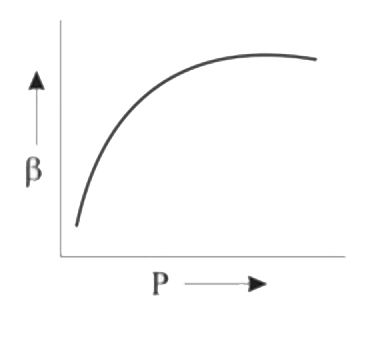 D
D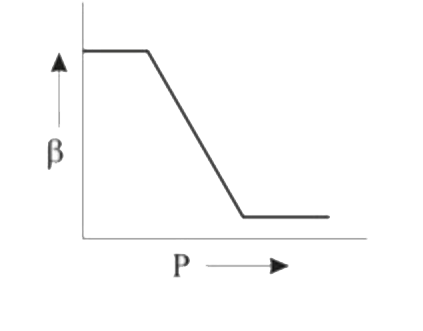
which of the following graphs correctly represents the vatiation β=−(dVdP)T/V with P for an ideal gas at constant temperature ? .
A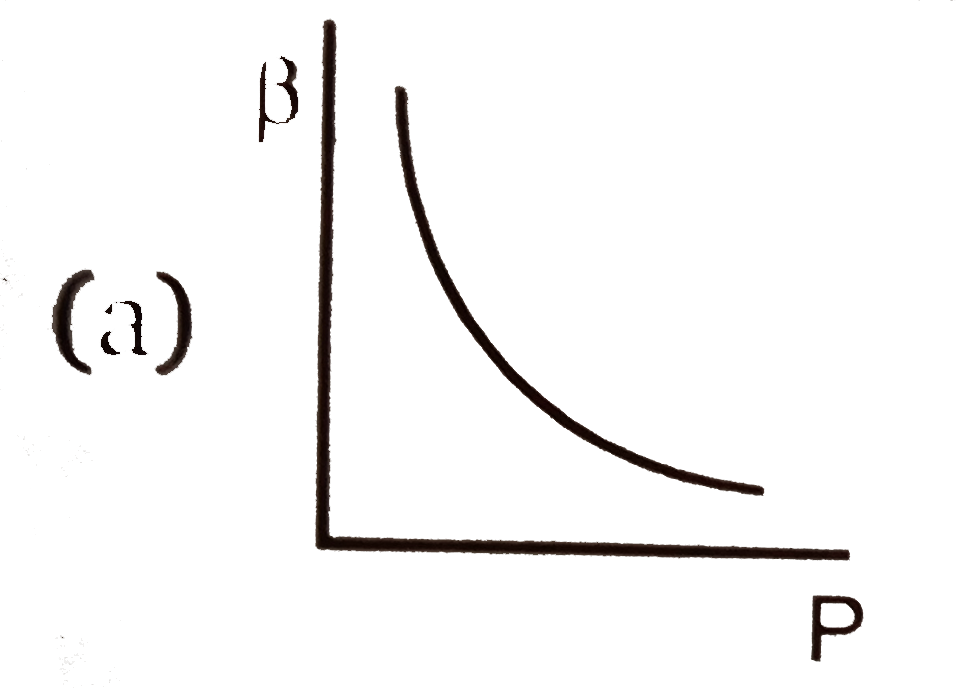 B
B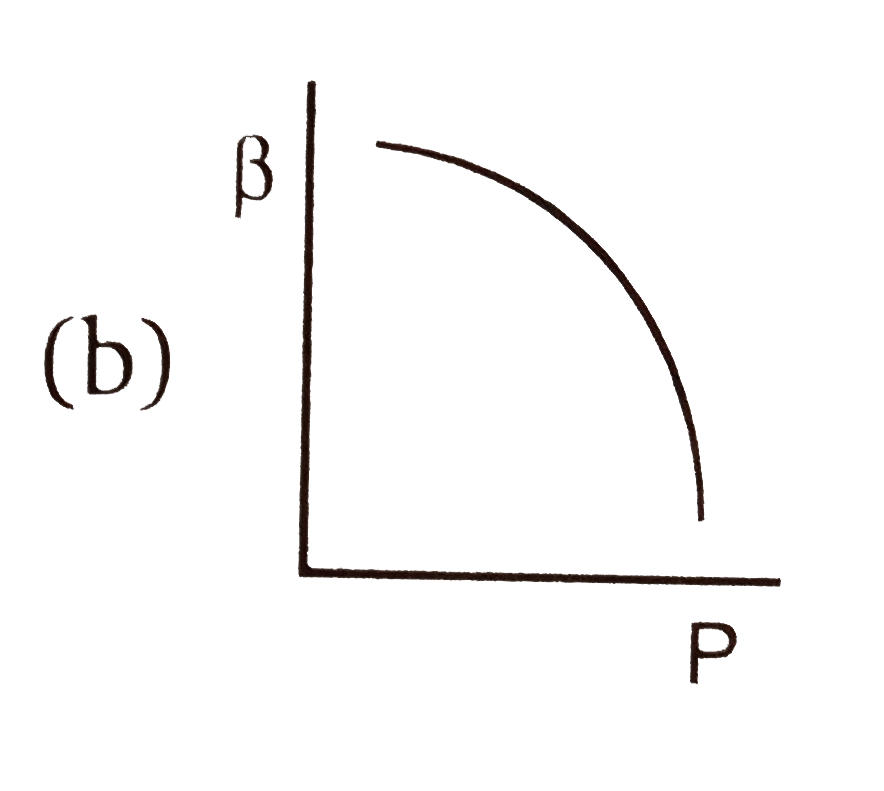 C
C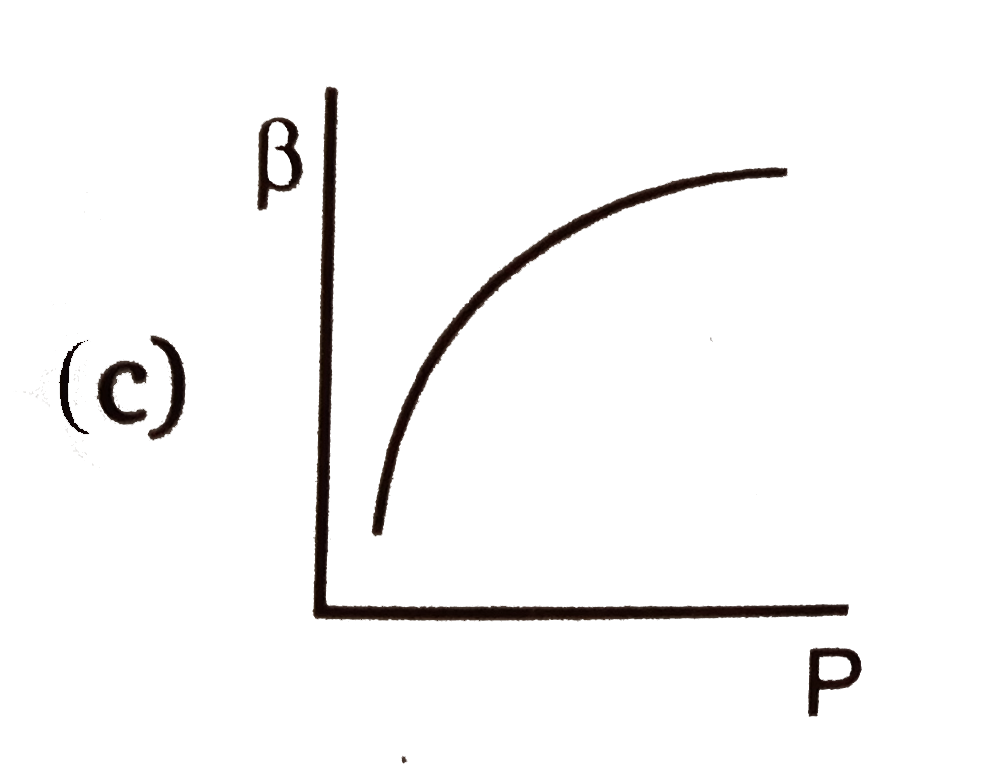 D
D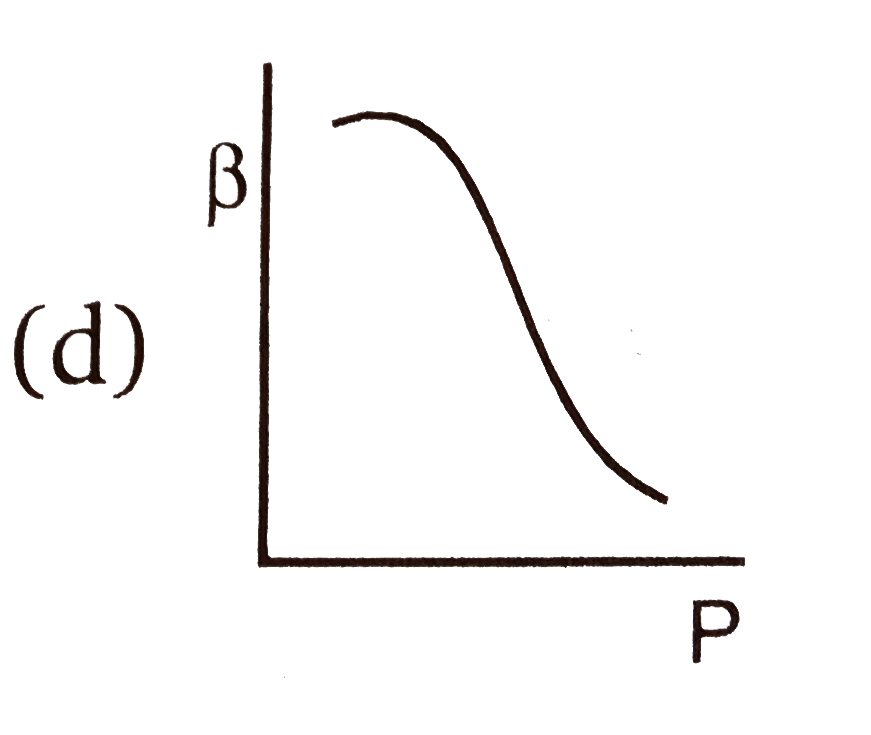
Which of following graphs correctly represent variation of α=−(dV/dP)TV with P for fixed amount of an ideal gas at constant temperature ?
View SolutionWhich of the following graphs represent the behaviour of an ideal gas ?
View SolutionWhich one of the following graphs correctly gives the ideal gas behaviour ?
View SolutionAt a constant pressure, of the following graphs that one which represents the variation of the density of an ideal gas with the absolute temperature T, is
View Solutionwhich of the following graph represents the variation of resistivity (ρ) with temperature (T) for copper?
View Solution
