The graph below shows V-p curve for three processes. Choose the correct statement(s) :

Work done is maximum in process 1 .
Temperature must increase in process 2 & 3 .
Heat must be supplied in process 1.
If final volume of gas in process 1,2 and 3 are same then temperature must be same.
The correct Answer is:A, C
Area P−V curve and volume axis represent work.
Internal energy in 1 decreases (expansion at constant pressure)
In process 2 and 3 internal energy may decreased depending on the process .
Since final pressure of 1,2 & 3 are different, final temperature must also be different.
Topper's Solved these Questions
- GEOMETRICAL OPTICSBOOK - ALLENCHAPTER - GEOMETRICAL OPTICSEXERCISE - EXERCISE -01
65 Videos
- GEOMETRICAL OPTICSBOOK - ALLENCHAPTER - GEOMETRICAL OPTICSEXERCISE - EXERCISE -02
82 Videos
- GEOMETRICAL OPTICSBOOK - ALLENCHAPTER - GEOMETRICAL OPTICSEXERCISE - subjective
14 Videos
- CURRENT ELECTRICITYBOOK - ALLENCHAPTER - CURRENT ELECTRICITYEXERCISE - All Questions
427 Videos
- GRAVITATIONBOOK - ALLENCHAPTER - GRAVITATIONEXERCISE - EXERCISE 4
9 Videos
Similar Questions
Knowledge Check
Choose the correct statements (s):
AThe shape of an atomic orbital depends upon azimuthal quantum numberBThe orientation of an atomic orbital depends upon the magnetic quantum numberCThe energy of an electron in an atomic orbital of multi-electron atom depends upon principal quantum number onlyDThe number of degenerate atomic orbitals of one type depends upon the value of azimuthal quantum numberChoose the correct statements (s):
AAll the noble gases have completely filled ns2np6 electronic configuration in their valance shellBFirst ionisation enthalpy of molecular oxygen (1170 kJ mol−1) is almost identical with that of xenon (1175 kJ mol−1)CBoth Xe+PtF−6 and O+2PtF−6DNone of the aboveThe curve C is for the gas X at 273 K.Choose the correct statement (s).
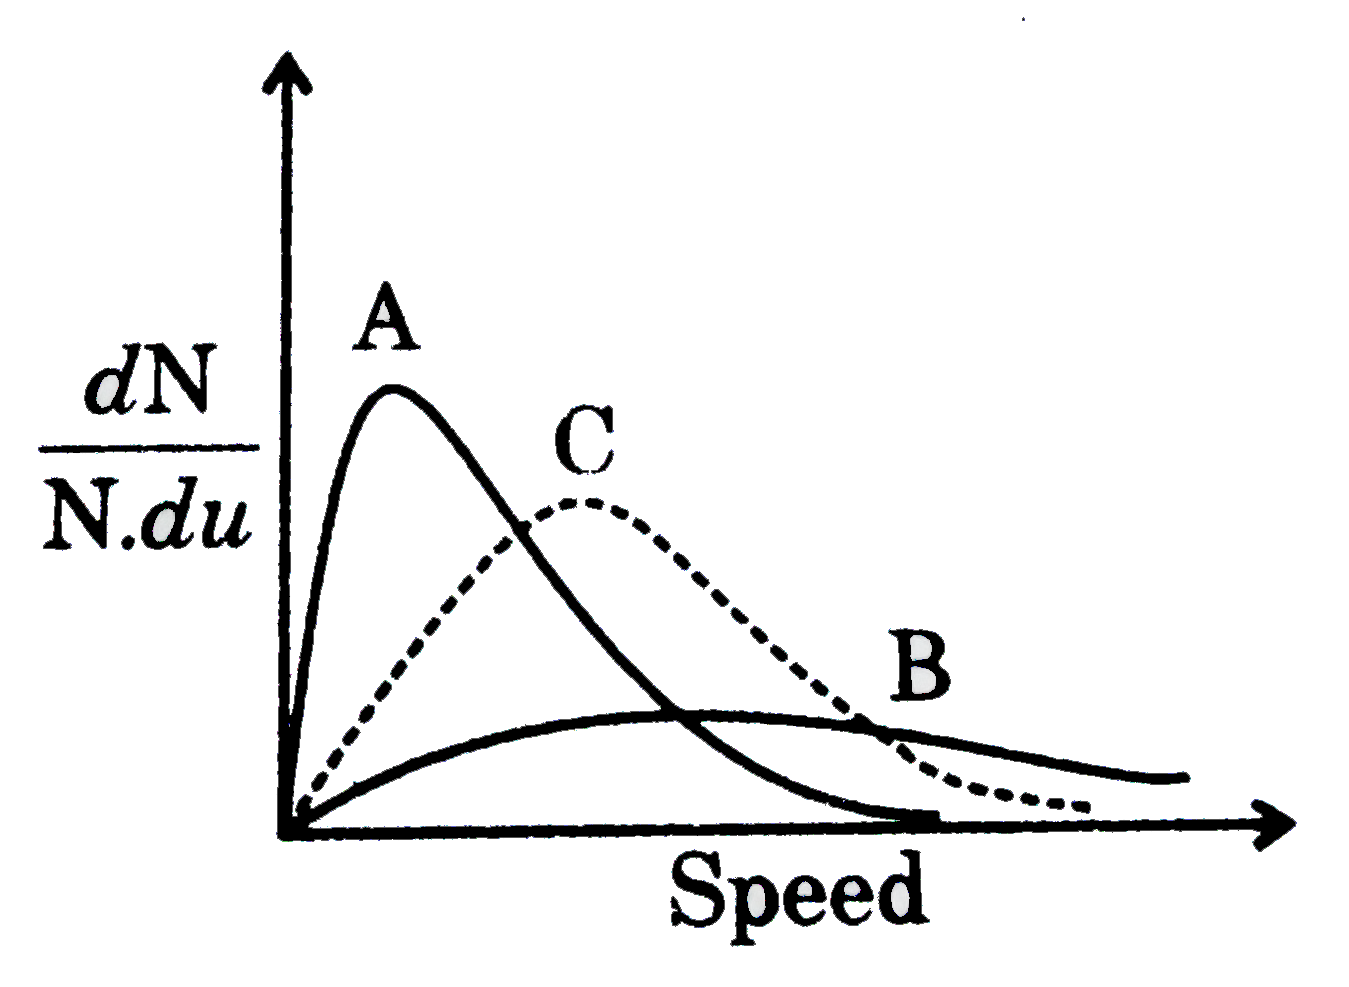 ACurve A may be of a heavier gas but at same temperatureBCurve B may be of the same gas but at 373 KCCurve A may be of the same gas but at 373 KDCurve B may be of the lighter gas but at same temperature.
With respect to the compounds I−V, choose the correct statement(s).

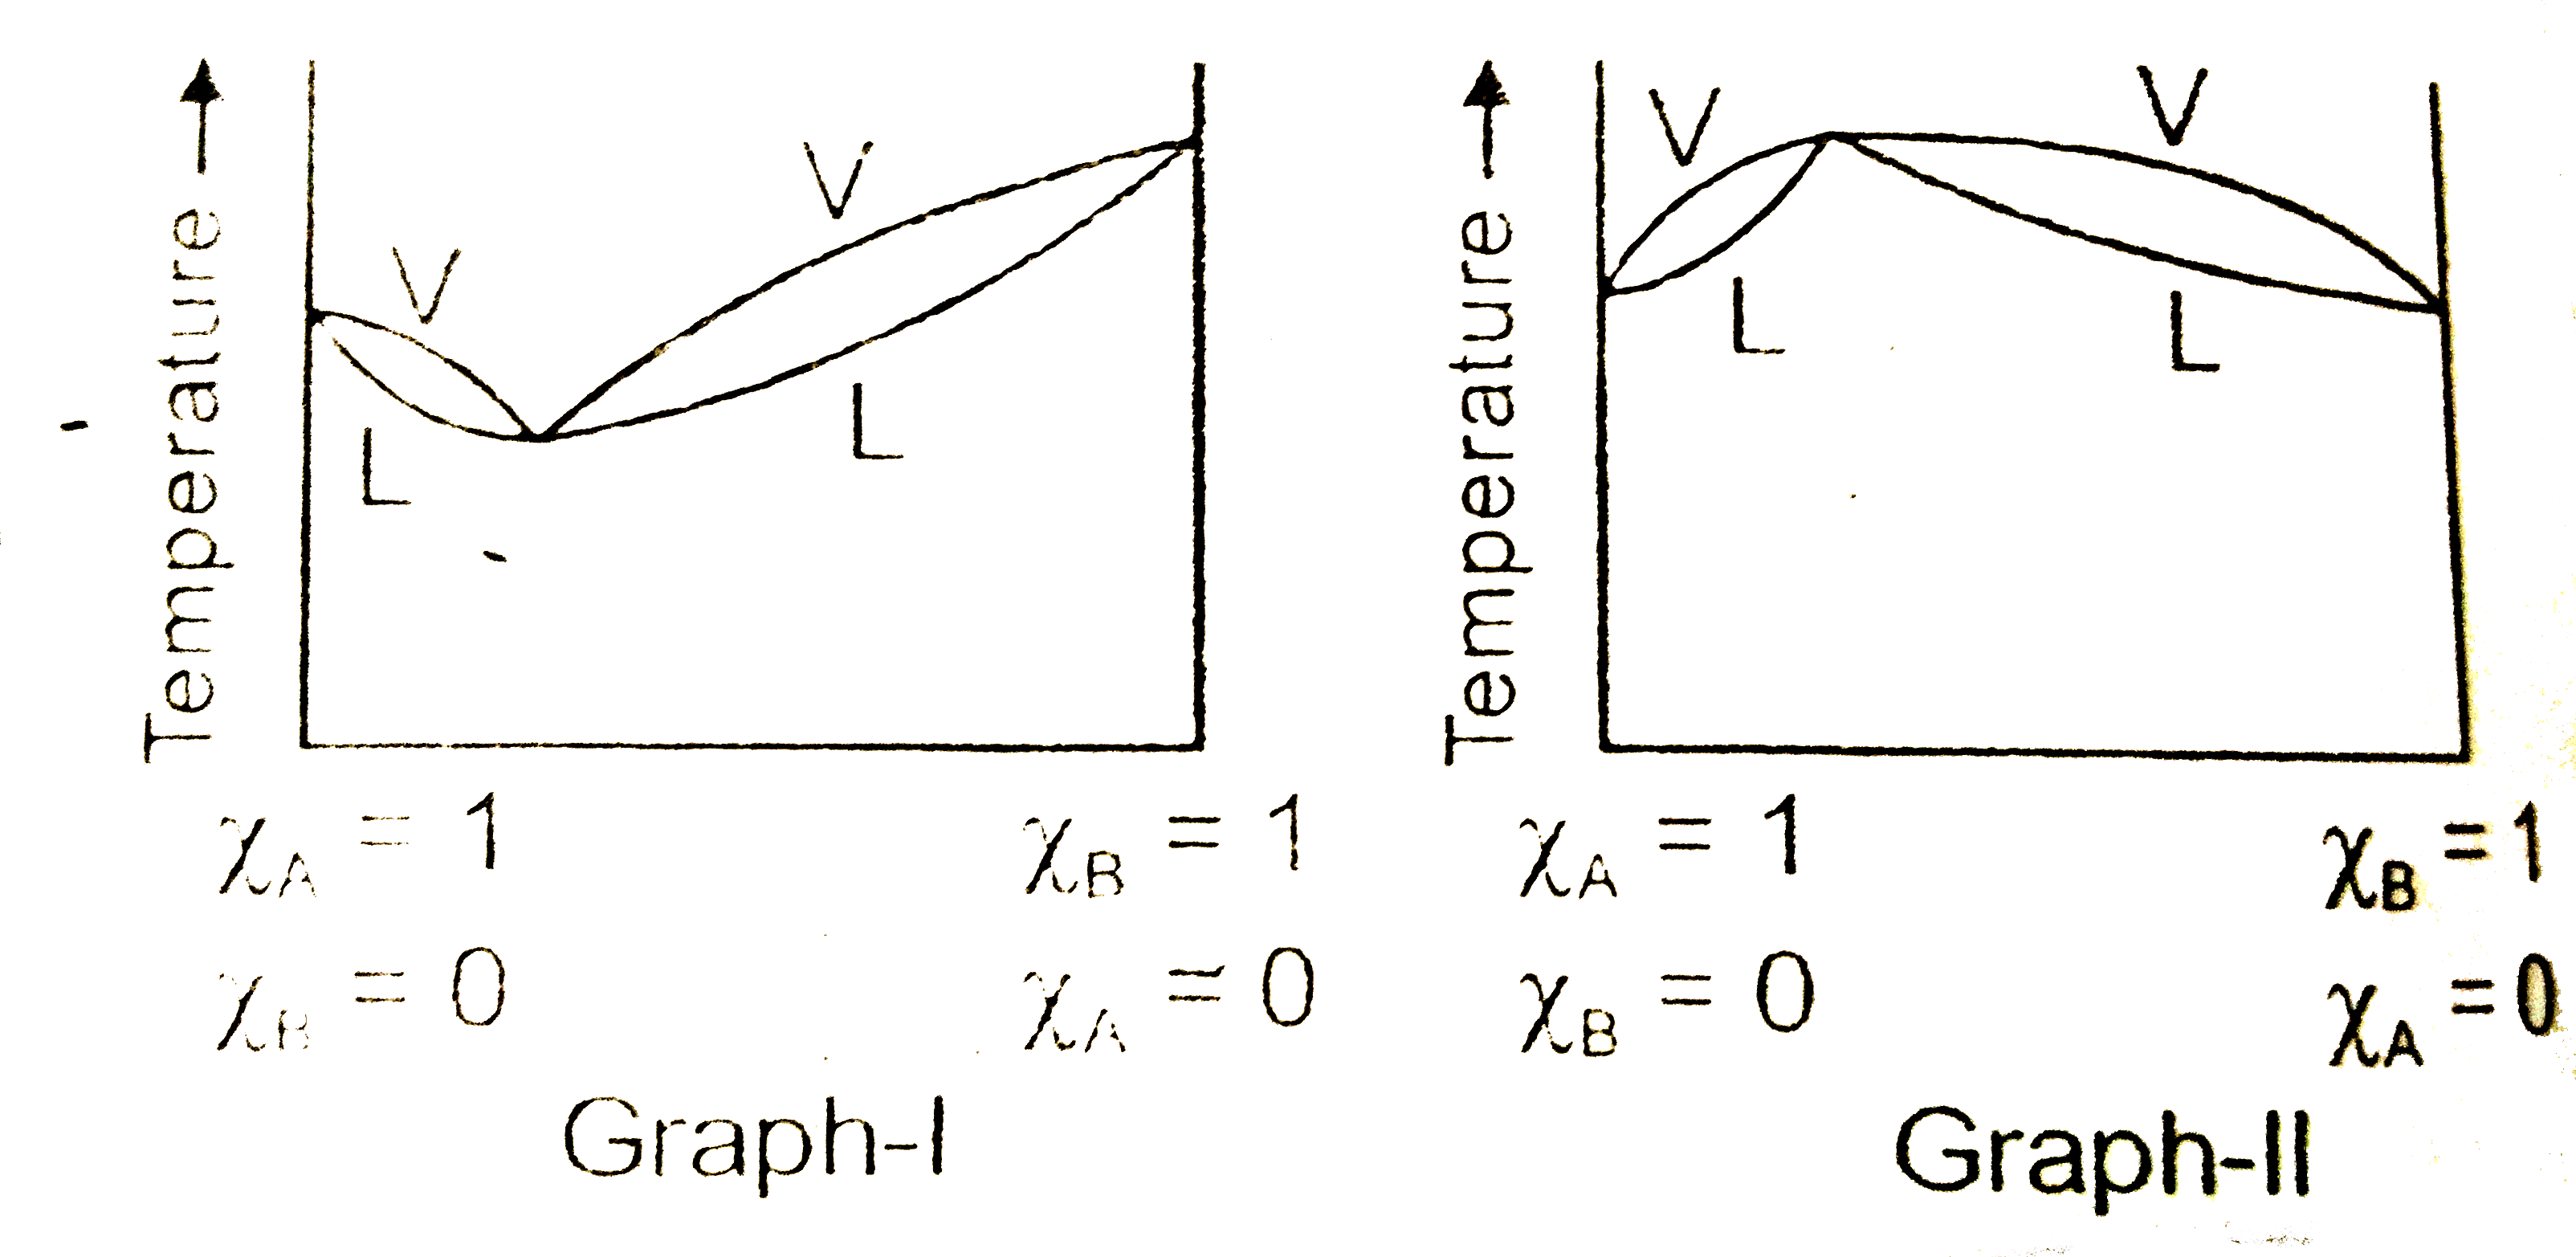
View SolutionConsider the following graphs
 Choose the correct statements
View SolutionThe graph given below shows the P-V plot for a process on an ideal gas. Select the correct statement.
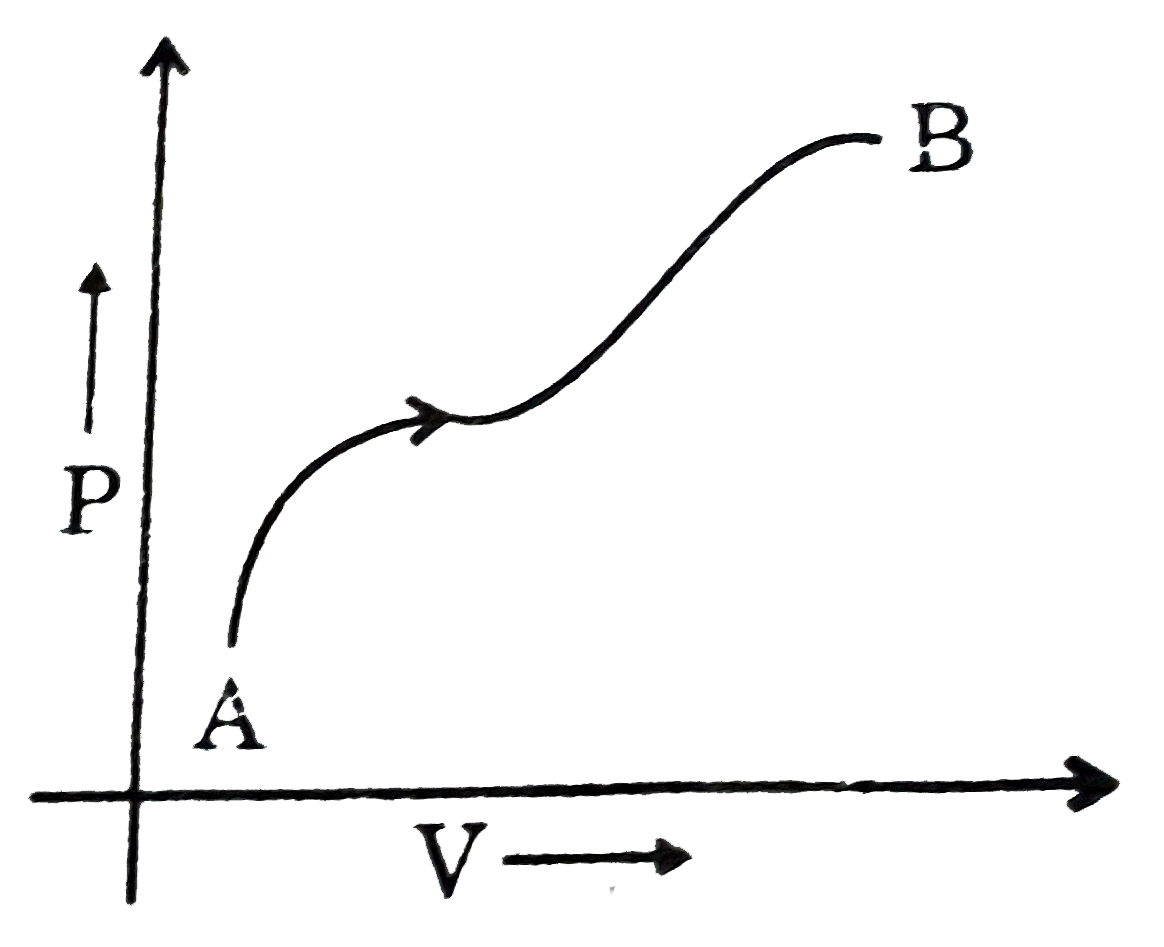
View SolutionThe shows a radiant energy spectrum graph for a black body at at temperature T
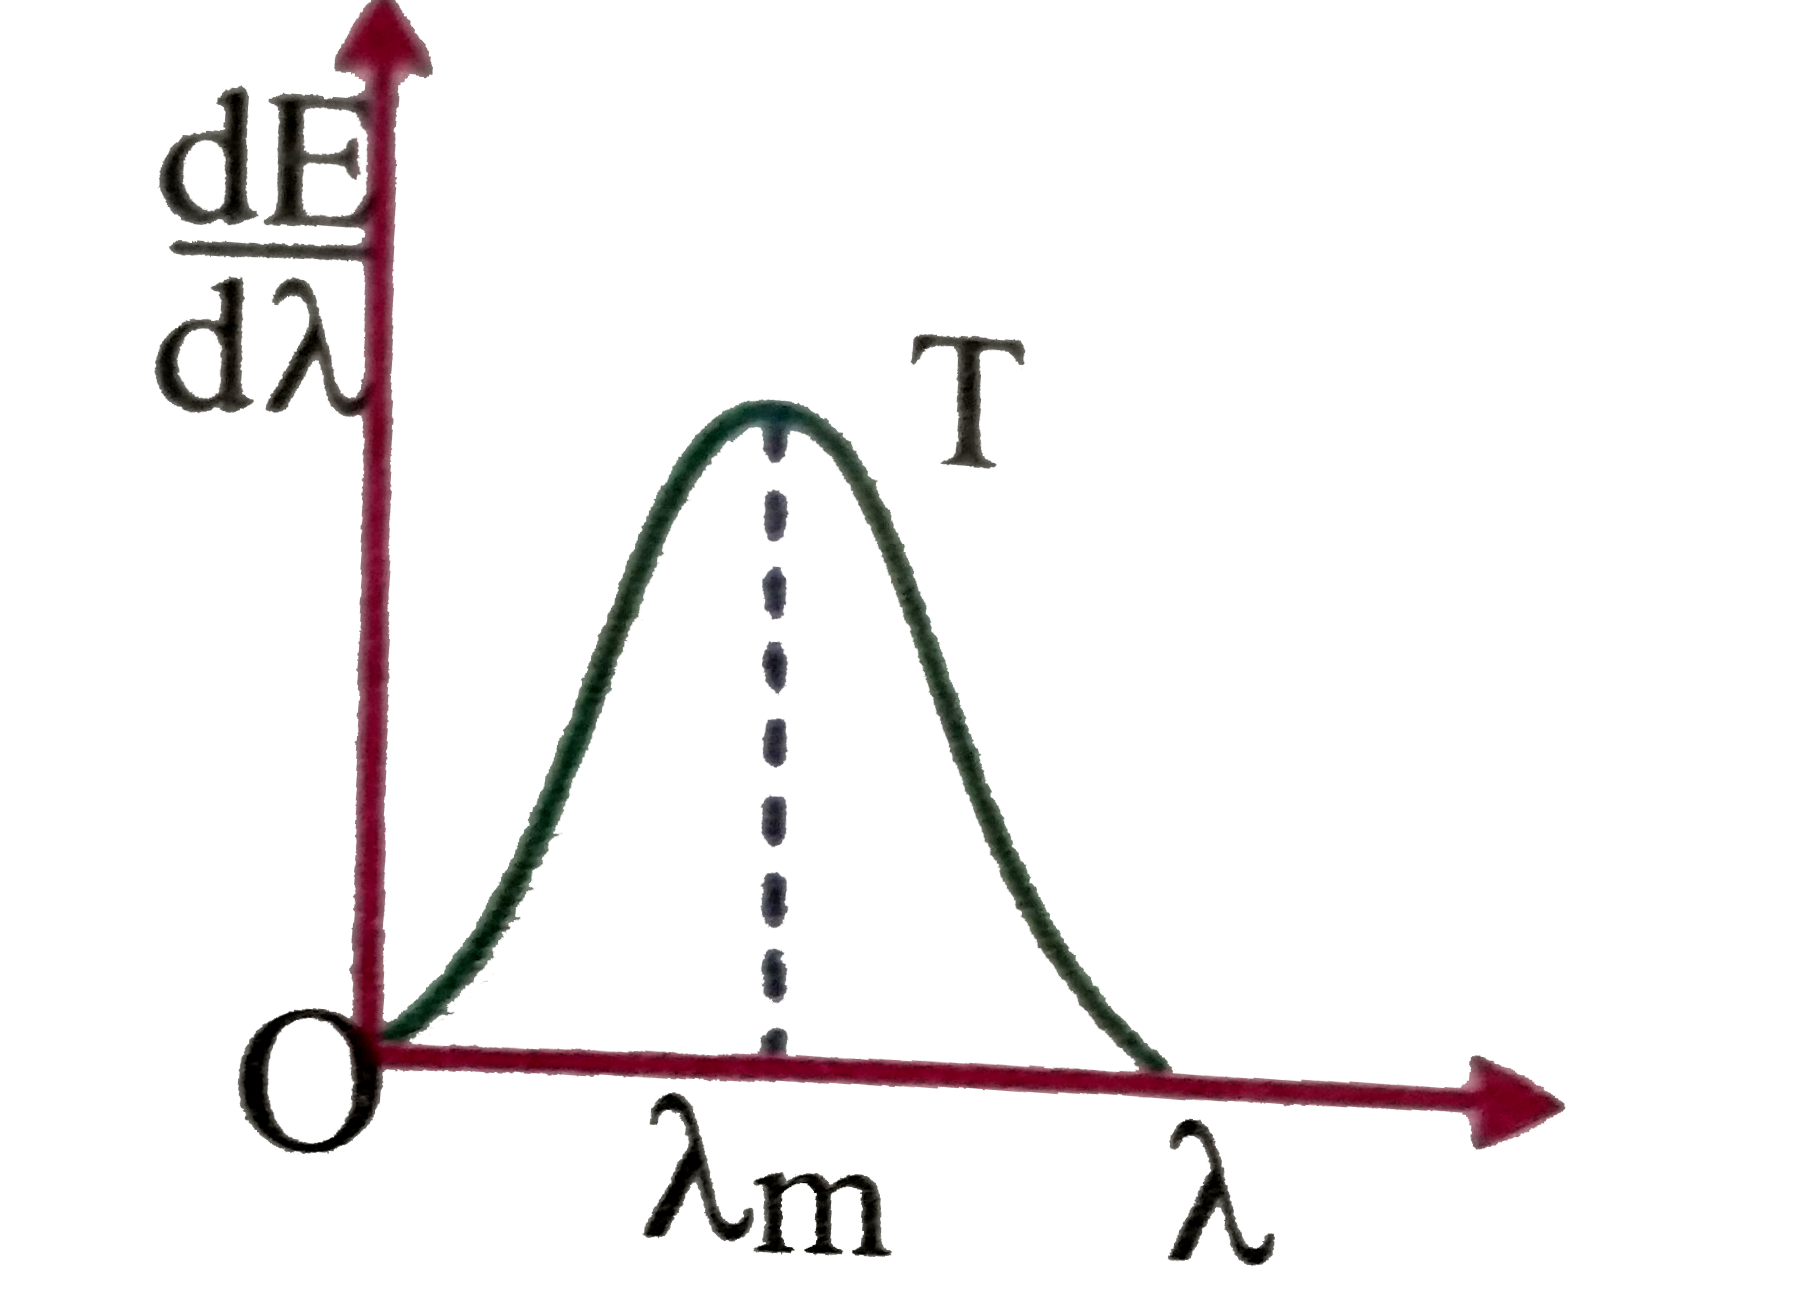
Choose the correct statements (s) .
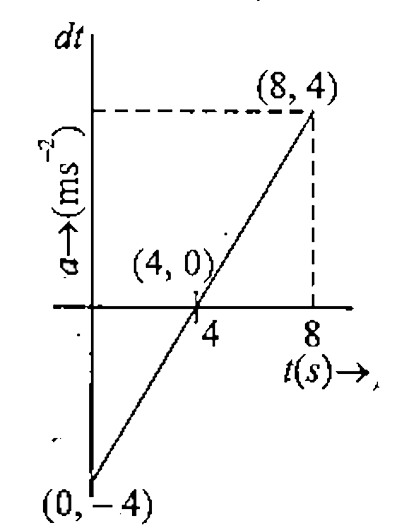
View SolutionIf a particle is moving along a straight line and following is the graph showing acceleration varying with time then choose correct statement(s). At t=0,x=0 and v0=7ms−1
View Solution

