Which of the figures represent a histogram correctly-
<imga≤ocr_imageload∈g=lazysrc=https://d10lpgp6xz60nq.cloudfront.net/physics_images/DBT_SM_MAT_IX_C14_E01_004_O01.pngwh=80%mx-autosty≤=background:white;>
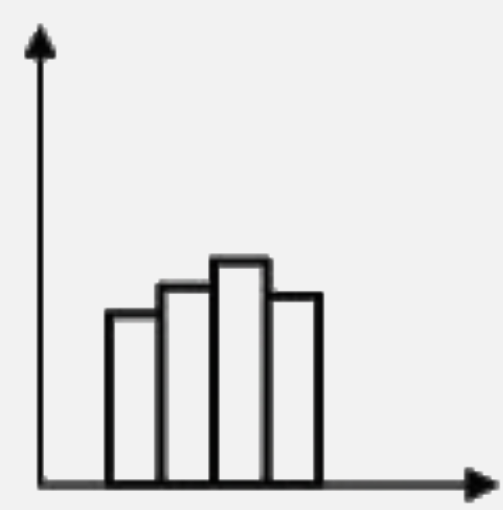
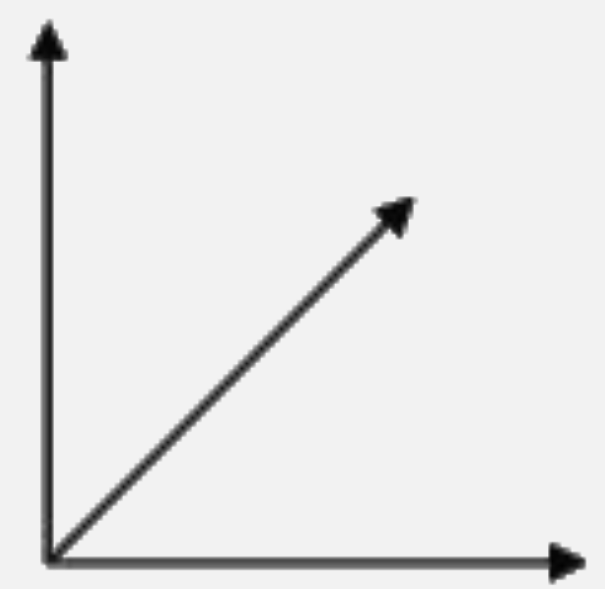
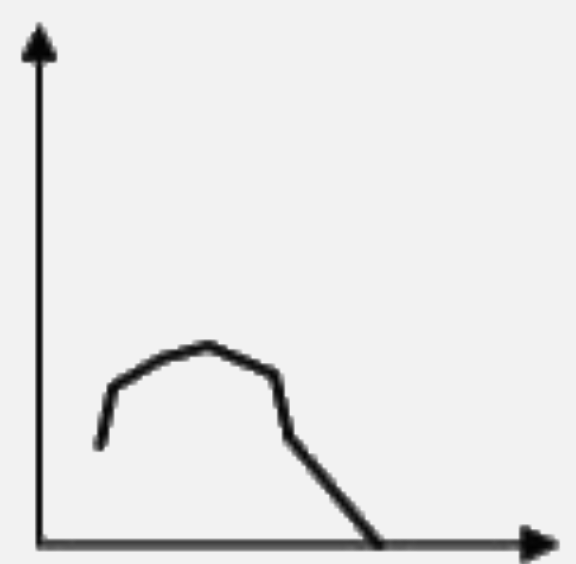
The correct Answer is:A, B, C, D
Step by step video, text & image solution for Which of the figures represent a histogram correctly- by Maths experts to help you in doubts & scoring excellent marks in Class 9 exams.
Updated on:21/07/2023Topper's Solved these Questions
- STATISTICSBOOK - CBSE COMPLEMENTARY MATERIALCHAPTER - STATISTICSEXERCISE - PART B
9 Videos
- STATISTICSBOOK - CBSE COMPLEMENTARY MATERIALCHAPTER - STATISTICSEXERCISE - PART C
3 Videos
- QUARILATERAL BOOK - CBSE COMPLEMENTARY MATERIALCHAPTER - QUARILATERAL EXERCISE - Part - D
5 Videos
- SURFACE AREAS AND VOLUMESBOOK - CBSE COMPLEMENTARY MATERIALCHAPTER - SURFACE AREAS AND VOLUMESEXERCISE - Practice Test
8 Videos
Similar Questions
Knowledge Check
Which of the following figures represents uniform motion of a moving object correctly ?
A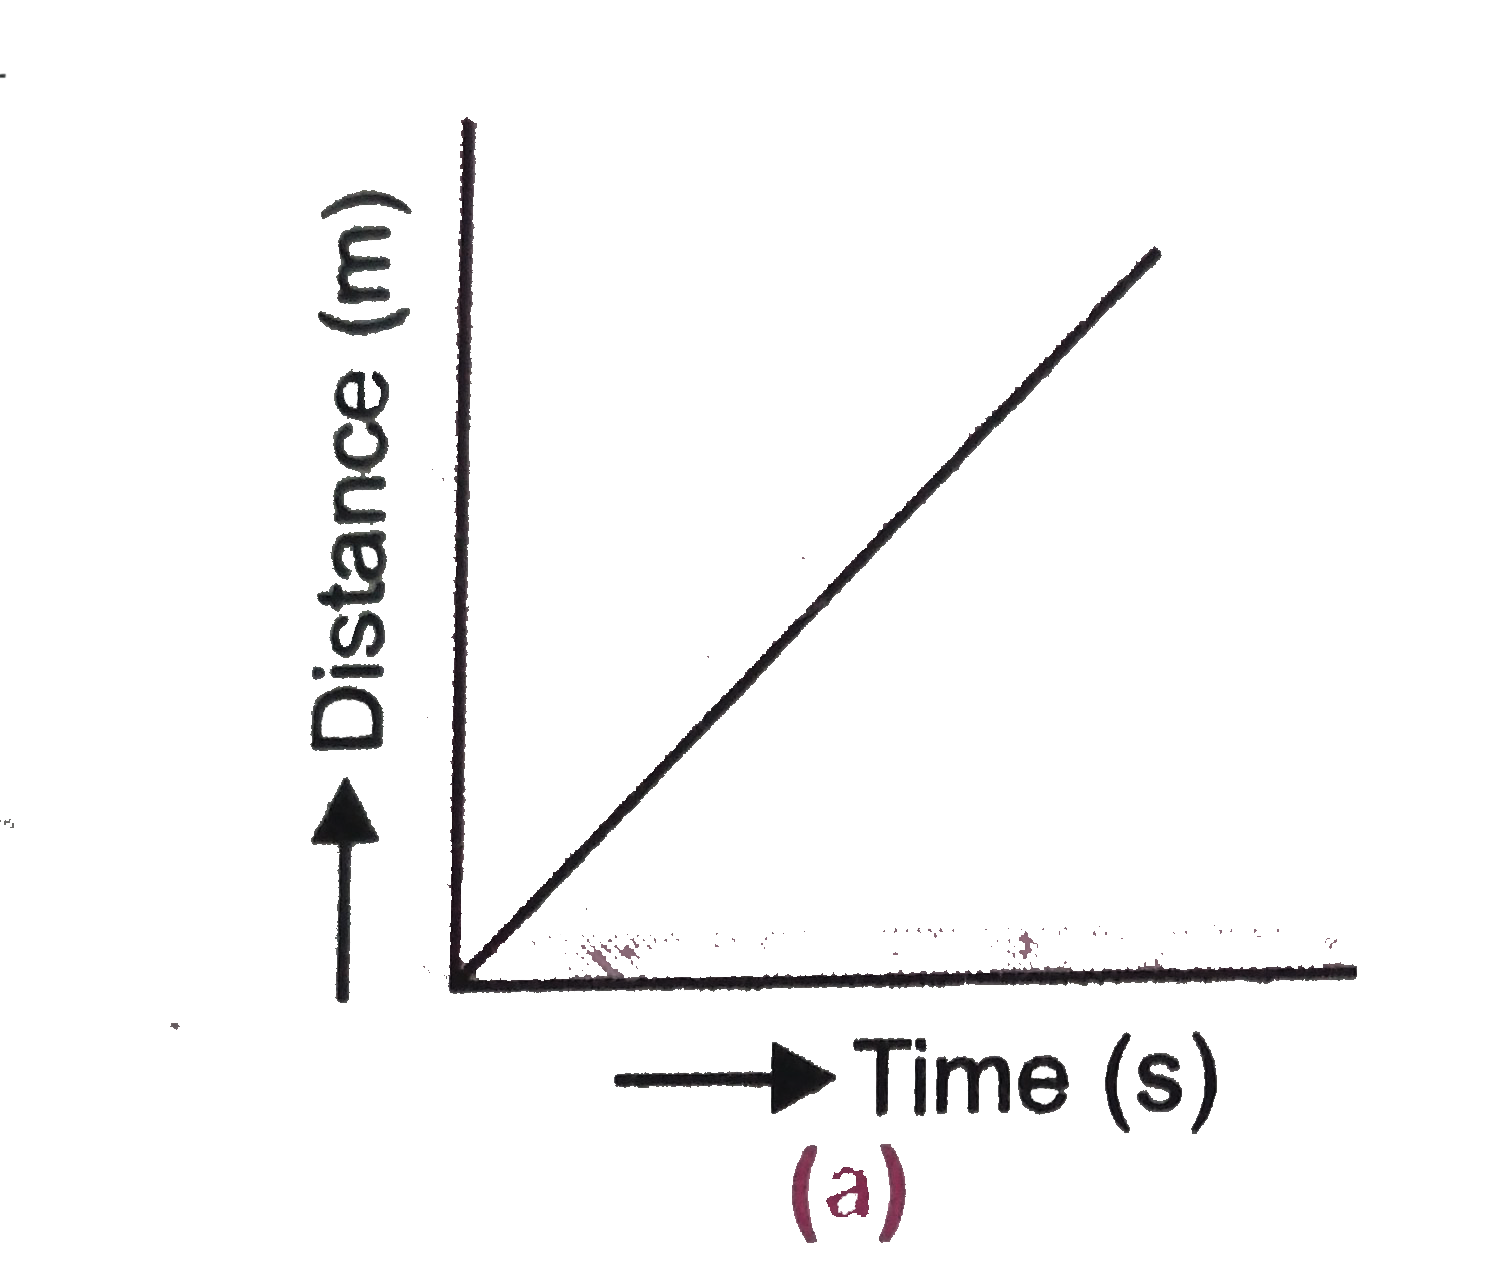 B
B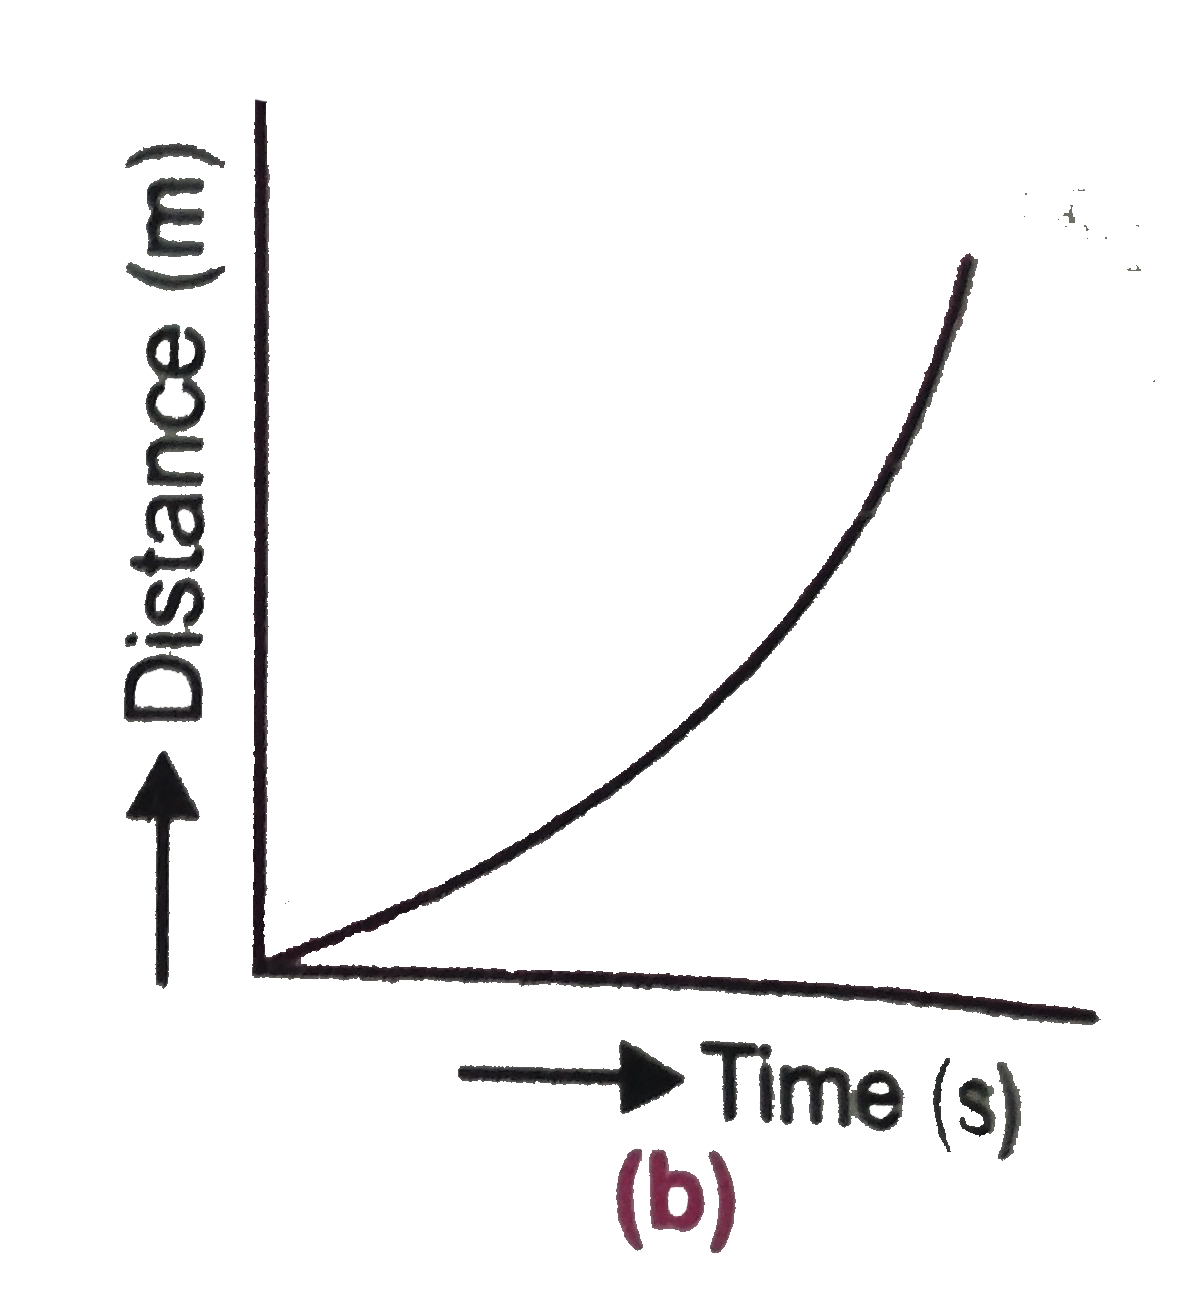 C
C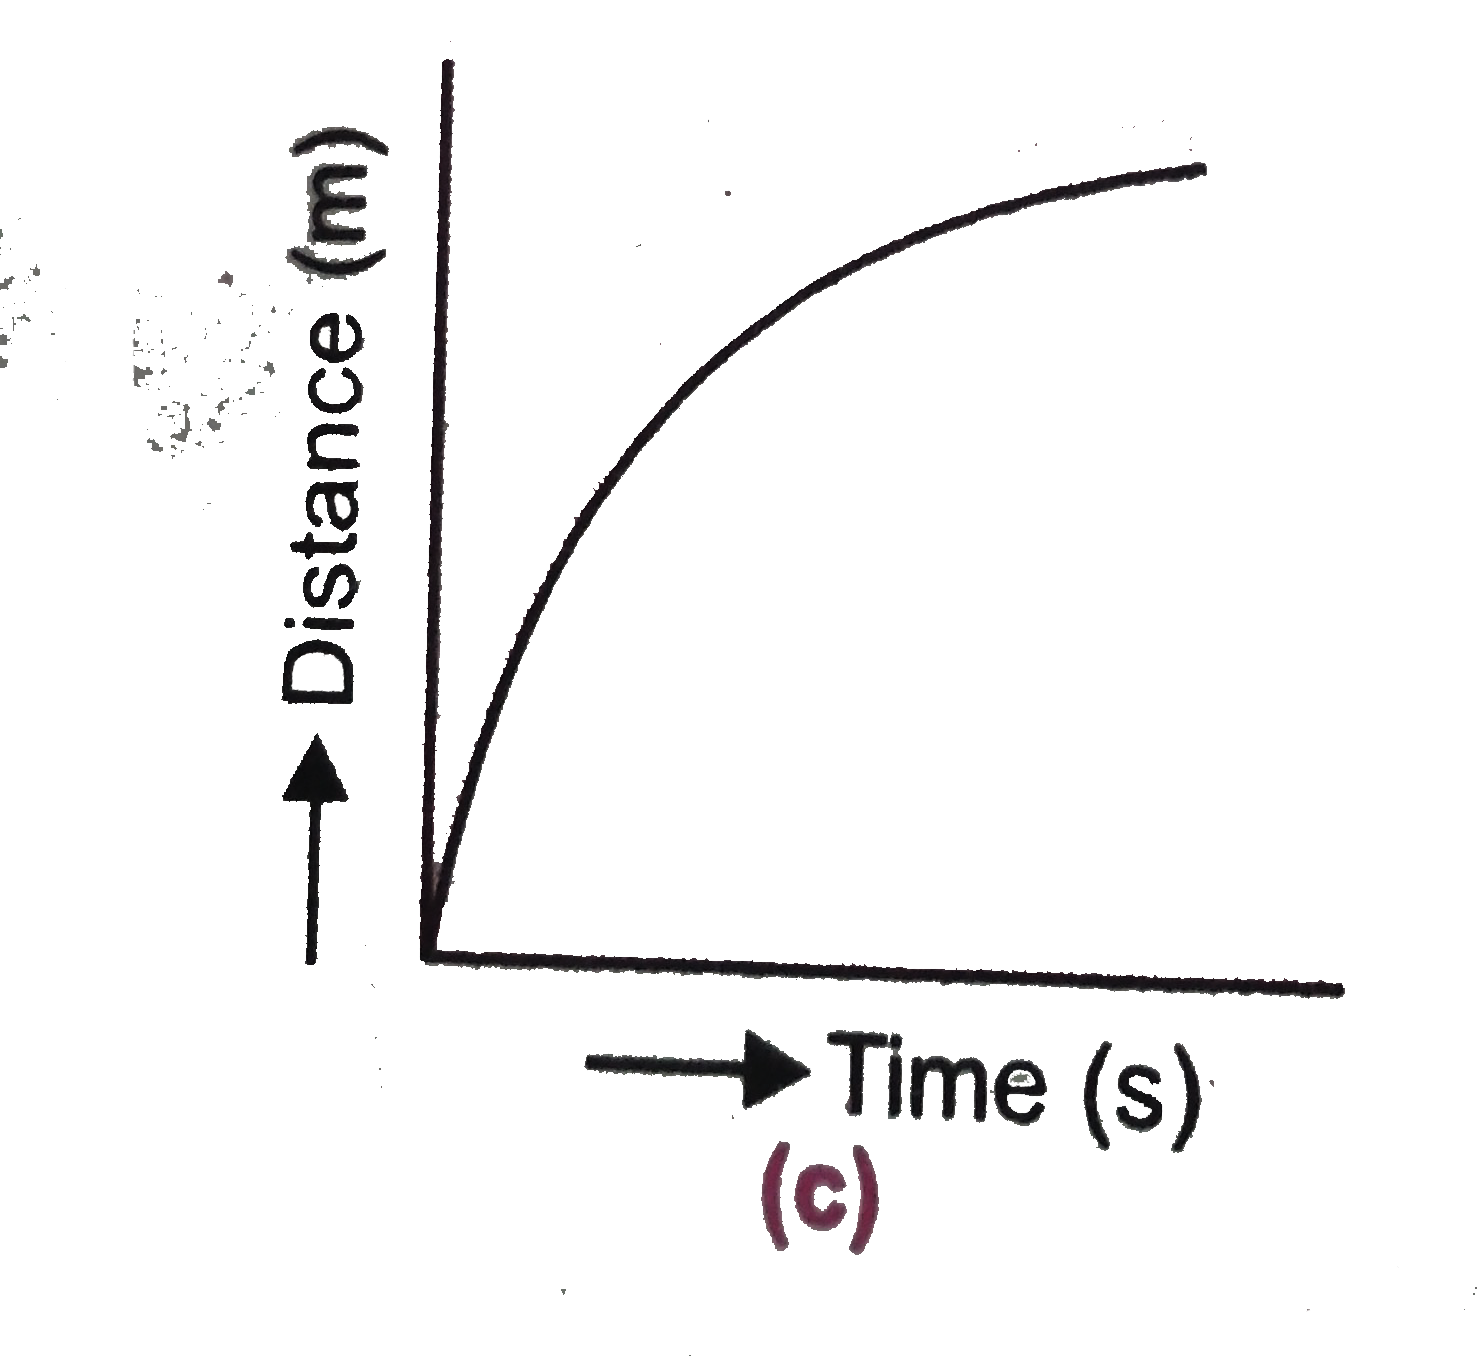 D
D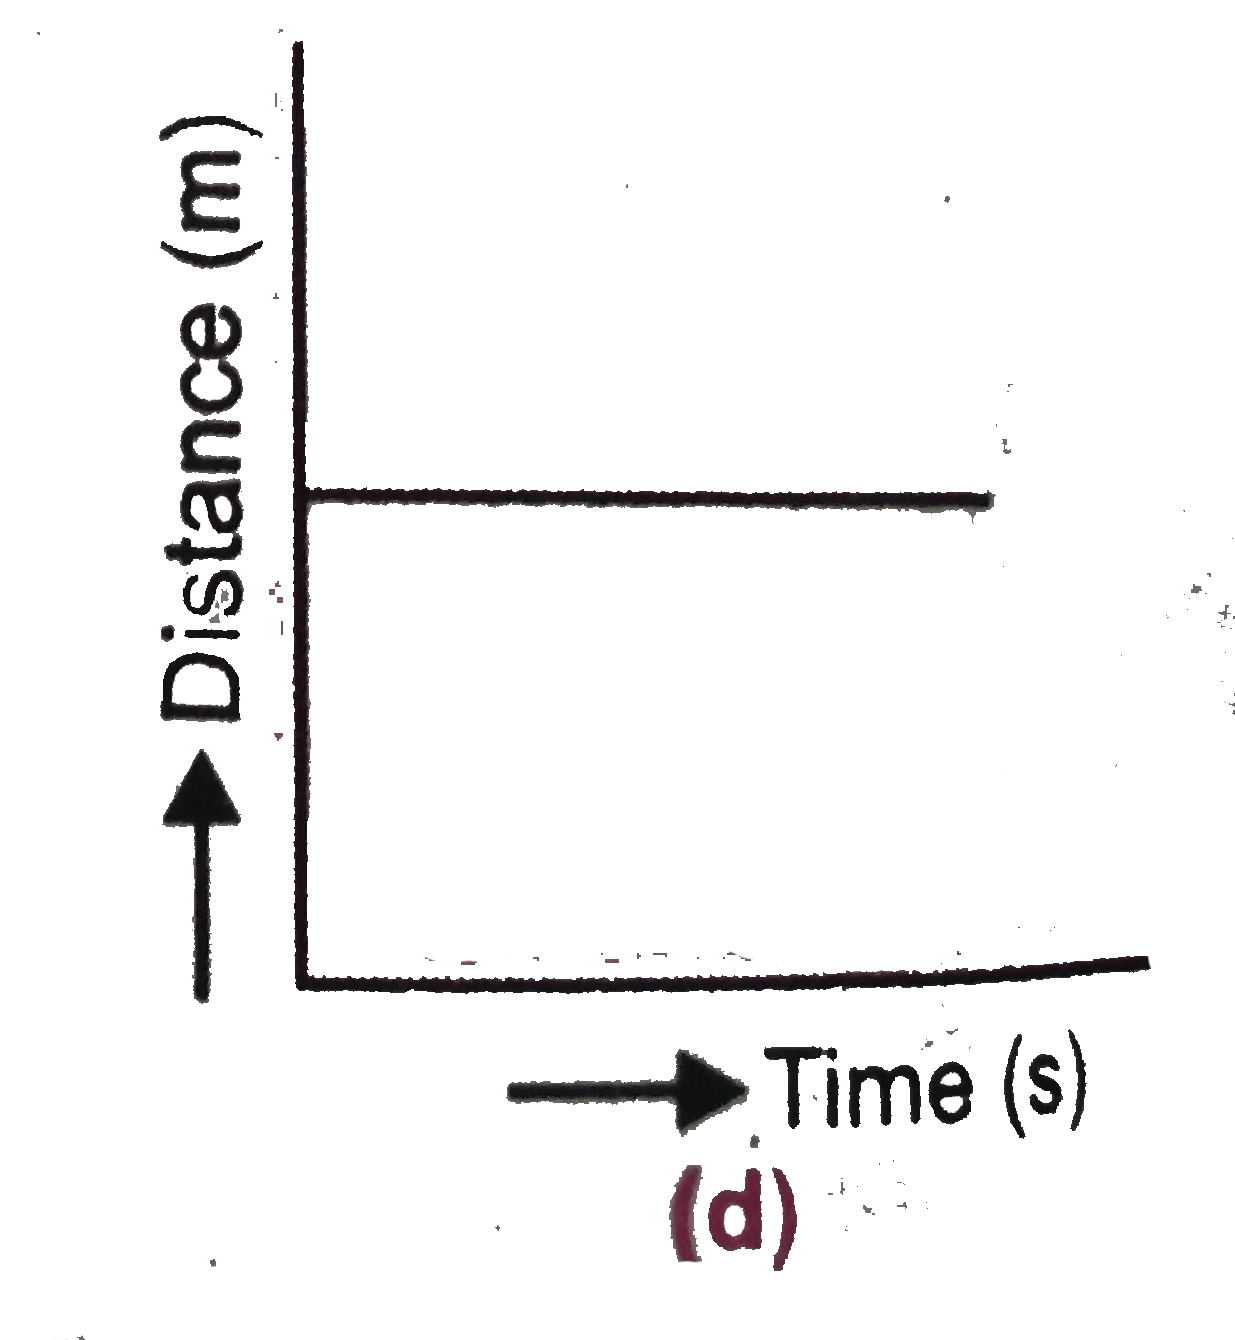
Which one of the following represents correctly the variations of surface tension with temperature θ ?
AT∝θBT∝θ−1CT∝θ2DT∝θ−2Which gate is represented by this figure?
 ANAND gateBAND gateCNOTgateDOR gate
Which of the following correctly represents the structure of tetrahydrofuran ?
View SolutionWhich of the following correctly represents the order of atomic radii
View SolutionWhich one of the following structures is correctly represented.
View SolutionWhich of the following correctly represents the same reaction in which no enzyme is used? Broken line represents the enzyme catalysed reaction for comparison.
View SolutionWhich of the following figures correctly represents the passage of white light through a prism?
View Solution
