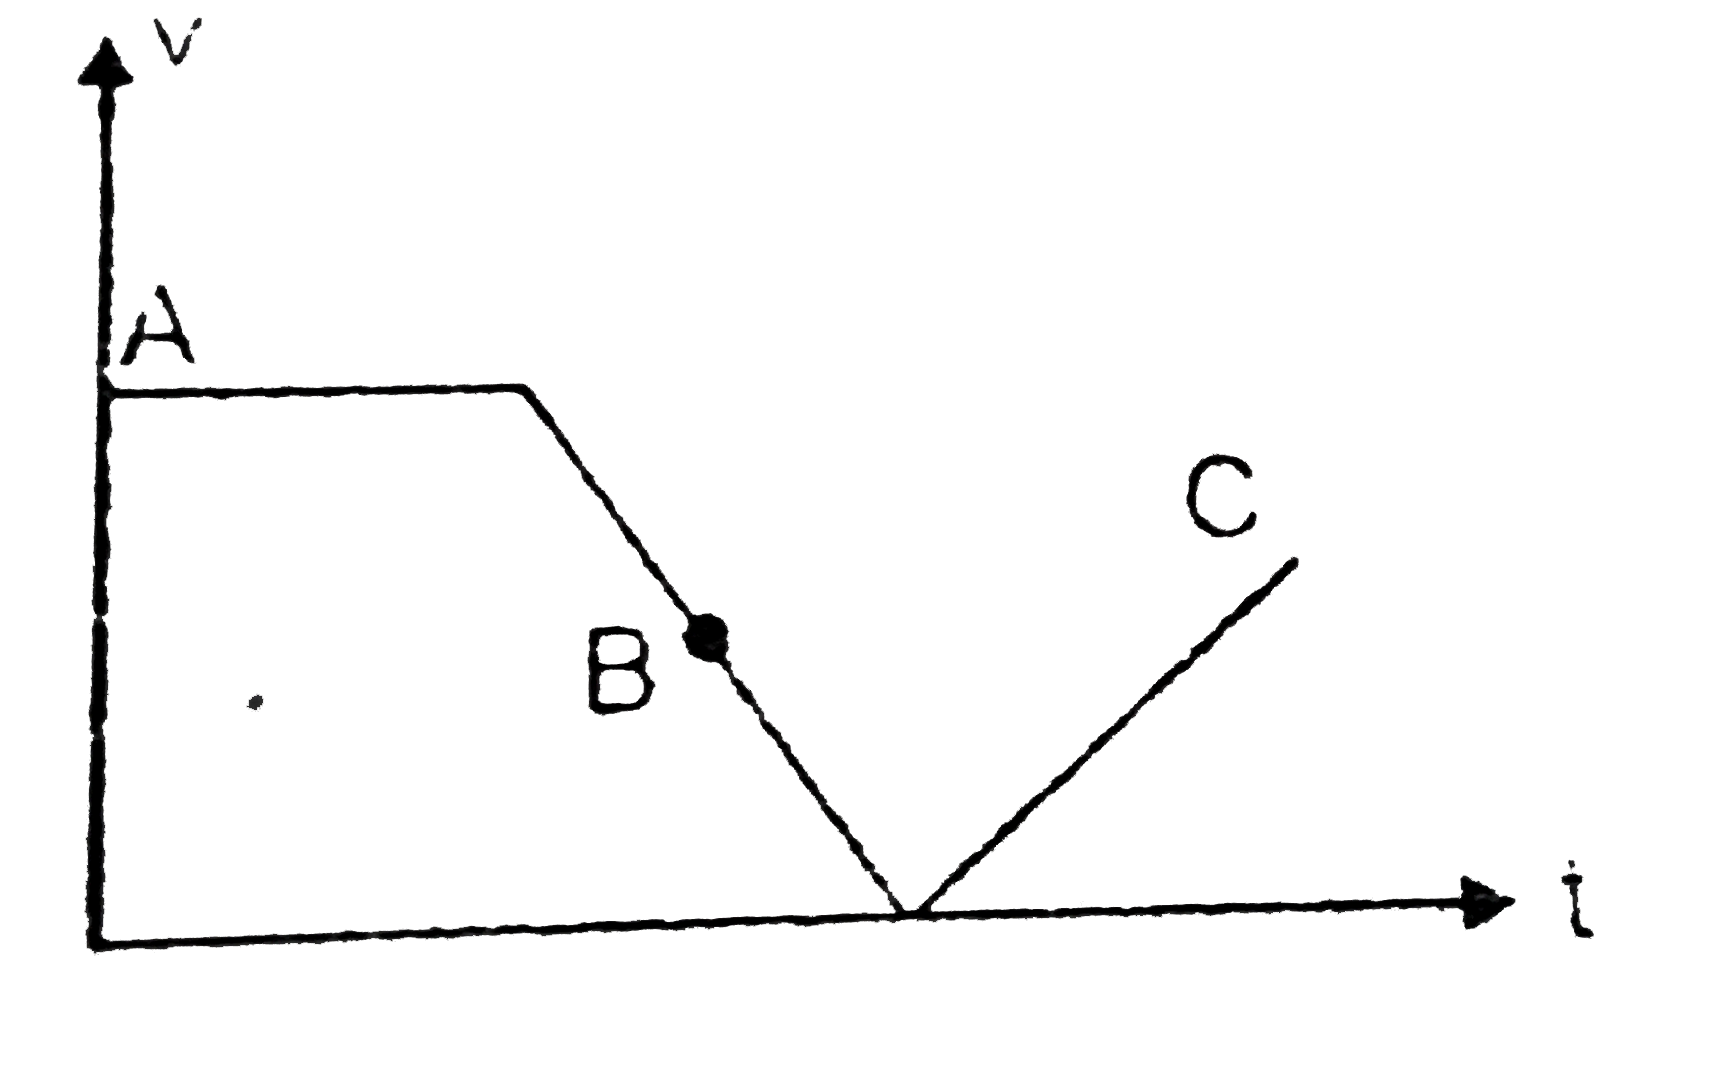
For body of 50 kg. mass, the velocity time graph is shown in figure. Then force acting on the body is :-
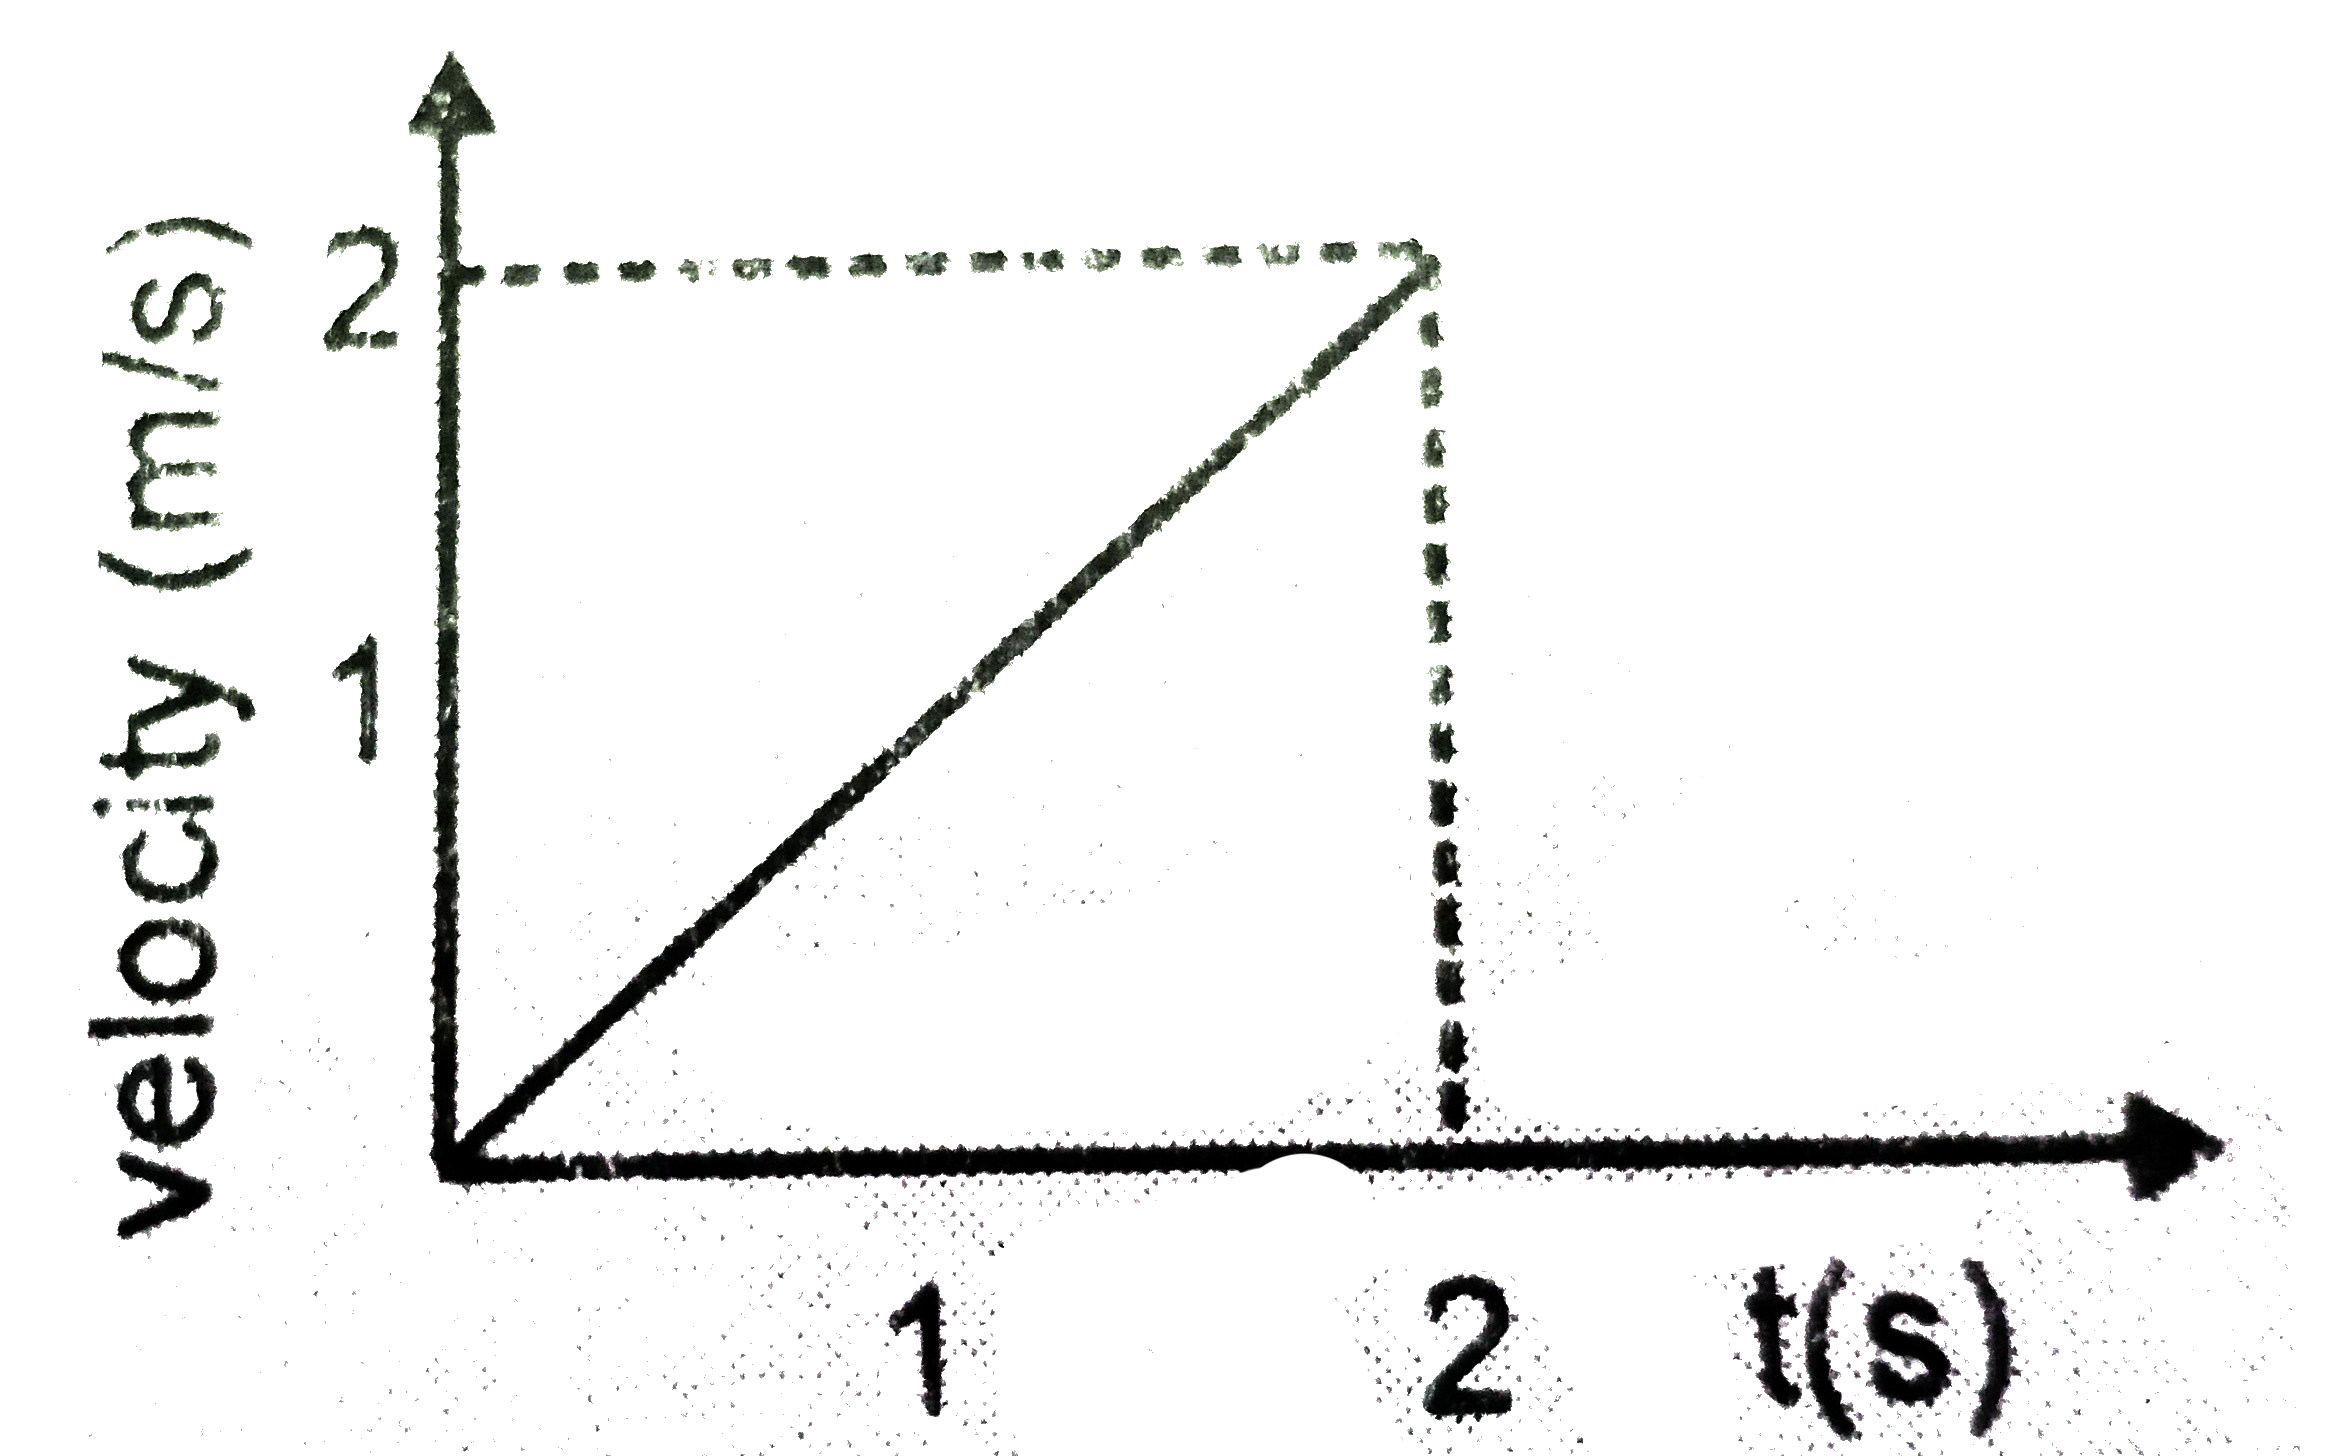
25 N
50 N
12.5 N
100 N
The correct Answer is:B
Step by step video & text solution for For body of 50 kg. mass, the velocity time graph is shown in figure. Then force acting on the body is :- by Physics experts to help you in doubts & scoring excellent marks in Class 12 exams.
Updated on:21/07/2023Similar Questions
Knowledge Check
The kinetic energy of a body moving along a straight line varies with time as shown in figure. The force acting on the body:
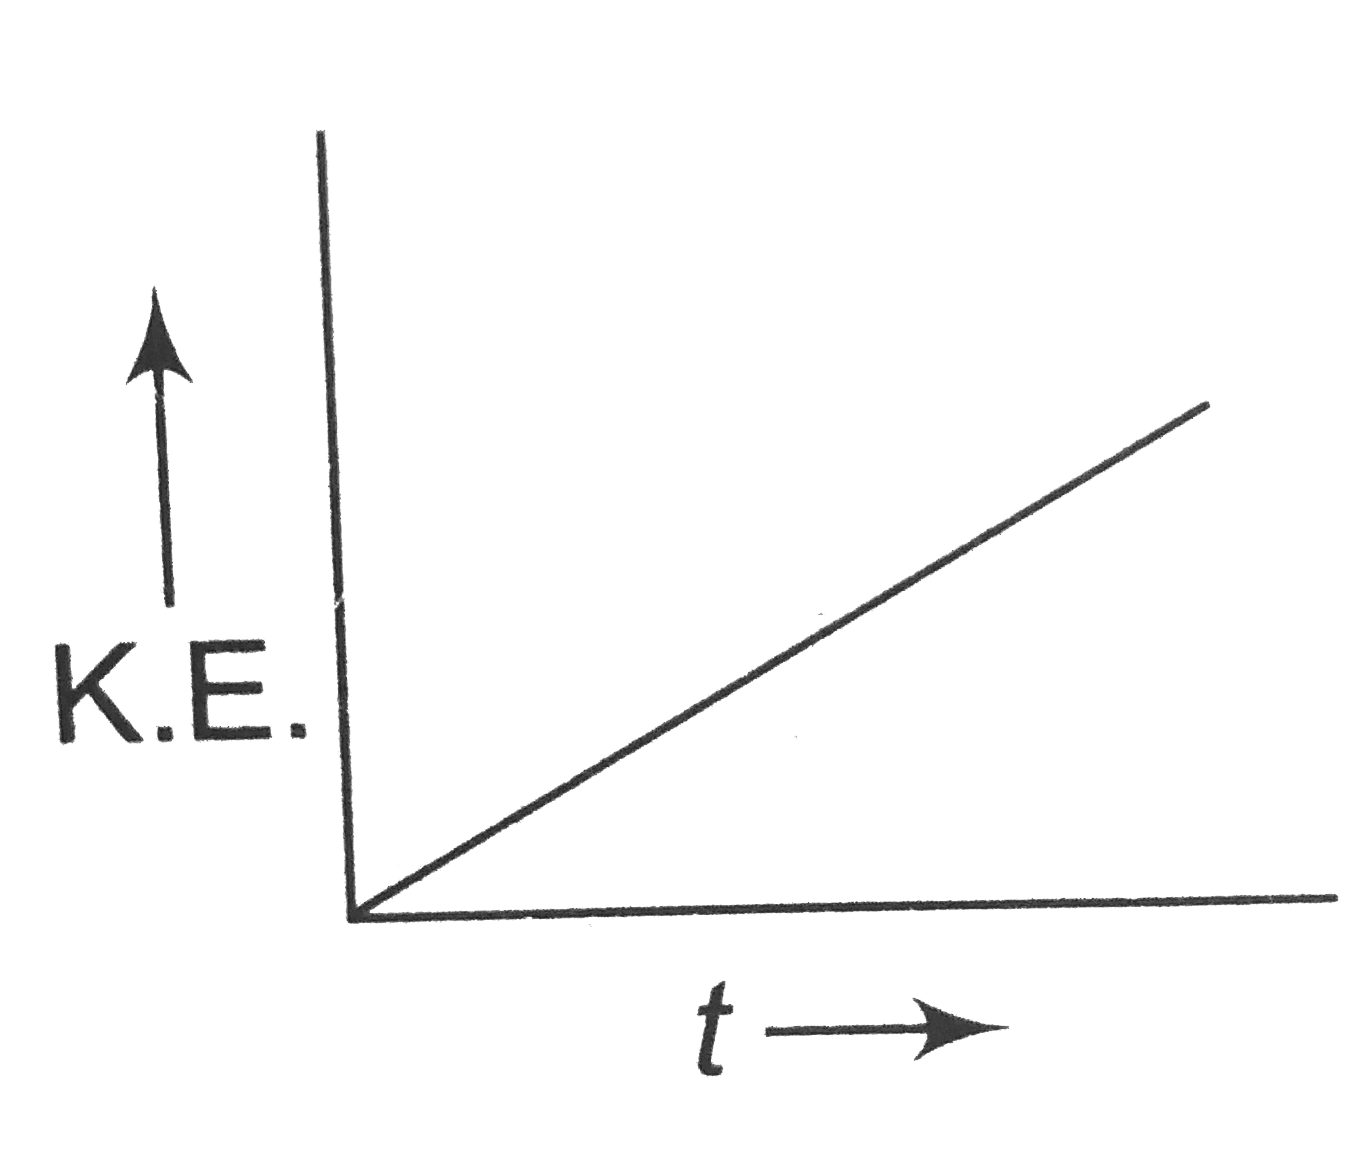 AzeroBconstantCdirectly proportional to velocityDinversely proportional to velocity
The velocity-time graph of a body is shown in .
The displacement of the body in 8s is.
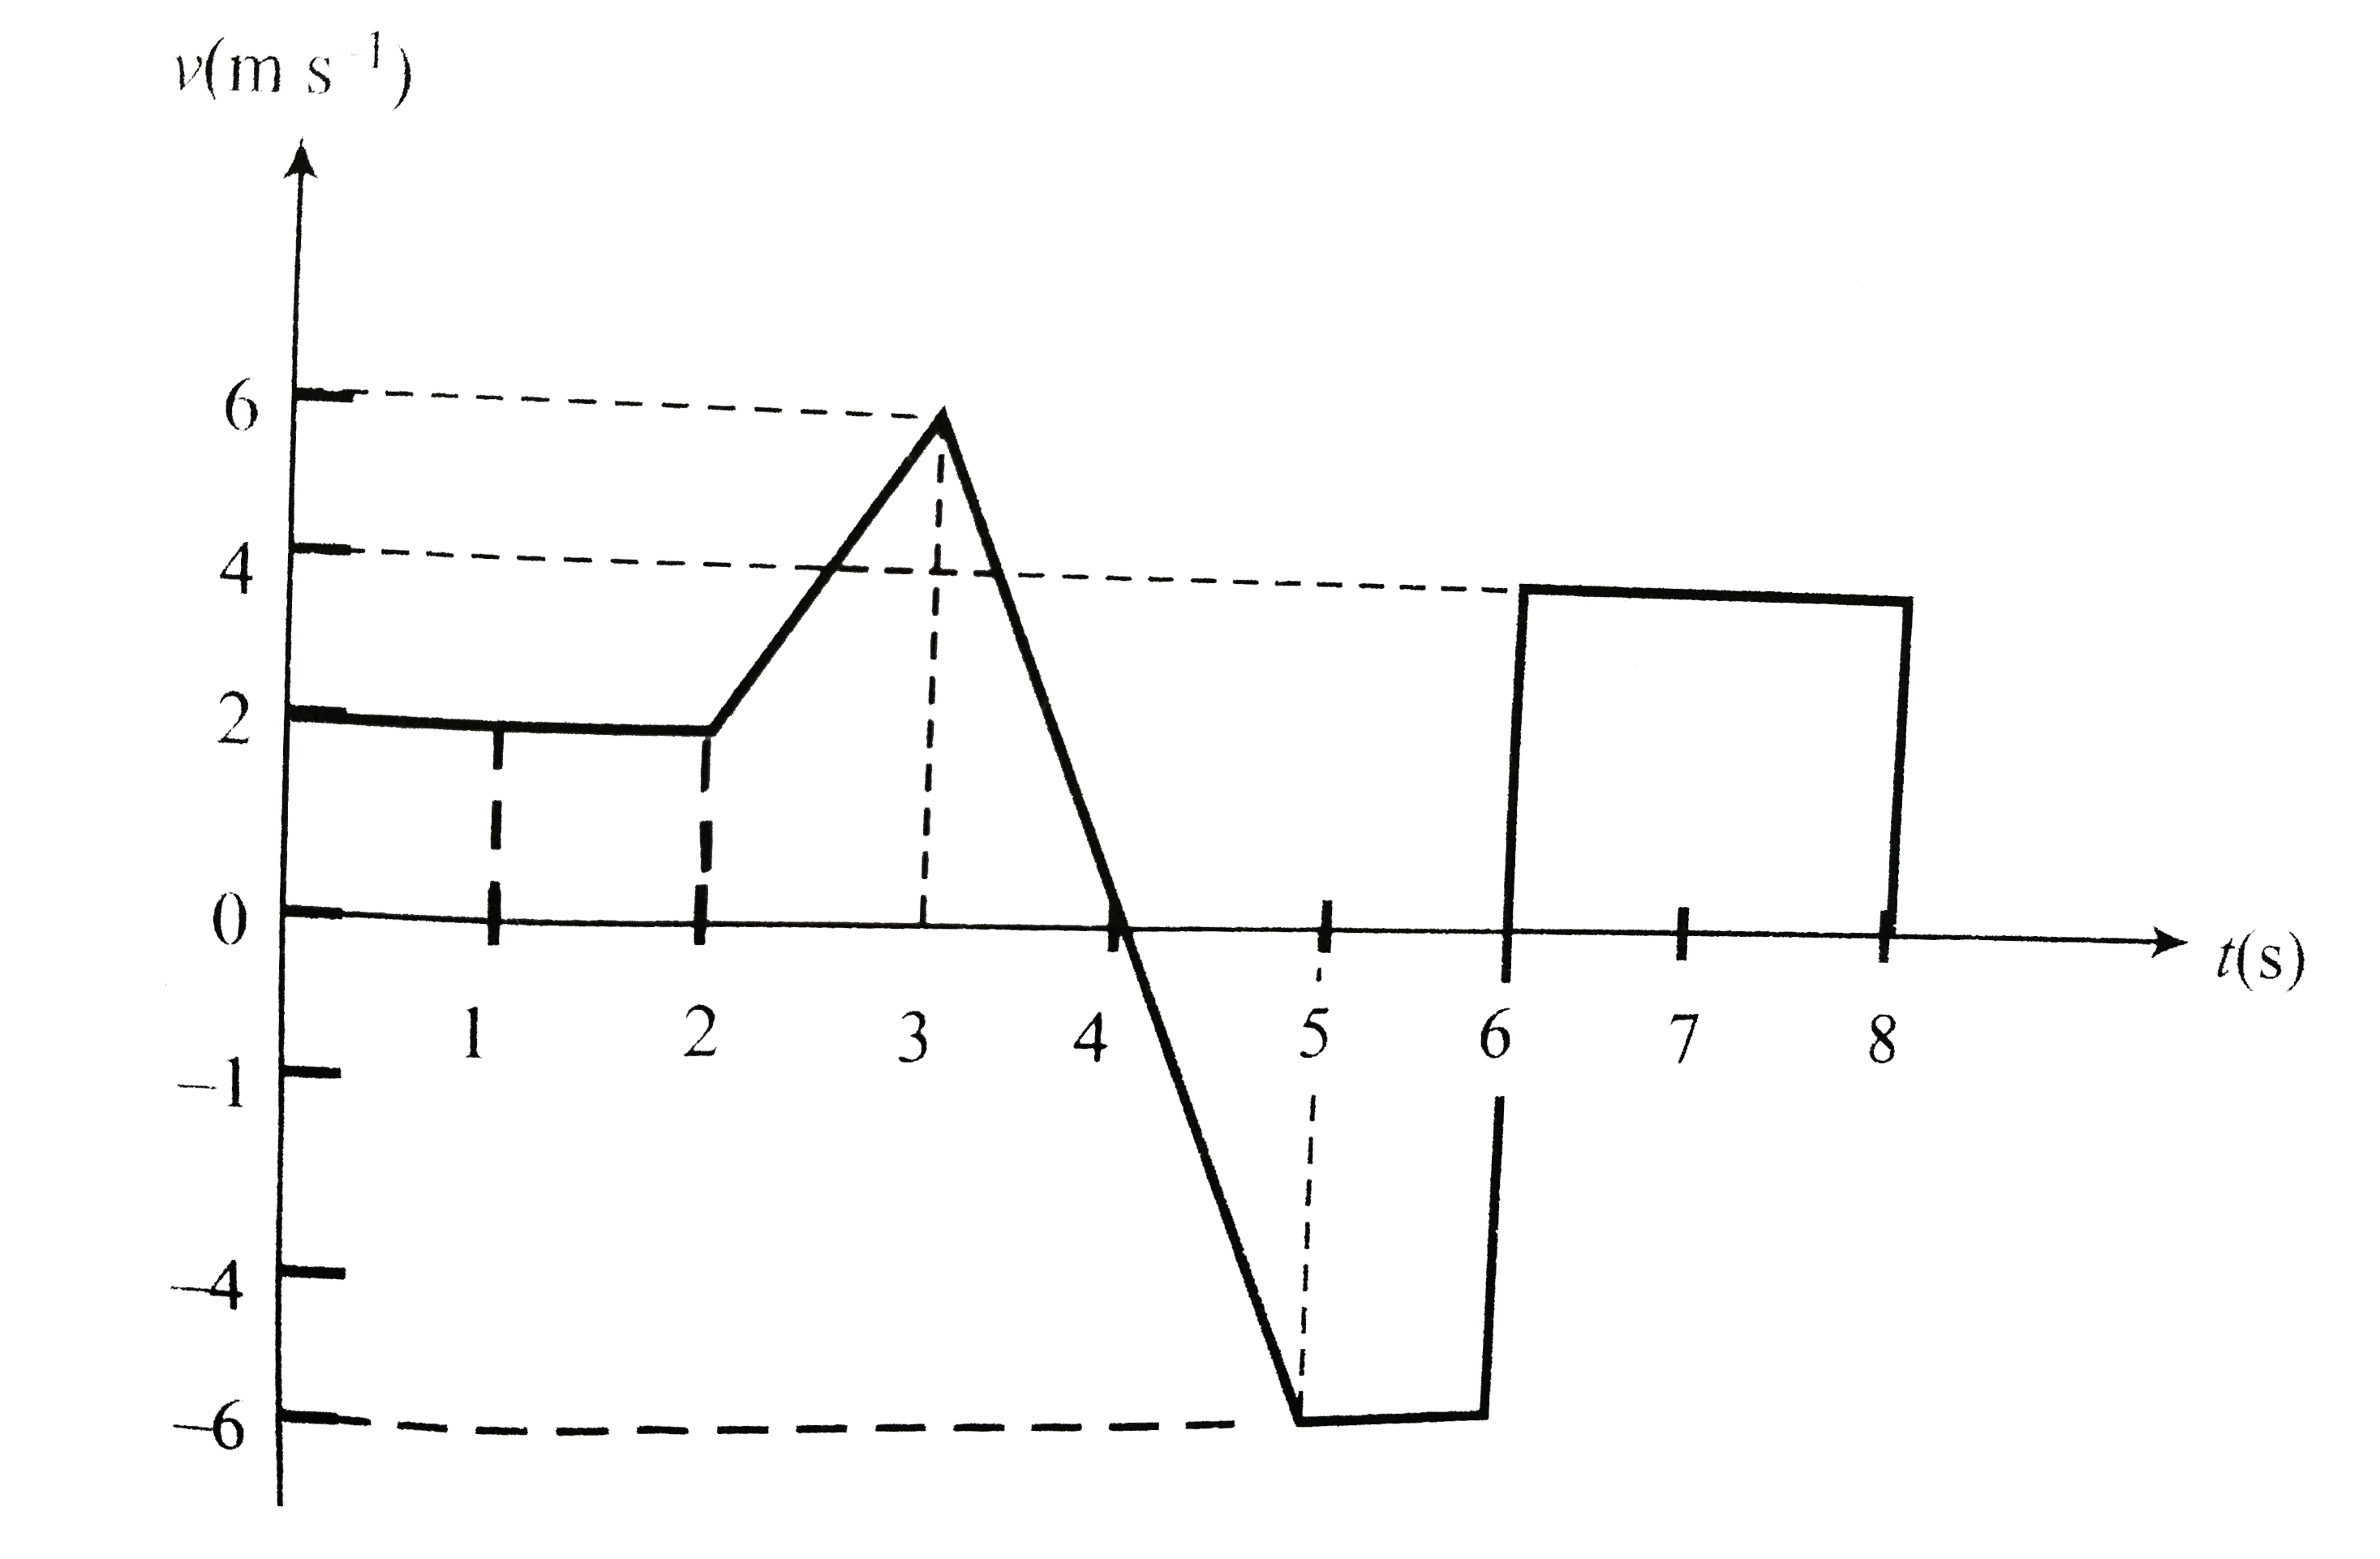 .A9mB12mC10mD28m
A body of 2kg has an initial speed 5ms−1 . A force acts on it for some time in the direction of motion. The force time graph is shown in figure. The force time graph is shown in figure. The final speed of the body is
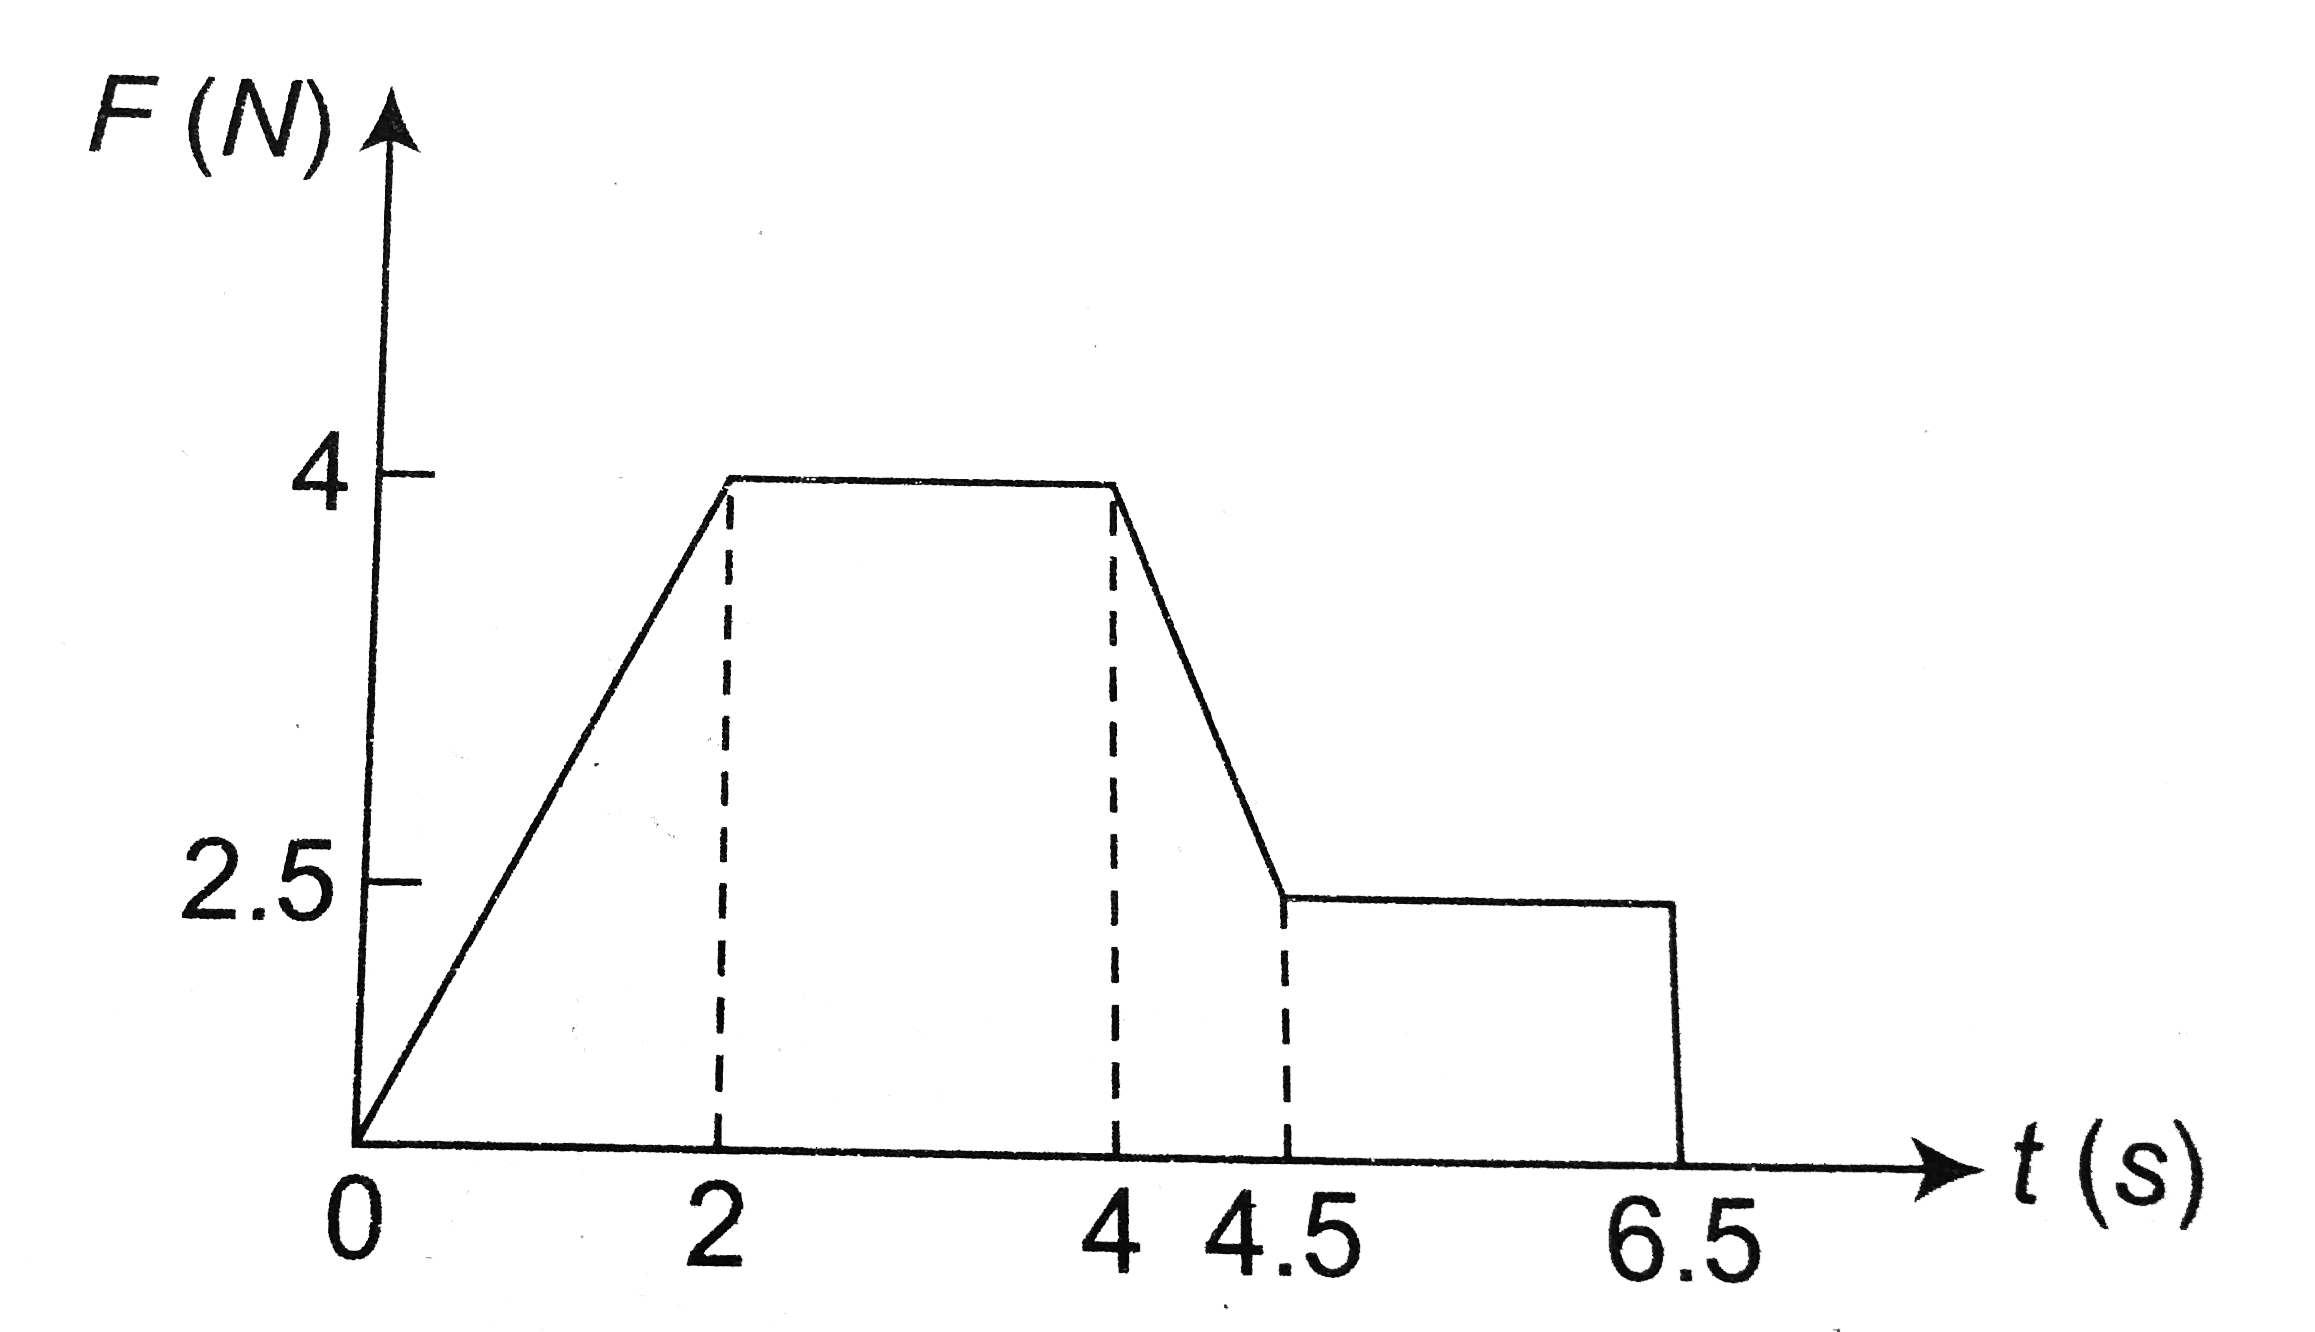 A9.25ms_(−1)B5ms_(−1)C14.25ms_(−1)D4.25ms_(−1)
Velocity versus time graph of a body is shown in figure. It explains that
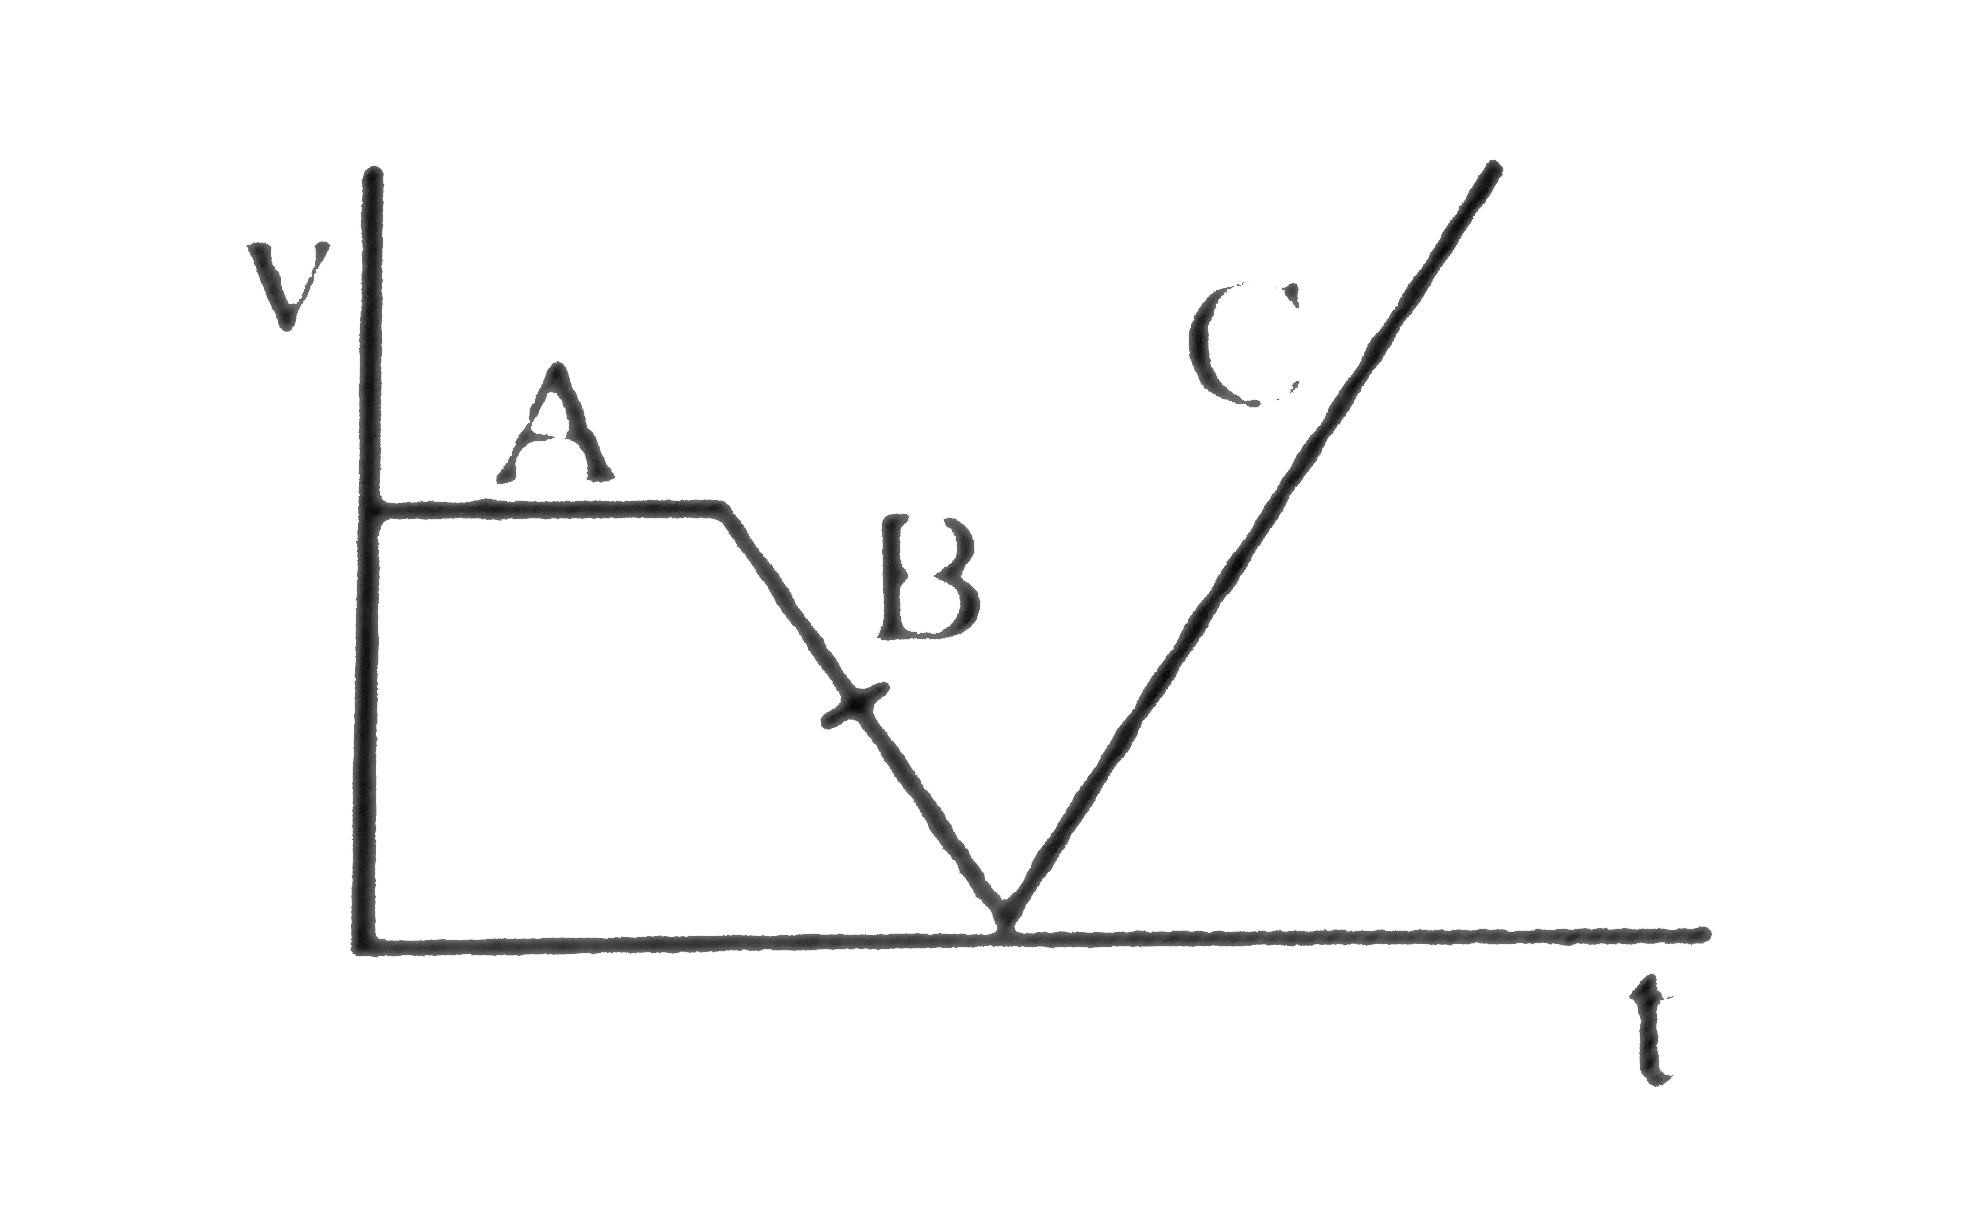
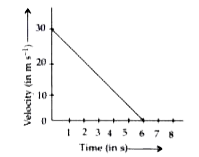
View SolutionThe velocity time graph of a ball moving on the surface of a floor is shown in figure. Find the force acting on the ball if the mass of the ball is 50g.
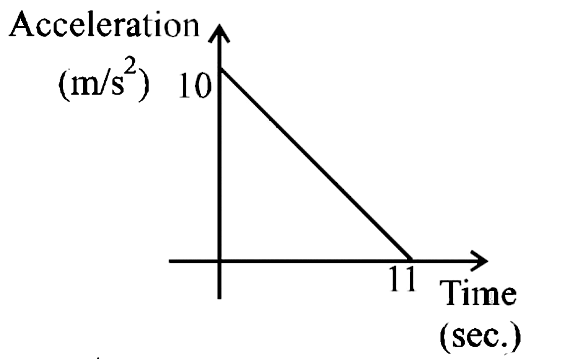
View SolutionA body starts from rest at time t=0 , the acceleration time graph is shown in the figure . The maximum velocity attained by the body will be
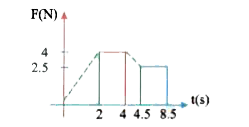
View SolutionA body of mass 2kg has an initial speed 5ms−1. A force acts on it for 8.5 seconds in the direction of motion. The force time graph is shown in figure. The final speed of the body is
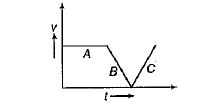
View SolutionThe velocity-time graph of a body is shown in the figure, it implies that at point B
View Solution

