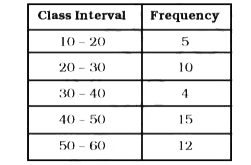
The table given below shows a frequency distribution table, find
(a) Upper limit of third class (b) Lower limit of fifth class
(c) Class size (d) Class mark of third class

Video Solution
Text Solution
(a) Third class is 20-30
Its upper limit = 30
(b) Fifth class is 40-50
Its lower limit = 40
(c) Class size = 10-0= 20-10 = 30-20 = 40-30= 50-40= 60-50 = 10
(d) Third class is 20-30
Its class mark=20+302=25
|
Topper's Solved these Questions
- STATISTICSBOOK - NAGEEN PRAKASHANCHAPTER - STATISTICSEXERCISE - Problems From NCERT/exemplar
22 Videos
- STATISTICSBOOK - NAGEEN PRAKASHANCHAPTER - STATISTICSEXERCISE - Exercise 14a
10 Videos
- QUADRILATERALSBOOK - NAGEEN PRAKASHANCHAPTER - QUADRILATERALSEXERCISE - Revision Exercise (long Answer Questions)
5 Videos
- SURFACE AREA AND VOLUMEBOOK - NAGEEN PRAKASHANCHAPTER - SURFACE AREA AND VOLUMEEXERCISE - Revision Exercise (long Answer Questions)
10 Videos
Similar Questions
Knowledge Check
Consider the frequency distribution.

The upper limit of median class isA17B17.5C18D18.5In a frequency distribution, the mid value of a class is 10 and the width of the class is 6. The lower limit of the class is
A8B7C10D12In a frequency distribution, the mid values of a class is 10 and width of the class is 6. The lower limit of the class is
A6.5B7C8.5D12
For the following frequency distribution

The upper limit of median class is
View SolutionGiven below is a frequency distribution table. Read it and answer the questions that follow:

What is the upper limit of the last class interval?
View SolutionGiven below is a frequency distribution table. Read it and answer the questions that follow:

What is the lower limit of the second class interval?
View SolutionGiven below is a frequency distribution table. Read it and answer the questions that follow:

What is the class size?
View SolutionConsider the following frequency distribution

The upper limit of the median class in
View Solution


