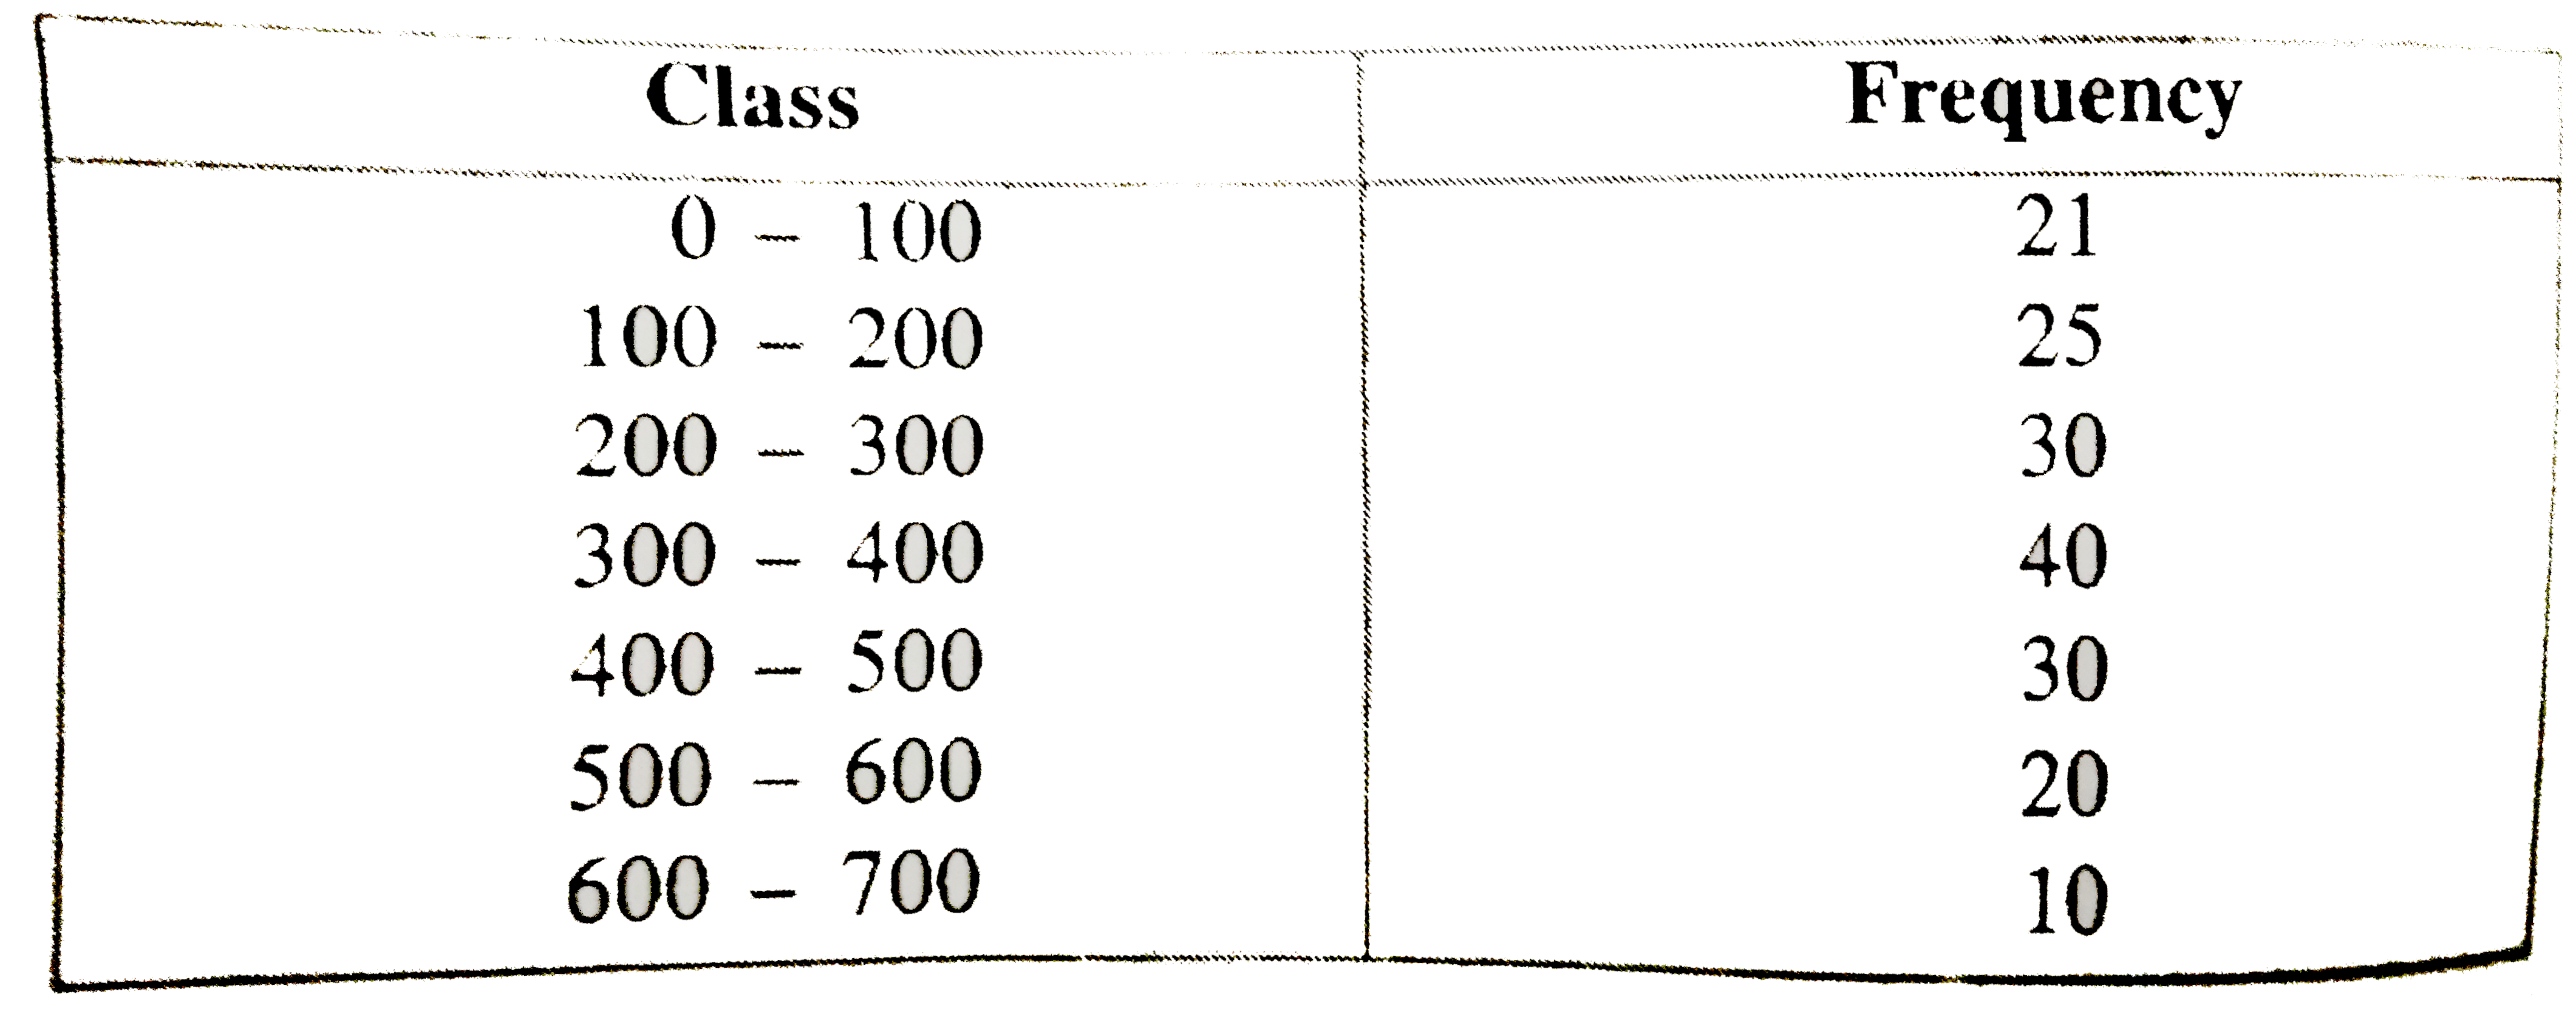
Calculate mode of the following series , using the Graphic Technique :

Video Solution
Text Solution
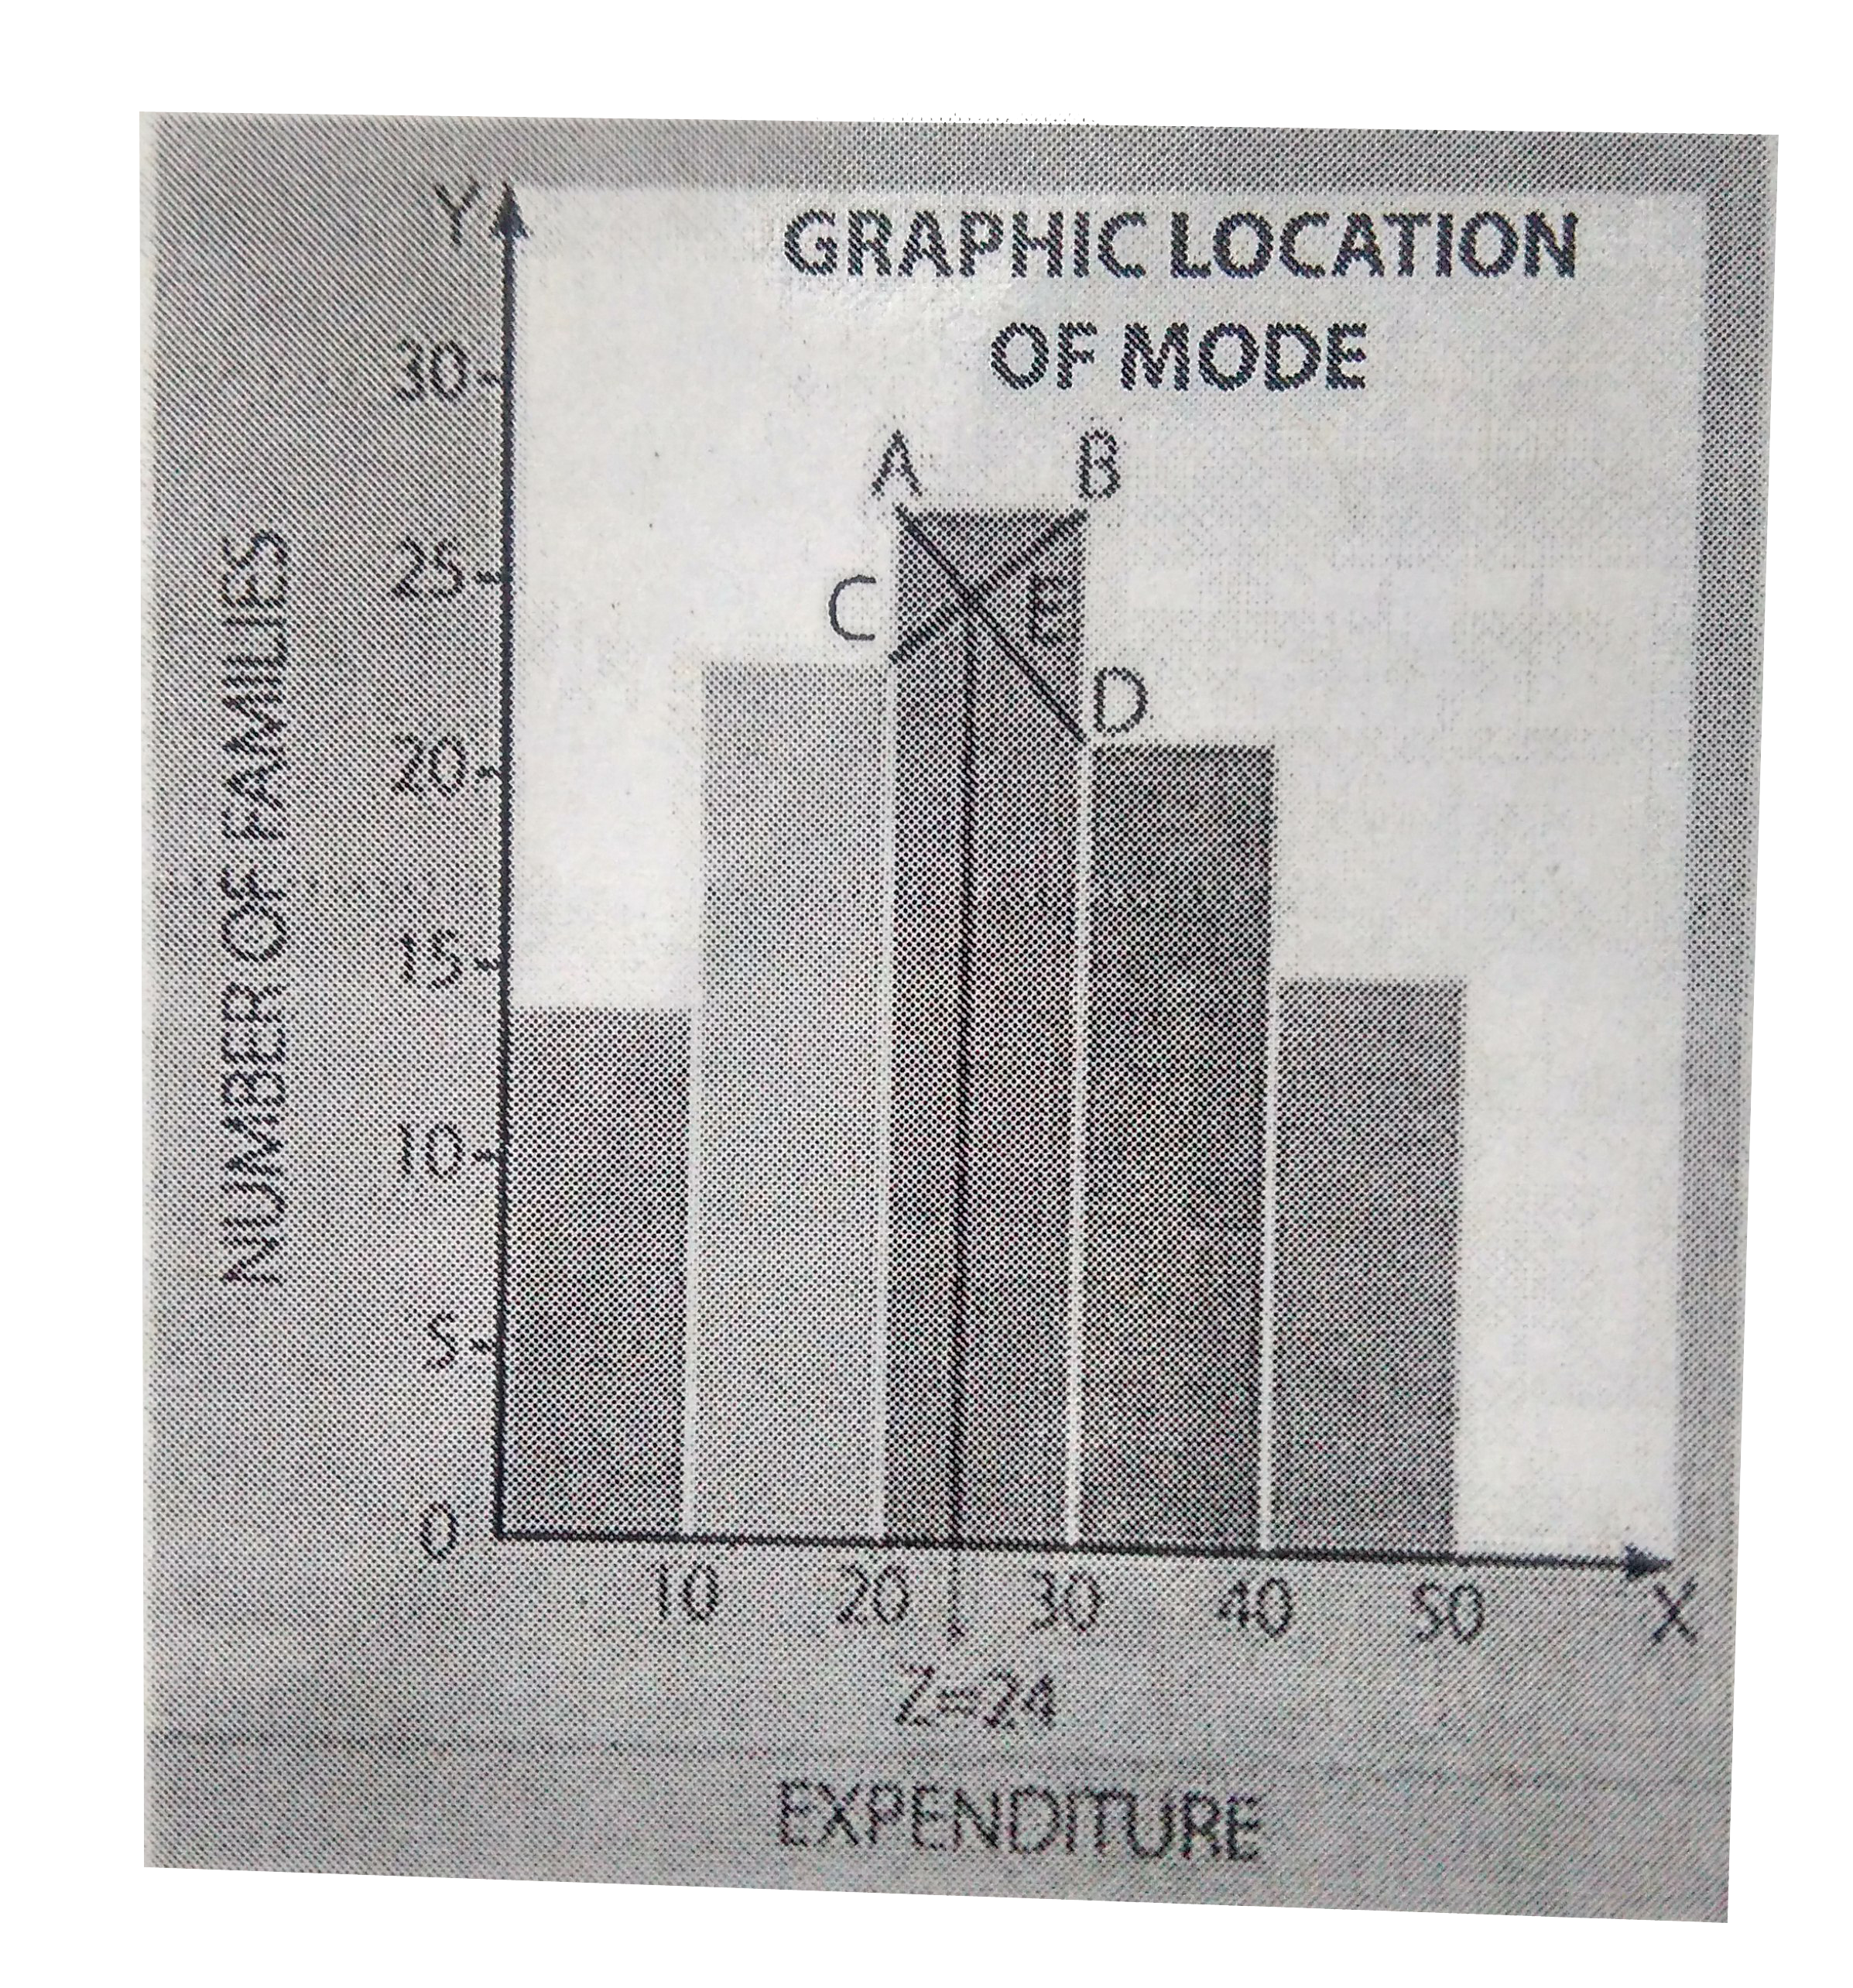
The adjoining graph shows expenditure on the X-axis and number of families on the Y-axis . As is evident , class interval 20-30 corresponds to the highest rectangle in the graph , and is therefore , the modal class intervel.
For the calculation of model value , AD and BC lines are drawn to join the top ends of the model rectangle with the immediate next ends of the adjoining rectangles . these lines are crossing each other at point E. A perpendicular is drawn from point E on the X- axis to locate the exact value of mode which is 24.A counter check of this modal value may be made by calculating mode with the following formula :
Z=l1+f1−f02f1−f0−f2×i
=20+27−232(27)−23−21×10
=20+454−44×10
=20+410×10
=20+4=24
Thus, Mode (Z) =24.

|
Topper's Solved these Questions
- MEASURES OF CENTRAL TENDENCY MEDIAN AND MODEBOOK - TARUN JAIN & VK OHRICHAPTER - MEASURES OF CENTRAL TENDENCY MEDIAN AND MODEEXERCISE - Miscellaneous Illustrations
30 Videos
- MEASURES OF CENTRAL TENDENCY MEDIAN AND MODEBOOK - TARUN JAIN & VK OHRICHAPTER - MEASURES OF CENTRAL TENDENCY MEDIAN AND MODEEXERCISE - Objective Type Questios
26 Videos
- MEASURES OF CENTRAL TENDENCY - ARITHMETIC MEANBOOK - TARUN JAIN & VK OHRICHAPTER - MEASURES OF CENTRAL TENDENCY - ARITHMETIC MEANEXERCISE - Illustration
72 Videos
- MEASURES OF DISPERSIONBOOK - TARUN JAIN & VK OHRICHAPTER - MEASURES OF DISPERSIONEXERCISE - Learning by doing
30 Videos
Similar Questions
Knowledge Check
Calculate range of the following series
 A10B14C8D12
Calculate mode from the following :
 A645B345C350D420
Which of the following is not used in visual interpretation technique ?
ASpatial arragements of objectsBFrequency of tonal change o the imageCLocation of objects with respect to other objectsDDigital image processing.
Calculate the mode.

View SolutionCalculate the mode.

View SolutionCalculate standard deviation of the following series:

View SolutionThe mode of the following series is 36. Find the missing frequency in it :

View SolutionThe mode of the following series is 17.3 . Find the missing frequecny :

View Solution


