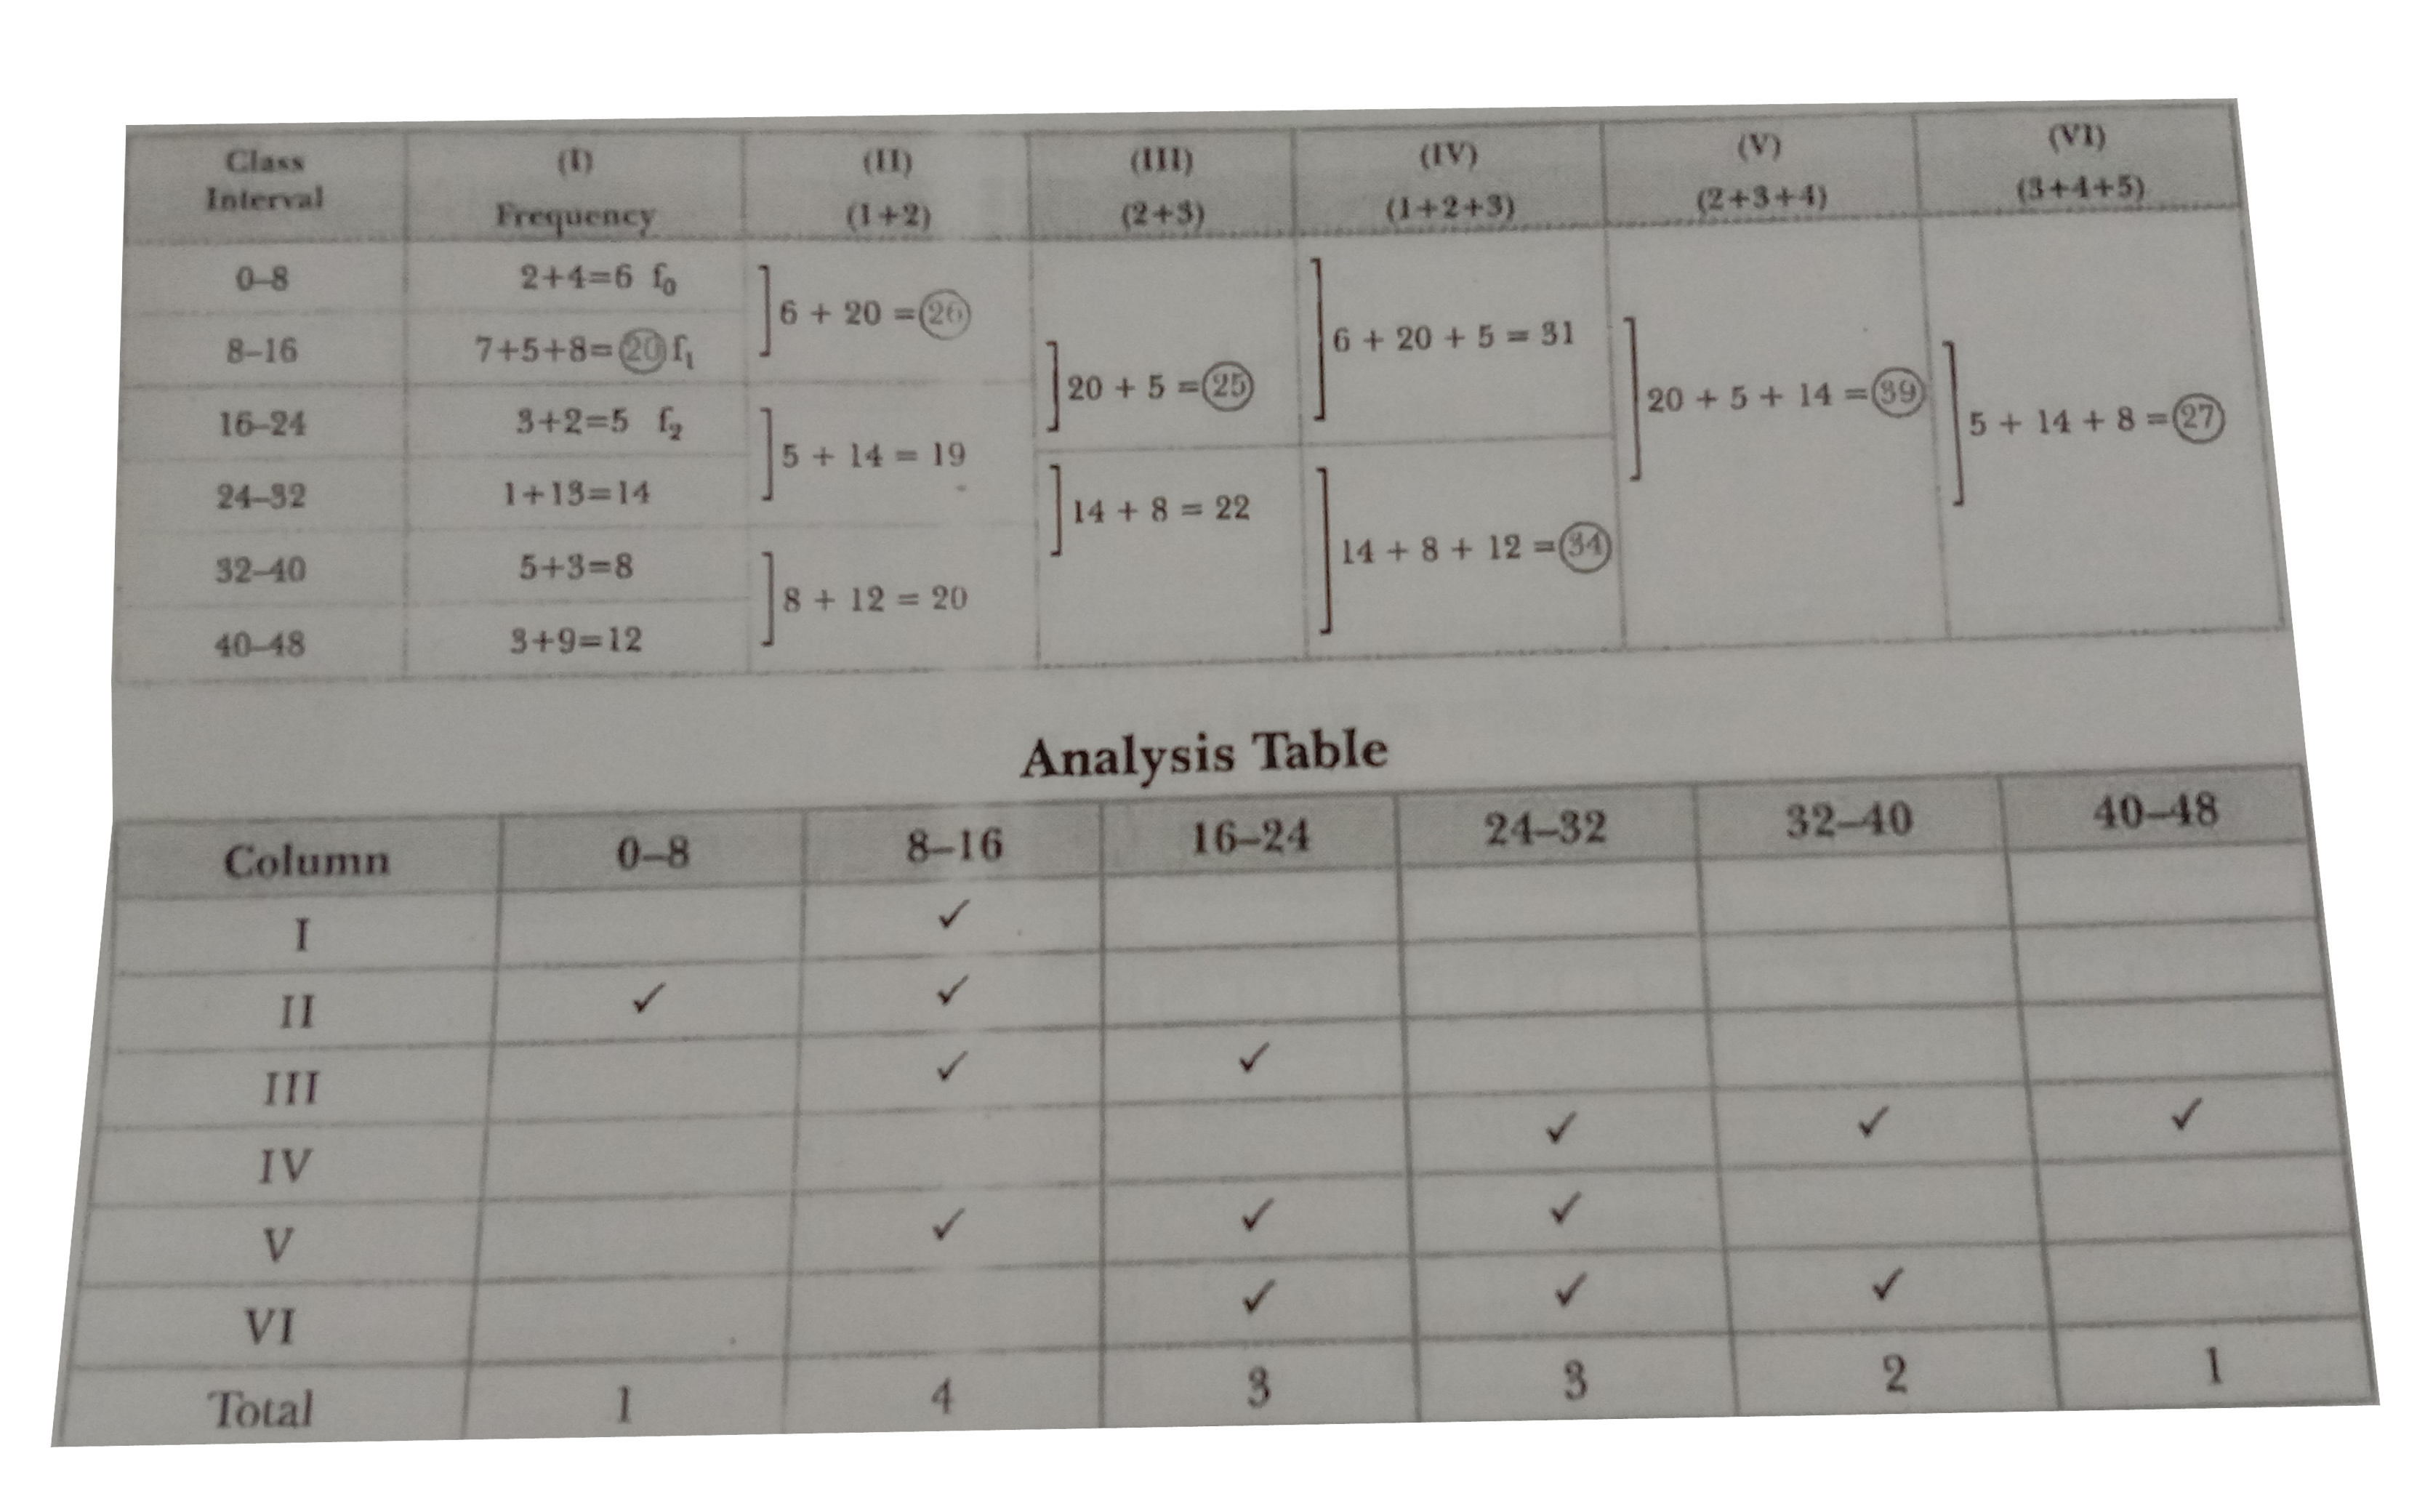
Change unequal class intervals into equal class - intervals and work out an analysis table , as under :

Mode is in 8-16 class interval.
By using the formula,
=11.86
Mode (Z) = 11.86.
Topper's Solved these Questions
- MEASURES OF CENTRAL TENDENCY MEDIAN AND MODEBook:TARUN JAIN & VK OHRIChapter:MEASURES OF CENTRAL TENDENCY MEDIAN AND MODEExercise:Miscellaneous Illustrations
Explore 30 Videos
- MEASURES OF CENTRAL TENDENCY MEDIAN AND MODEBook:TARUN JAIN & VK OHRIChapter:MEASURES OF CENTRAL TENDENCY MEDIAN AND MODEExercise:Objective Type Questios
Explore 26 Videos
- MEASURES OF CENTRAL TENDENCY - ARITHMETIC MEANBook:TARUN JAIN & VK OHRIChapter:MEASURES OF CENTRAL TENDENCY - ARITHMETIC MEANExercise:Illustration
Explore 72 Videos
- MEASURES OF DISPERSIONBook:TARUN JAIN & VK OHRIChapter:MEASURES OF DISPERSIONExercise:Learning by doing
Explore 30 Videos
Similar Questions
Calculate the mode from the following data :
Class Interval20−2425−2930−3435−3940−4445−4950−5455−59Frequency 3 5 10 20 12 6 3 1
View SolutionGiven below are the number of students in 30 class rooms in a school. Construct a frequency distribution table for this data with a class interval of 4.
25 30 24 18 20 24 32 35 22 2022 32 40 28 30 25 26 29 34 1538 28 19 16 15 20 24 30 26 18
View SolutionCalculate the arithmetic mean of the following frequency distribution by Direct Method:
Class Interval10−2020−4040−7070−120120−200Frequency 4 10 26 8 2
View SolutionCalculate the arithmetic mean of the following frequency distribution by Direct Method:
Class Interval10−2020−4040−7070−120120−200Frequency 4 10 26 8 2
View SolutionFind the quartile deviation for the following grouped data.
Class Intervalf 0−41 5−93 10−142 15−194 20−245 25−293 30−342 35−394 40−443 45−493
View SolutionEstimate the mode of the following data from the histogram.
Class Interval0−1010−2020−3030−4040−5050−6060−7070−80Frequency810151620131412
View SolutionIf A={3,6,9,12,15,18,21}, B={4,8,12,16,20},C={2,4,6,8,10,12,14,16}, D={5,10,15,20}; find
(i) A−B
(ii) A−C
(iii) A−D
View SolutionCalculate the mean deviation about mean for the following data.
Class Intervalf 10−145 15−196 20−243 25−2910 30−344 35−3915 40−448 45−4910
View SolutionThe marks obtained by 40 students of class IX in an examination are given below: 18, 8, 12, 6, 8, 16, 12, 5, 23, 2, 16, 23, 2, 10, 20, 12, 9, 7, 6, 5, 3, 5, 13, 21, 13, 15, 20, 24, 1, 7, 21, 16, 13, 18, 23, 7, 3, 18, 17, 16 Present the data in the form of a frequency distribution using the same class size, one such class being 15-20 (where 20 is not included)
View SolutionForm a grouped frequency distribution from the following data by inclusive method taking 4 as the class size of class intervals.
31, 23, 19, 29, 22, 20, 16, 10, 13, 34, 38, 33, 28, 21, 15, 18, 36, 24, 18, 15, 12, 30, 27, 23, 20, 17, 14, 32, 26, 25, 18, 29, 24, 19, 16, 11, 22, 15, 17,10
View Solution
