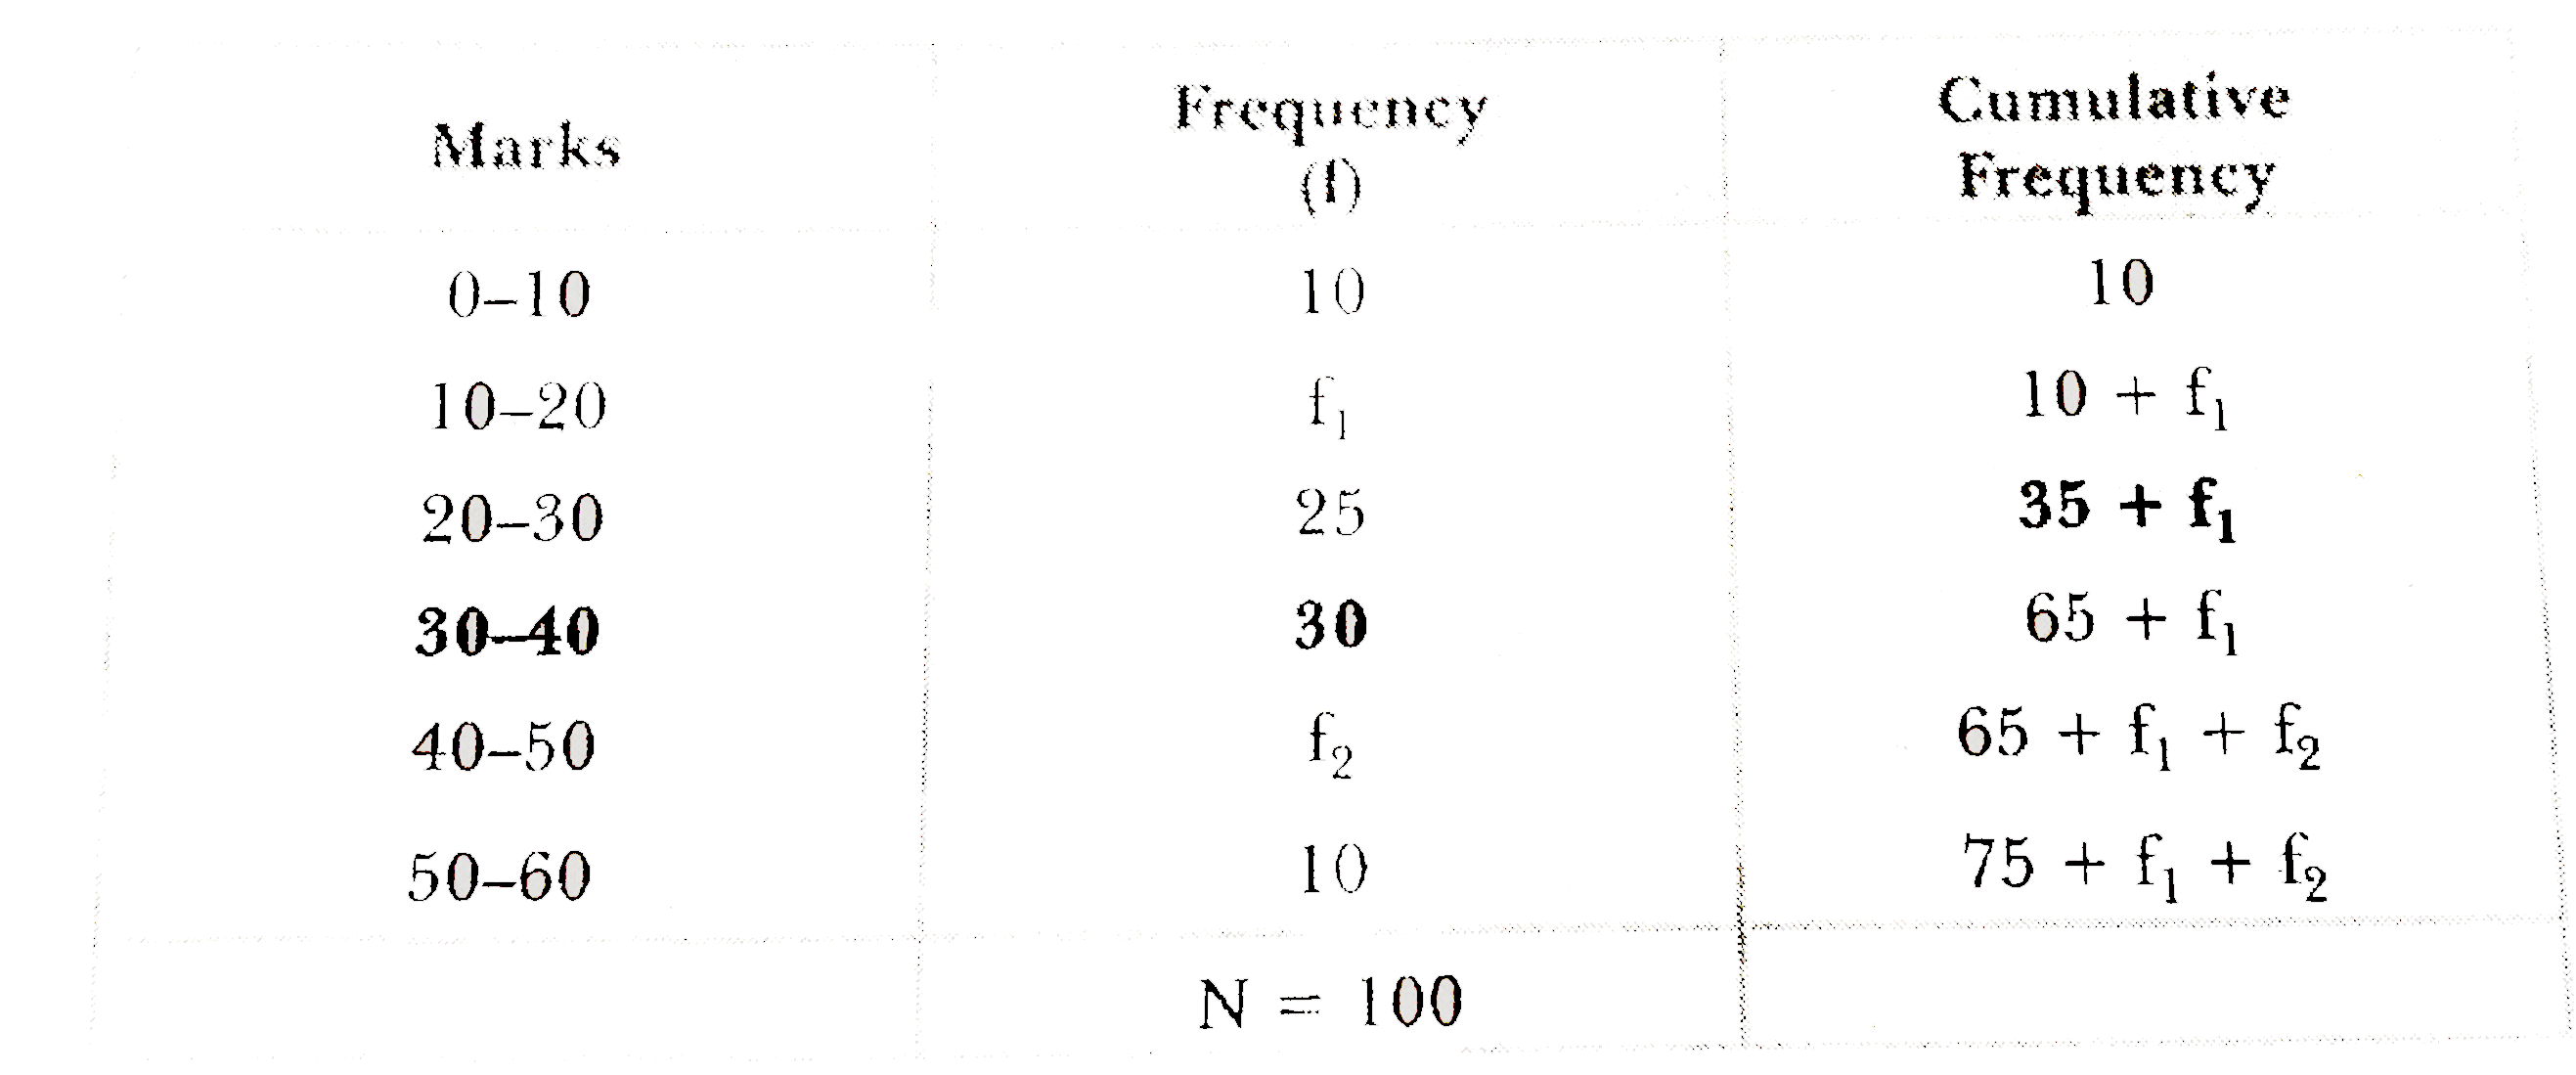
Find the missing frequency in the following distribution if N=100 and M=30.
Marks0−1010−2020−3030−4040−5050−60Number of Students 10 ? 25 30 ? 10
Two frequencies are missing and let the missing frequencies be denoted by f1andf2 . We need two equations , we will get one from summation of frequencies and one from median formula.

1 st Equation : From summation of frequencies,
75+f1+f2=100⇒f1+f2=25 ...(i)
2nd Equation : From onformation regarding median ,
M=30, Median class is 30-40 . Now
M=l1+N2−c.f.f×i
30=30+50−(35+f1)30×10
0=15−f13orf1=15 ...(ii)
Substituting f1= 15 from equation (ii),in equation (i)
As f1+f2=25
Put f1=15
∴15+f2=25
∴f2=25−15=10
Thus , f1=15,f2=10.
Topper's Solved these Questions
- MEASURES OF CENTRAL TENDENCY MEDIAN AND MODEBook:TARUN JAIN & VK OHRIChapter:MEASURES OF CENTRAL TENDENCY MEDIAN AND MODEExercise:Miscellaneous Illustrations
Explore 30 Videos
- MEASURES OF CENTRAL TENDENCY MEDIAN AND MODEBook:TARUN JAIN & VK OHRIChapter:MEASURES OF CENTRAL TENDENCY MEDIAN AND MODEExercise:Objective Type Questios
Explore 26 Videos
- MEASURES OF CENTRAL TENDENCY - ARITHMETIC MEANBook:TARUN JAIN & VK OHRIChapter:MEASURES OF CENTRAL TENDENCY - ARITHMETIC MEANExercise:Illustration
Explore 72 Videos
- MEASURES OF DISPERSIONBook:TARUN JAIN & VK OHRIChapter:MEASURES OF DISPERSIONExercise:Learning by doing
Explore 30 Videos
Similar Questions
Find the value of frequecies in the following frequency distribution table, if n=100 and median is 32 [Marks0−1010−2020−3030−4040−5050−60TotalNumberofstudent10x2530y10100]
View SolutionFind out median marks from the following data :
Marks0−1010−2020−3030−4040−50Number of Students 8 30 40 12 10
View SolutionLocate the median graphically from the following data :
Marks0−1010−2020−3030−4040−50Number of Students 10 20 30 20 10
View SolutionCaculate the median and mode from the following data :
Marks0−1010−2020−3030−4040−5050−6060−7070−80Number of Students 2 18 30 45 35 20 6 3
View SolutionObtain the mean , median and mode of the following data :
Marks0−1010−2020−3030−4040−5050−6060−7070−80Number of Students 5 7 15 25 20 15 8 5
View SolutionCalculate median of the following of data :
Class Interval0−55−1010−2020−3030−5050−7070−100Number of Students 12 15 25 40 42 14 8
View SolutionCaculate mode of the following data :
Marks0−55−1010−2020−4040−6060−8080−9090−100Number of Students 5 7 9 25 30 24 8 6
View SolutionGiven the following data , find out median :
Age20−2525−3030−3535−4040−4545−5050−5555−60Number of Students 50 70 100 180 150 120 70 60
View SolutionFind out median value of the following distribution:
Wege Rate (Rs.)0−1010−2020−3030−4040−50Number of Workers 22 38 46 35 20
View SolutionDetermine median value of the following series using graphic method :
Marks0−55−1010−1515−2020−2525−3030−3535−40Number of students 4 6 10 10 22 25 18 5
View Solution