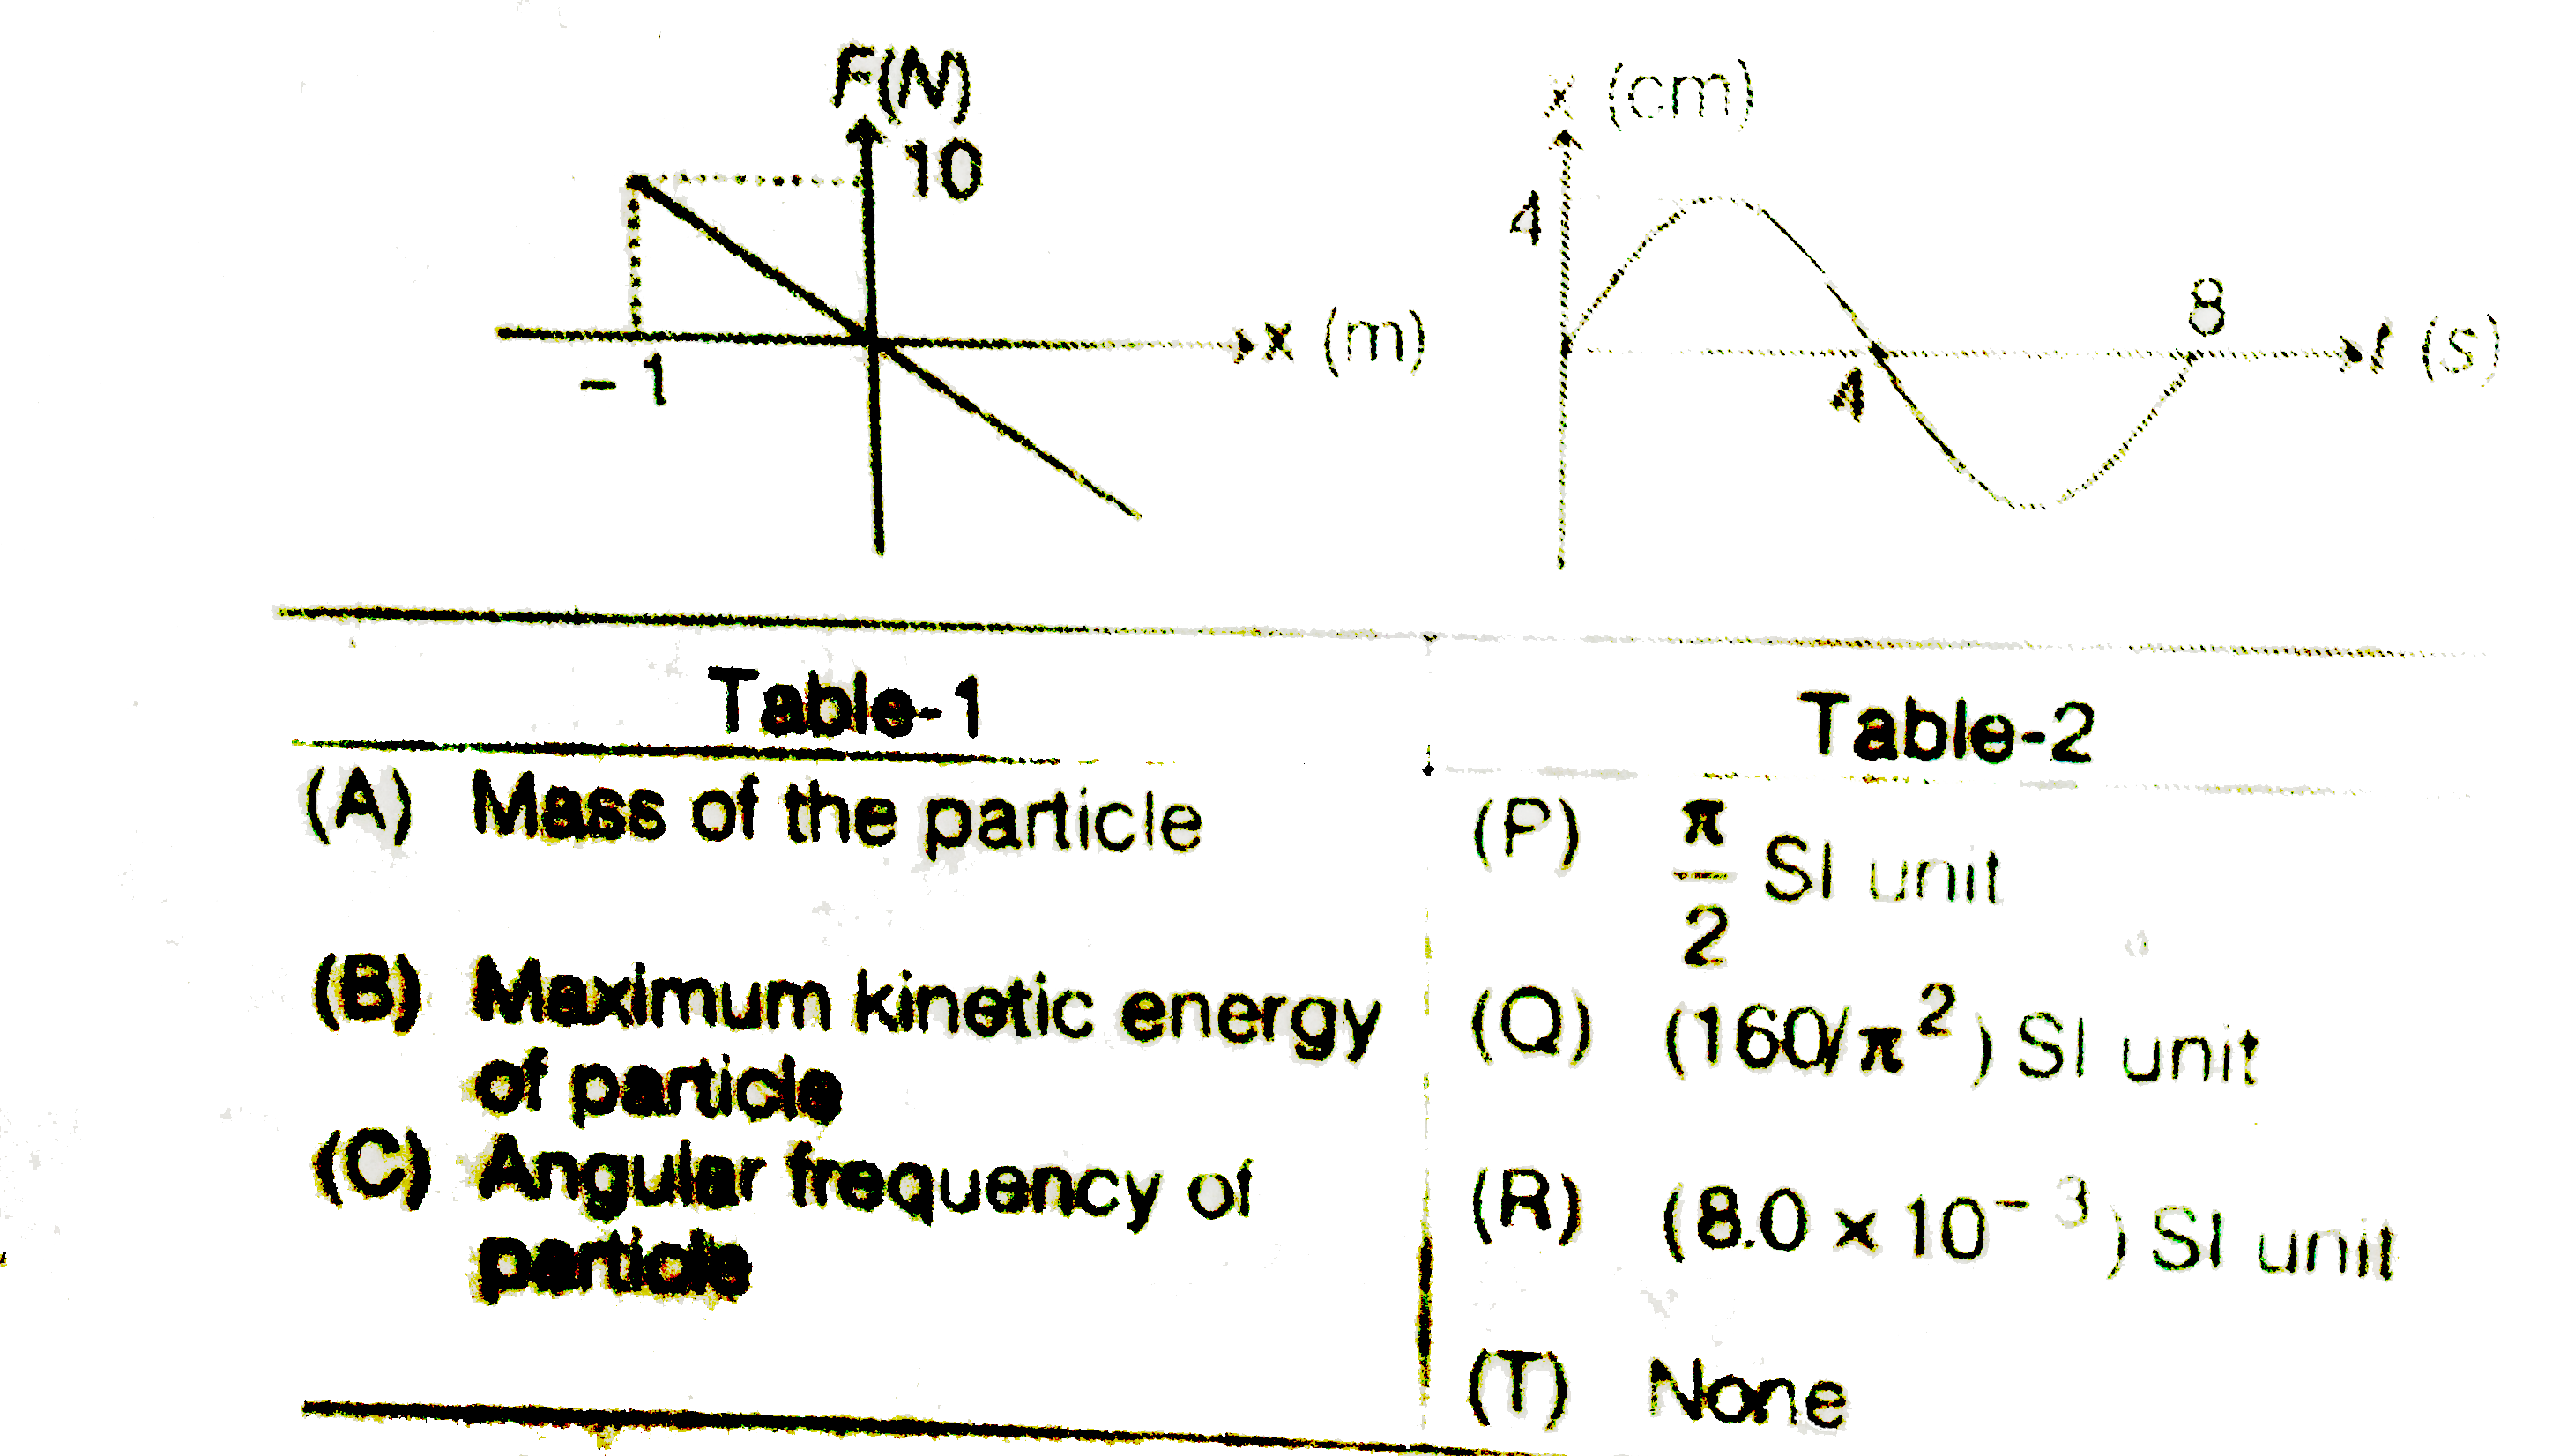
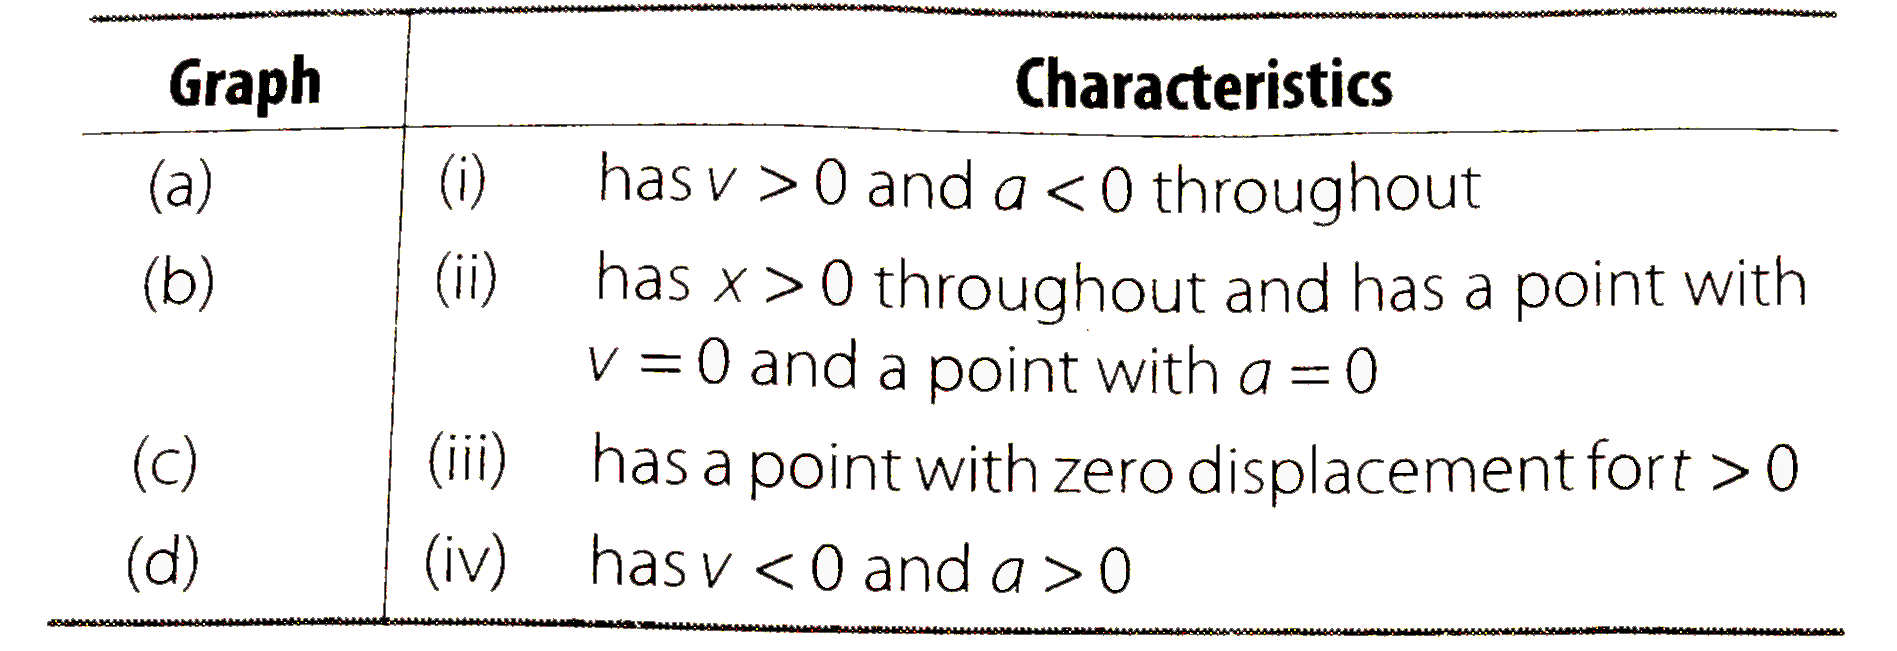
F-x and x-t graph of a principle in SHM are as shown in figure. Match the following.
Video Solution
Text Solution
The correct Answer is:(A→q,B→r,C→s)
T=8 s
∴ω=2πT=π4rads−1
K=-slope of F-x graph =10Nm−1
From, T=2π√mk
We have, 8=2π√m10
∴m=160π2kg
Kmax=12mω2A2=12×(160).(π2)×π216×(4×10−2)2
=80×10−3J
|
Similar Questions
Knowledge Check
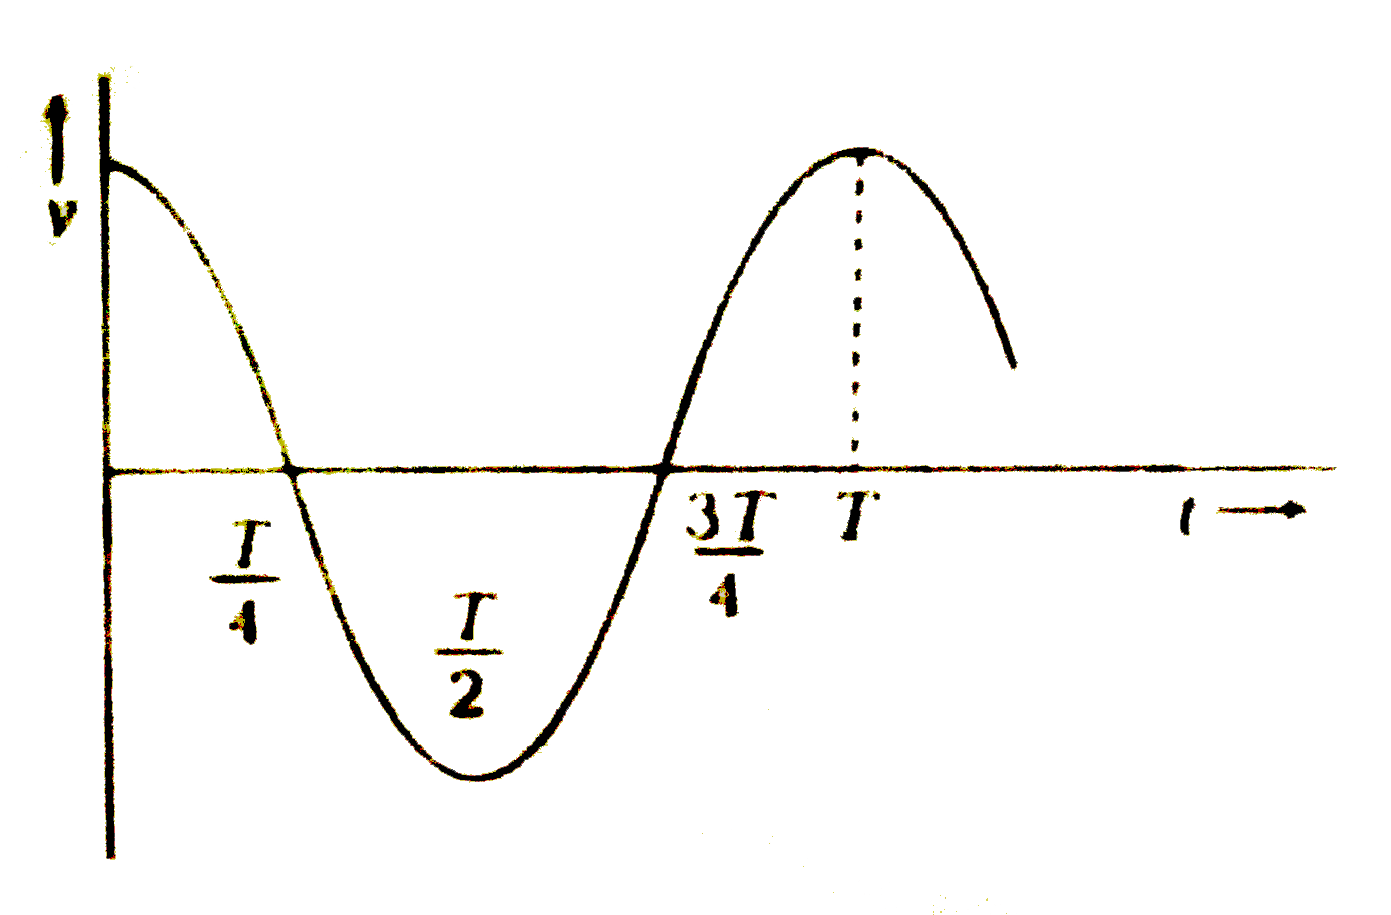
v−t graph of a particle in SHM is as shown is figure. Choose the wrong option.
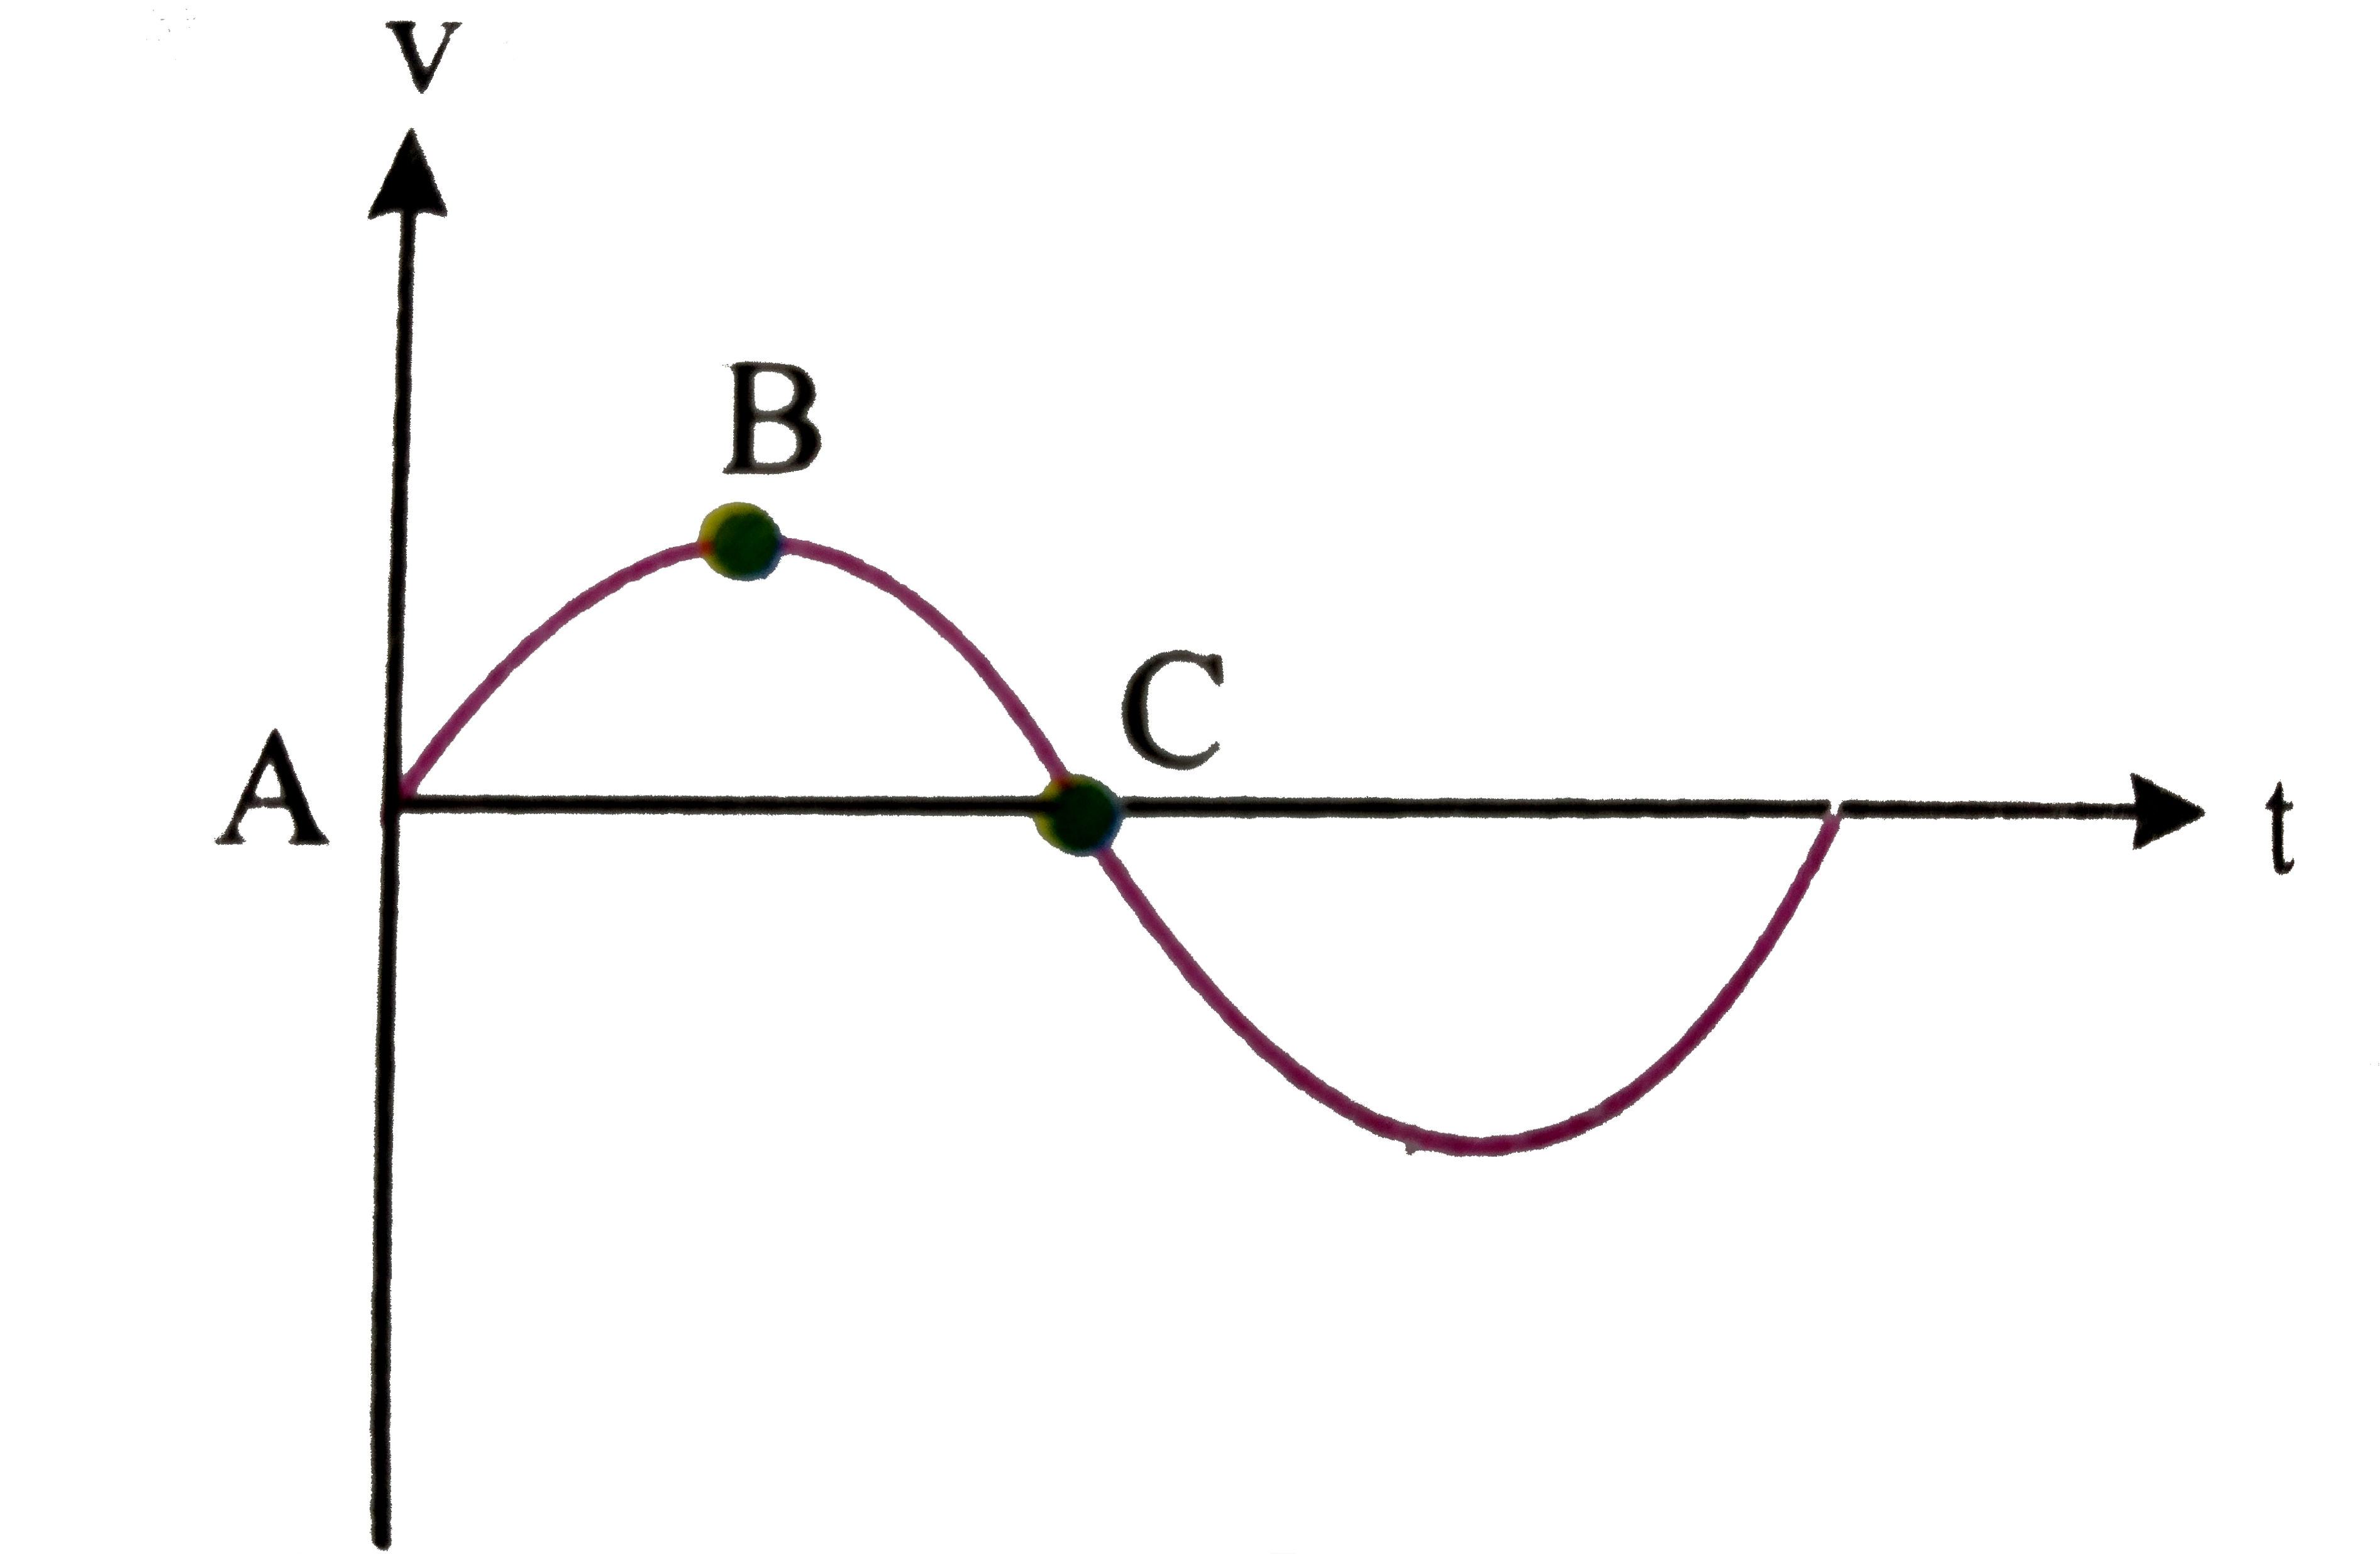 Aat A particle is at mean position and moving towards position directionBat Bacceleration of particle is zeroCat C acceleration of particle is maximum and in position directionDnone of the above
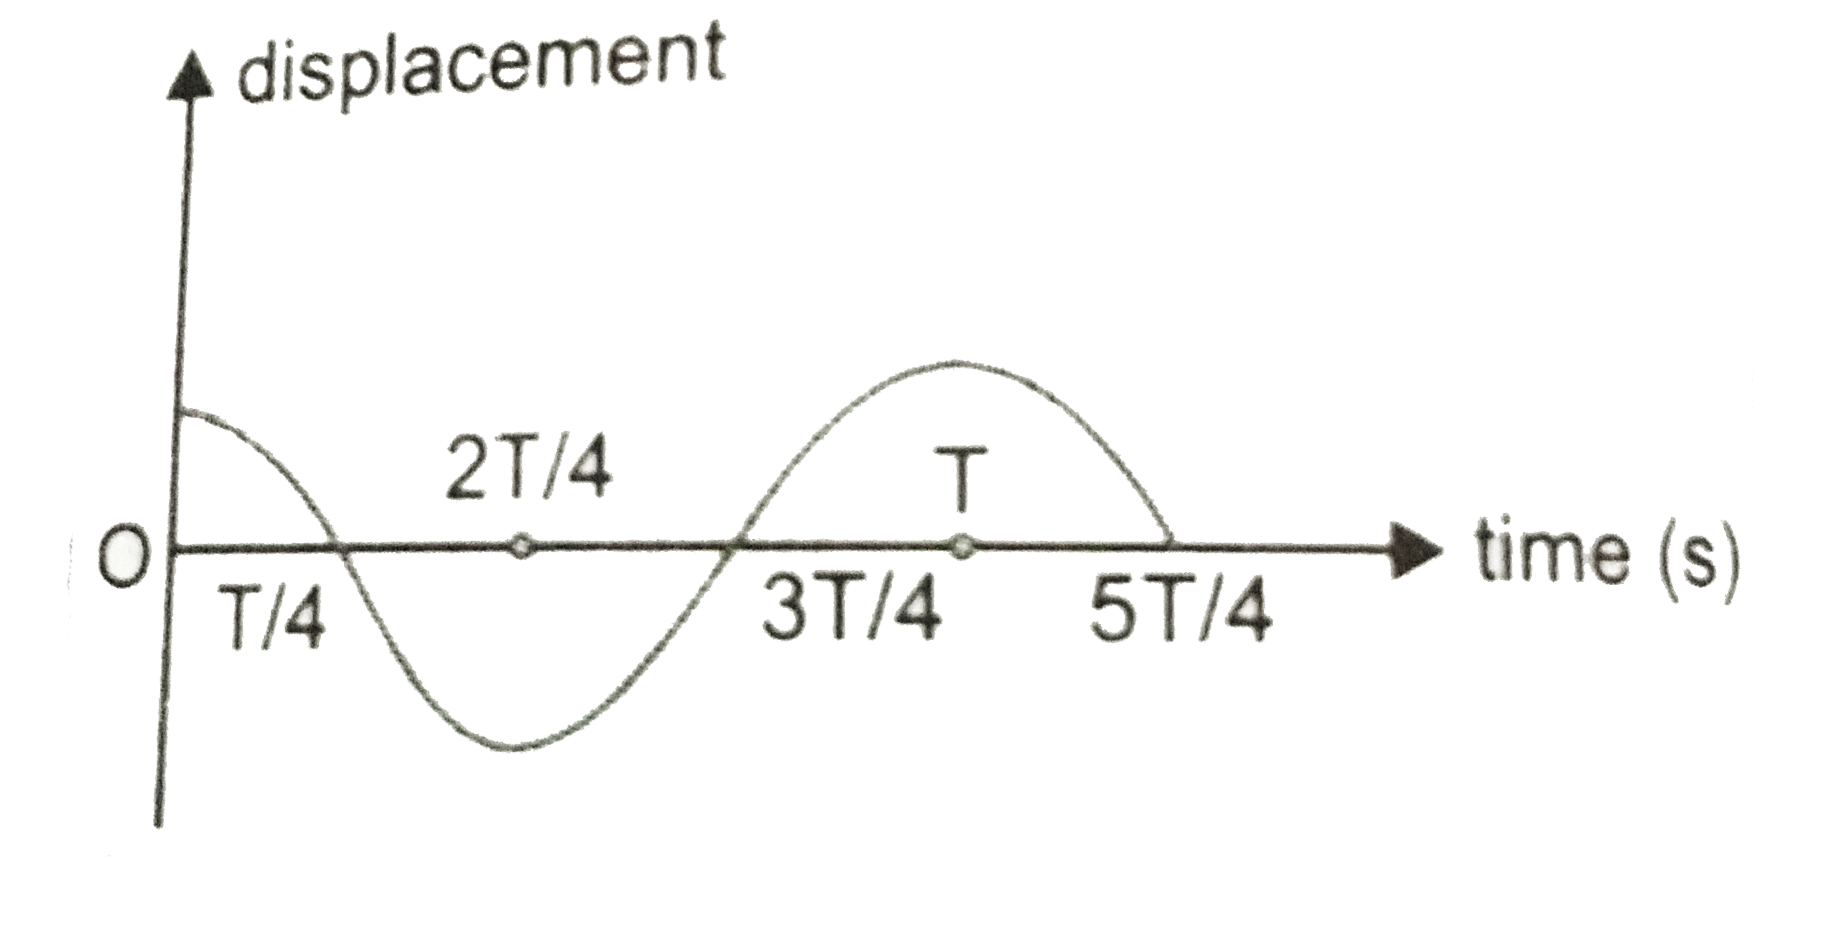
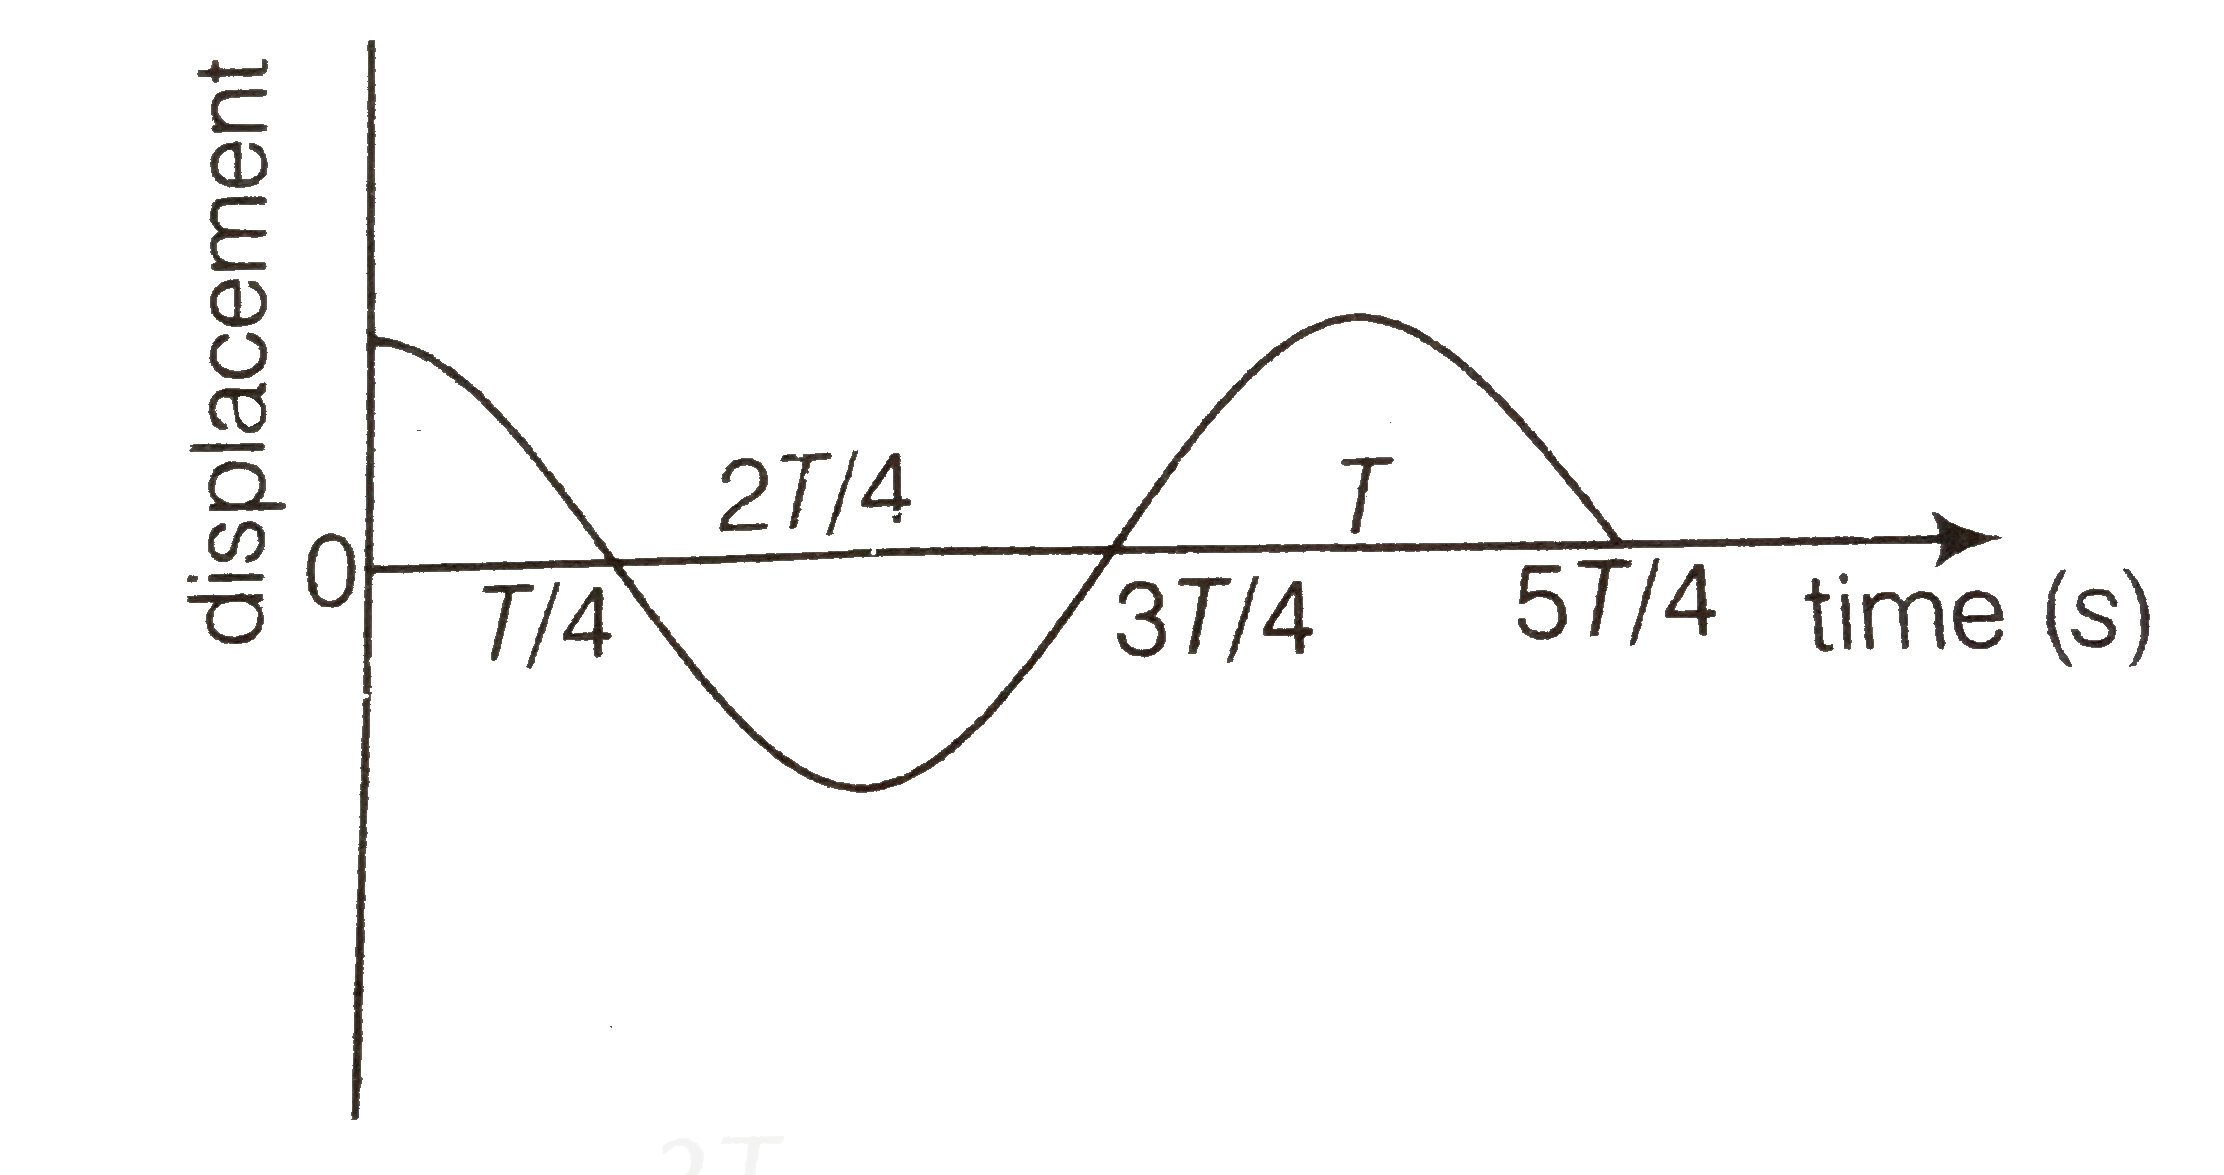
The displacement - time graph of a particle executing SHM is shown in figure. Which of the following statements is//are true ?
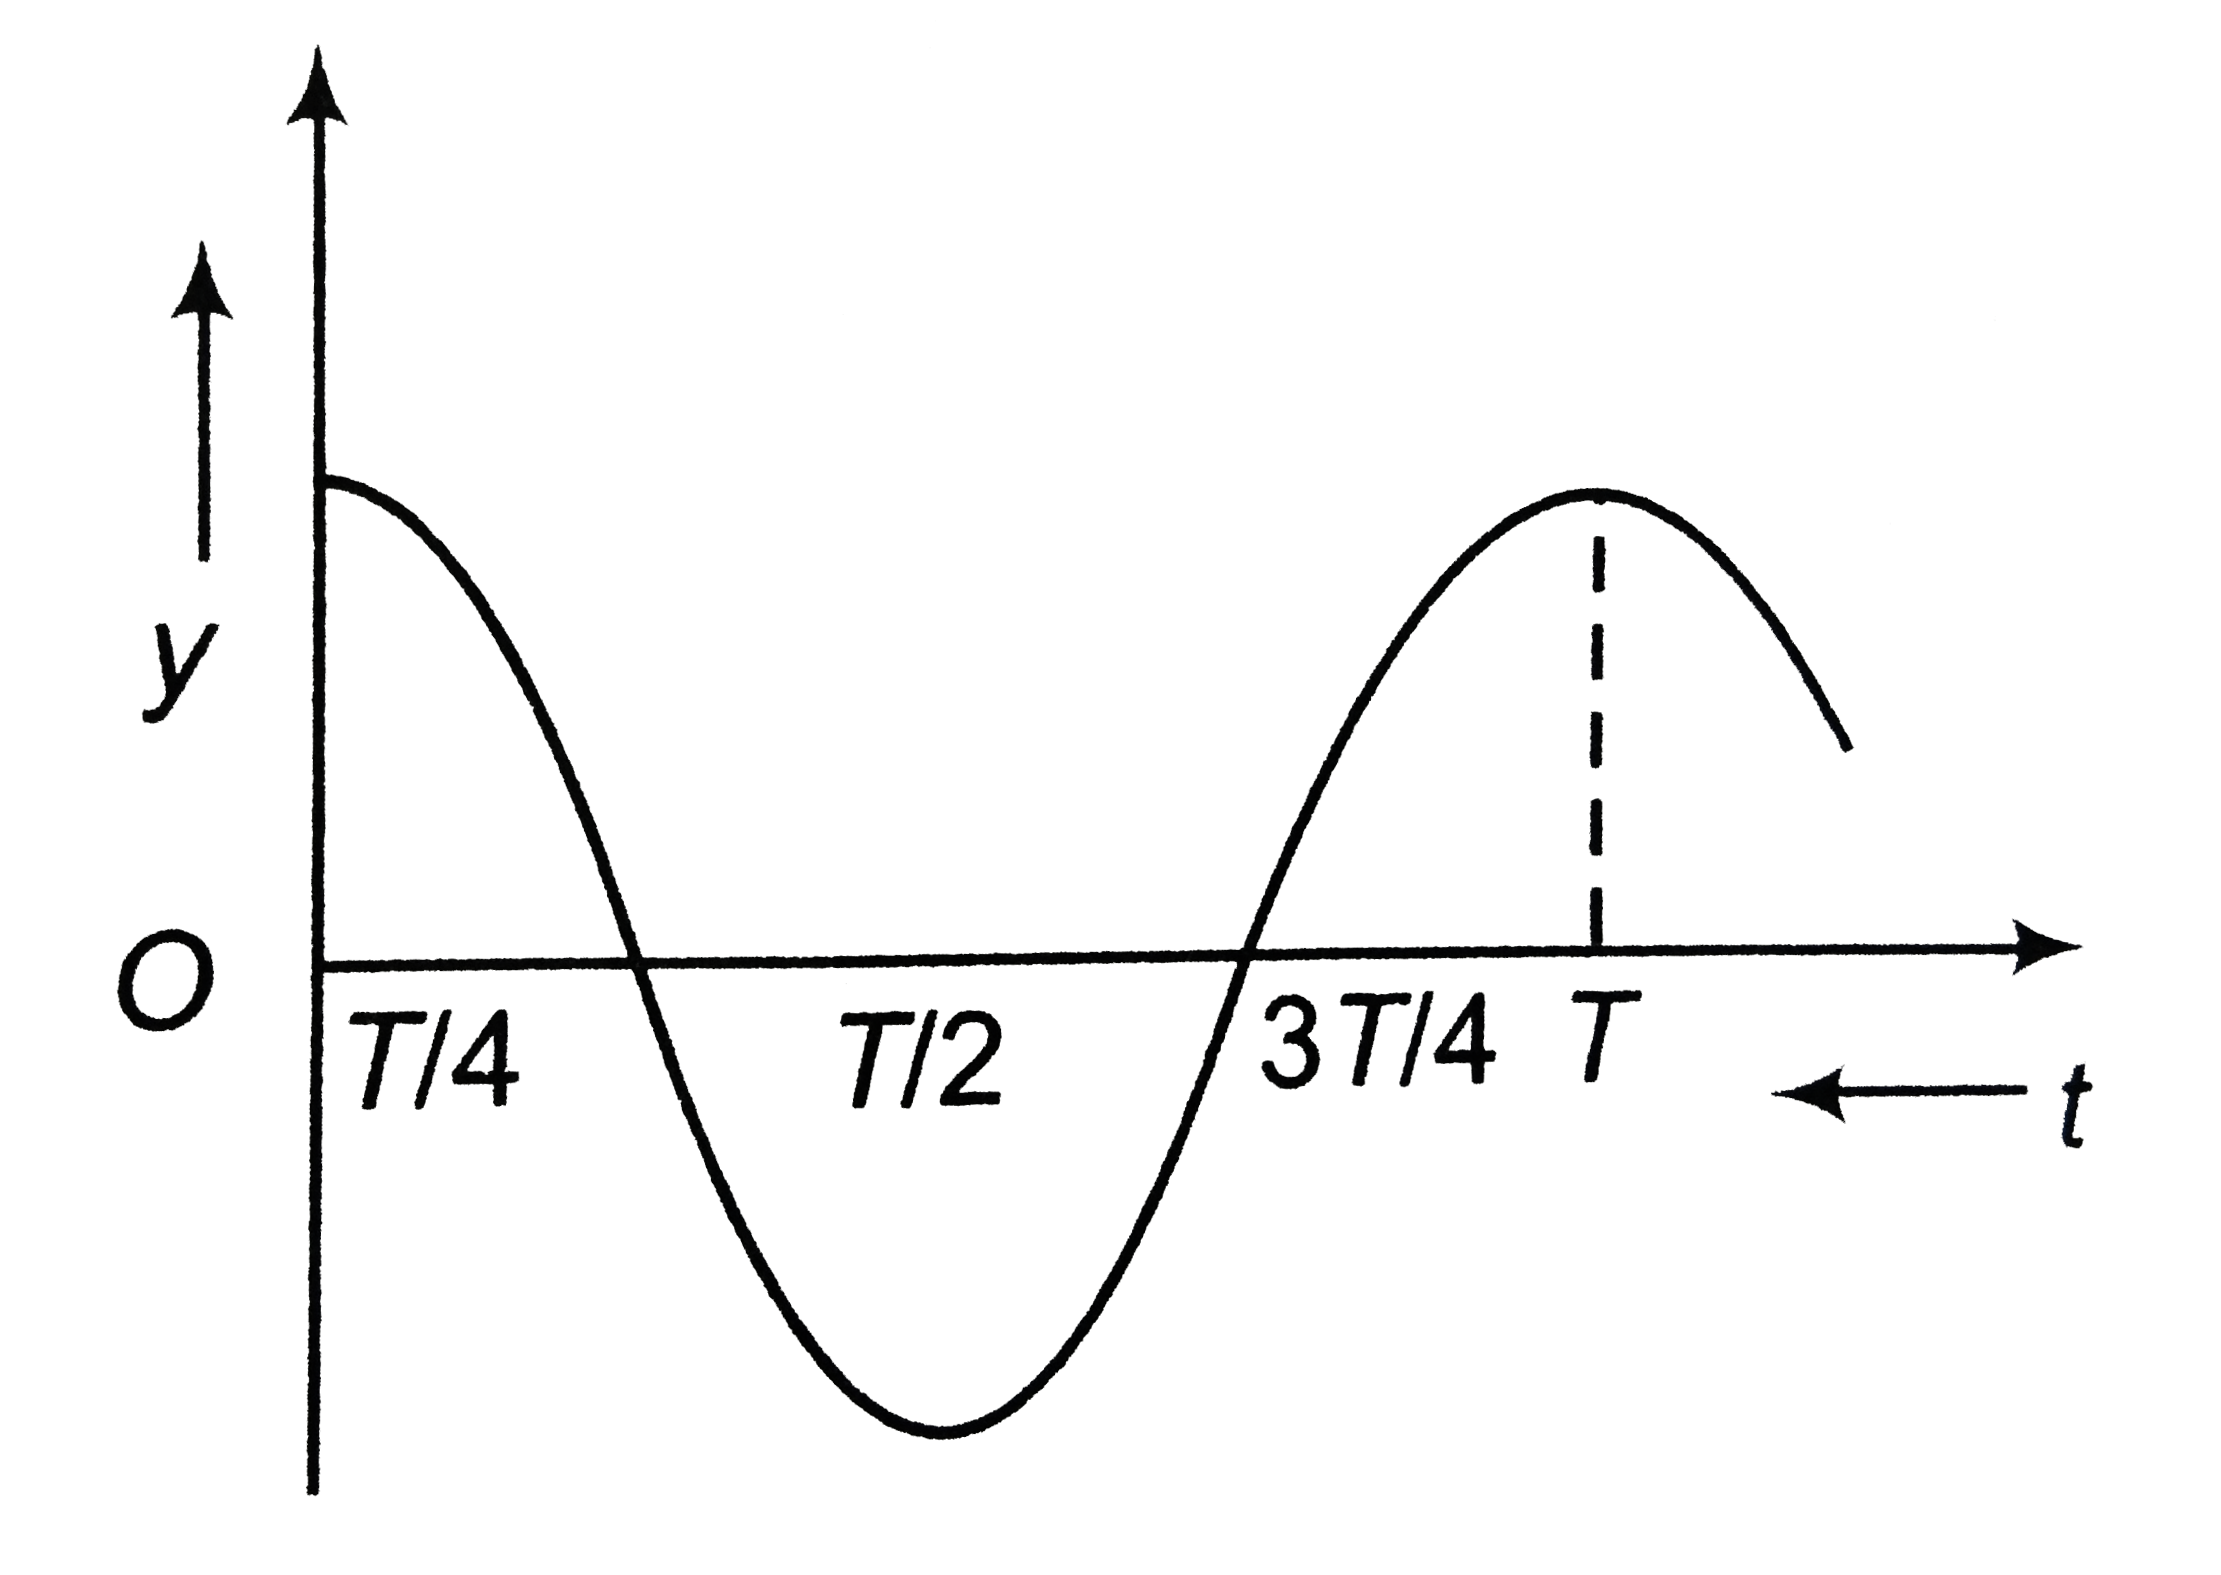 AThe velocity is maximum at t=T/2BThe acceleration is maximum at t=TCThe force is zero at t=3T/4DThe kinetic energy equals the total oscillation energy at t=T/2
The displacement -time graph of a particle executing SHM is shown in figure. Which of the following statements is/are true ?
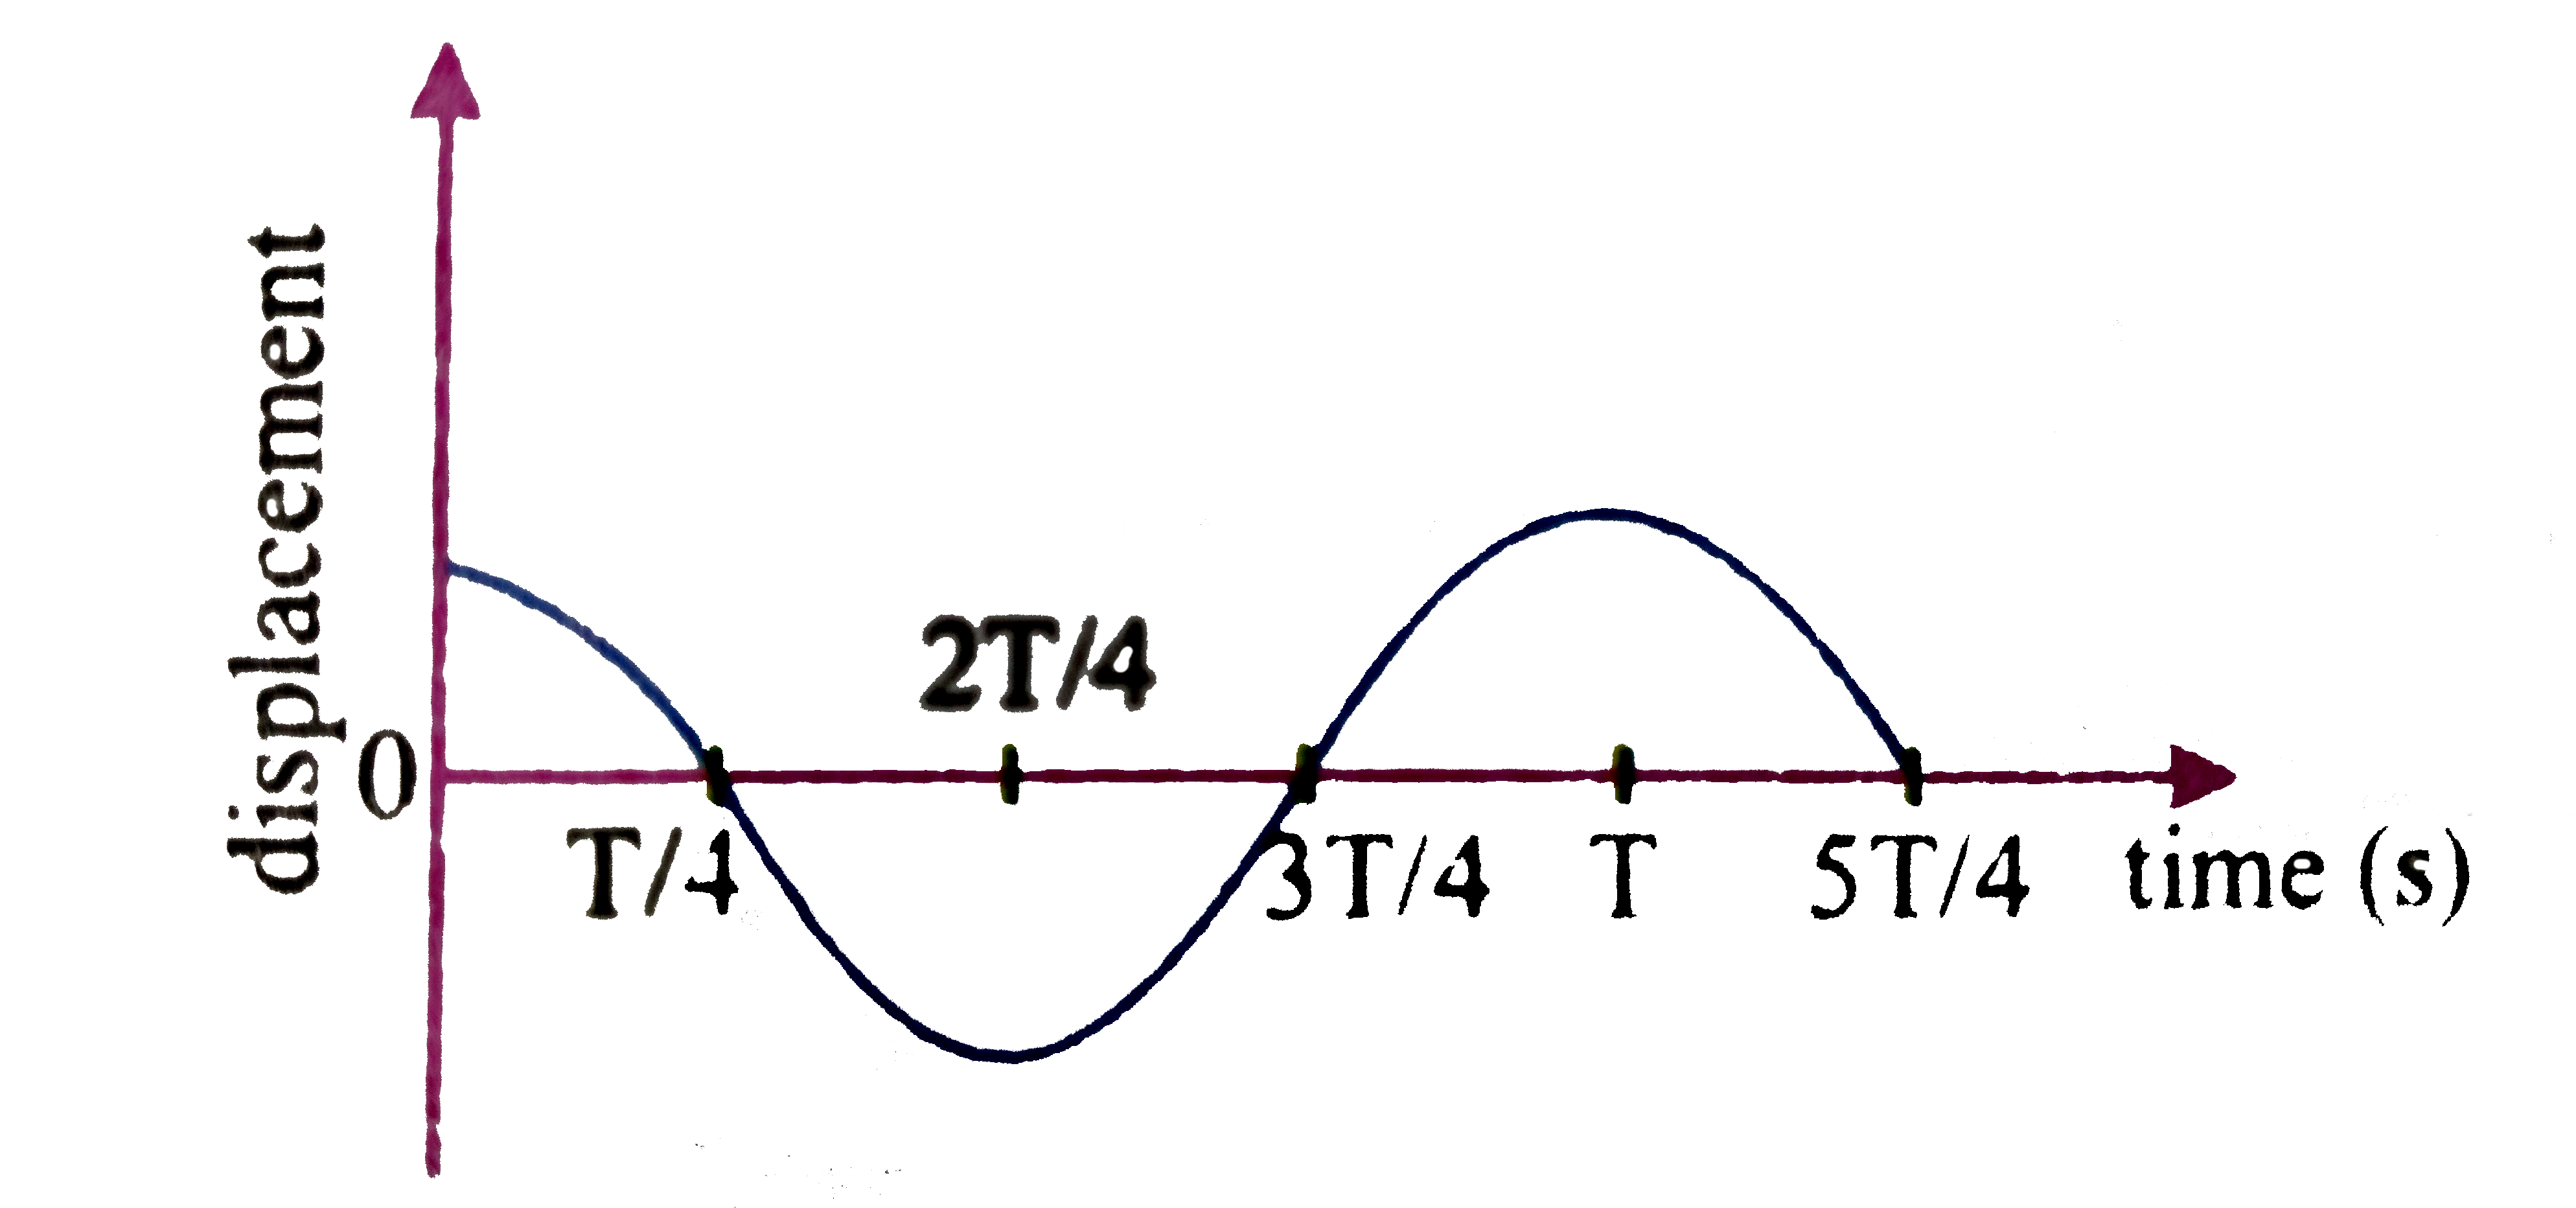 AThe force is zero at t=3T4BThe acceleration is maximum at t=4T4CThe velocity is maximum at t=T4DThe PE is equal to KE osc oscillation at t=T2
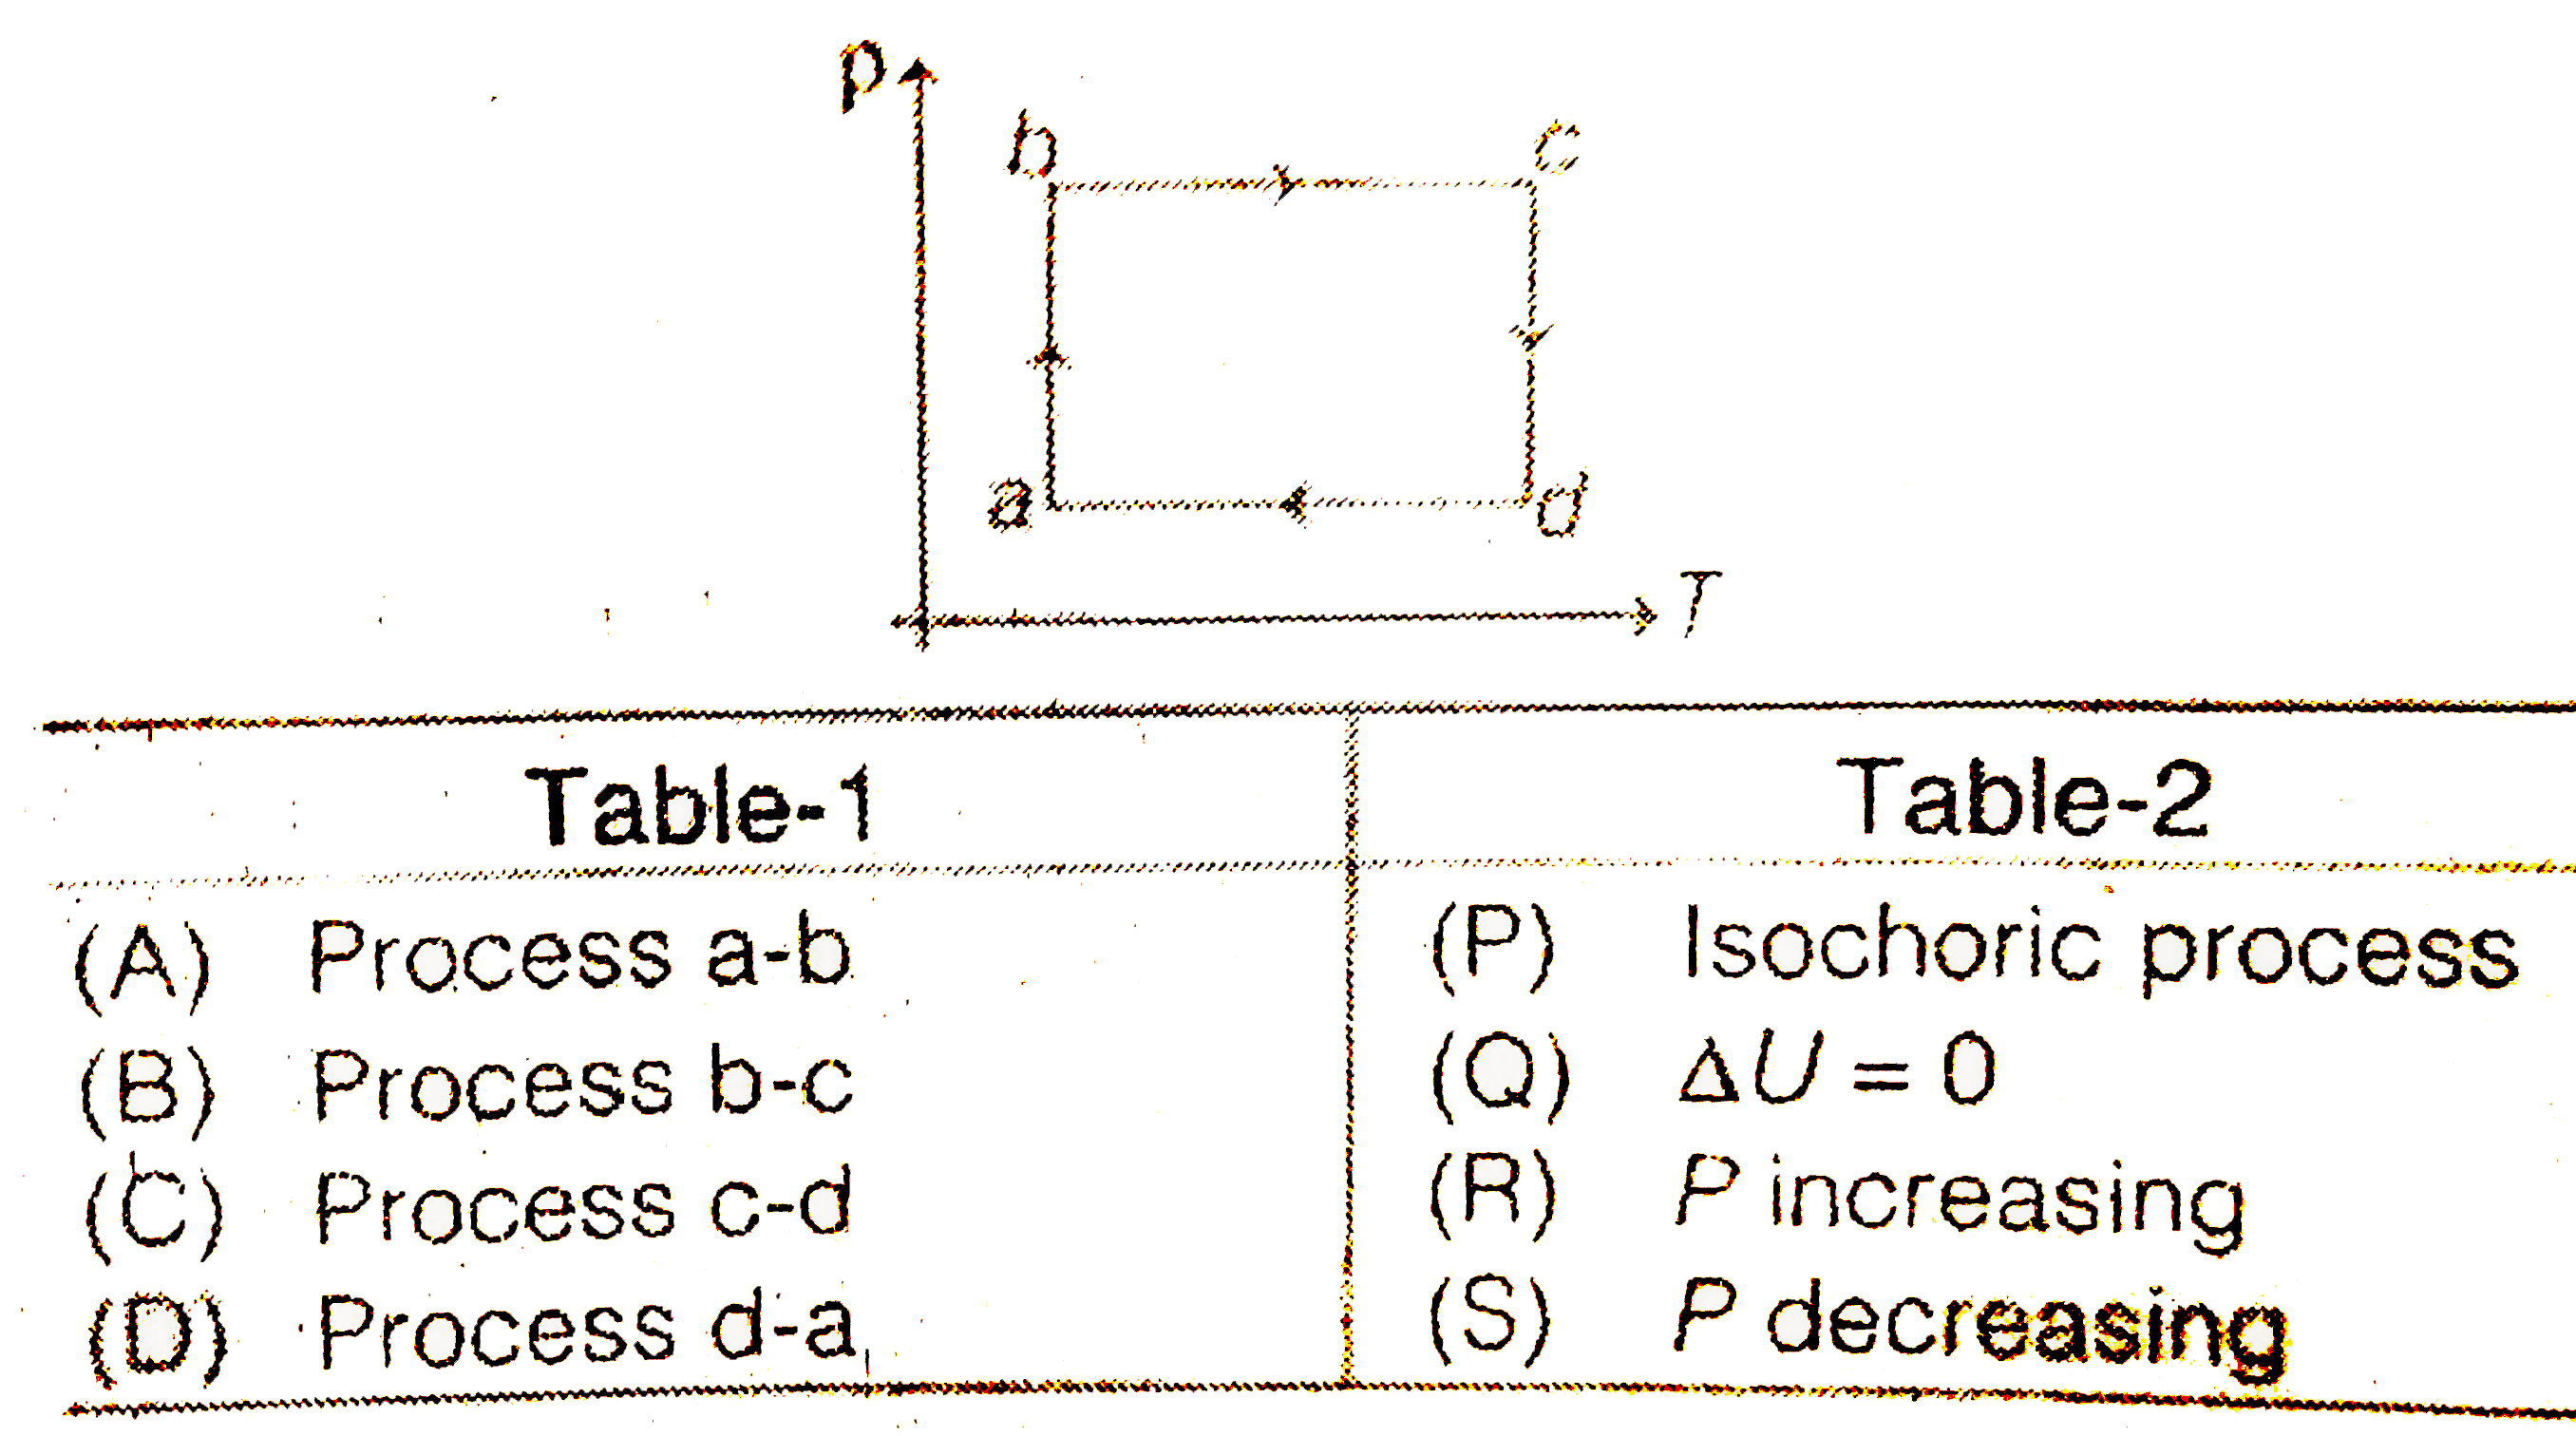
In the ρ-T graph shown in figure, match the following.
View SolutionThe displecement-time graph of a particle execting SHM is shown in figure. Which of the following statements is false?
View SolutionRefer to the graph in figure. Match the following
View SolutionThe displacement time graph of a particle executing S.H.M. is shown in figure. Which of the following statement is / are true ?
View SolutionThe displacement-time graph of a particle executing SHM is shown in figure. Which of the following statement is/are true ?
View Solution

