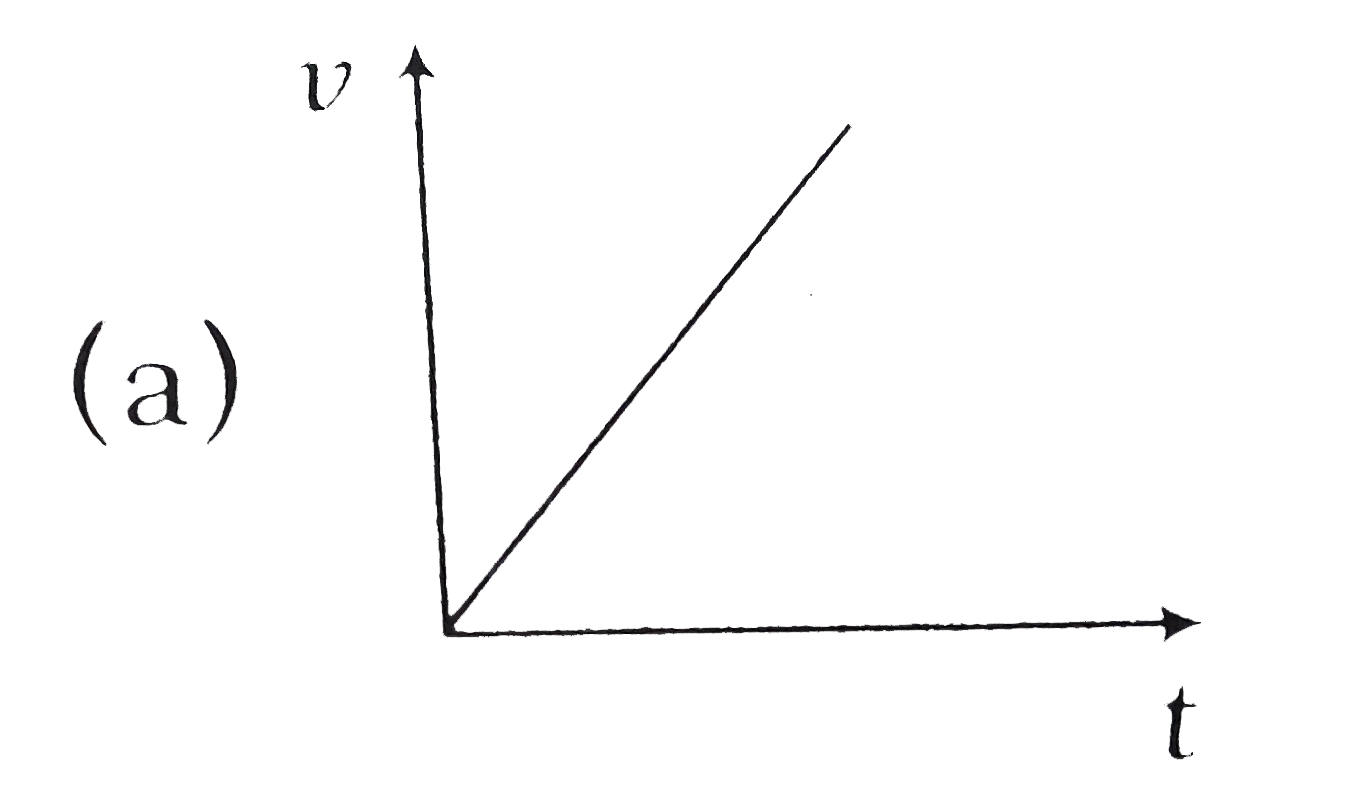
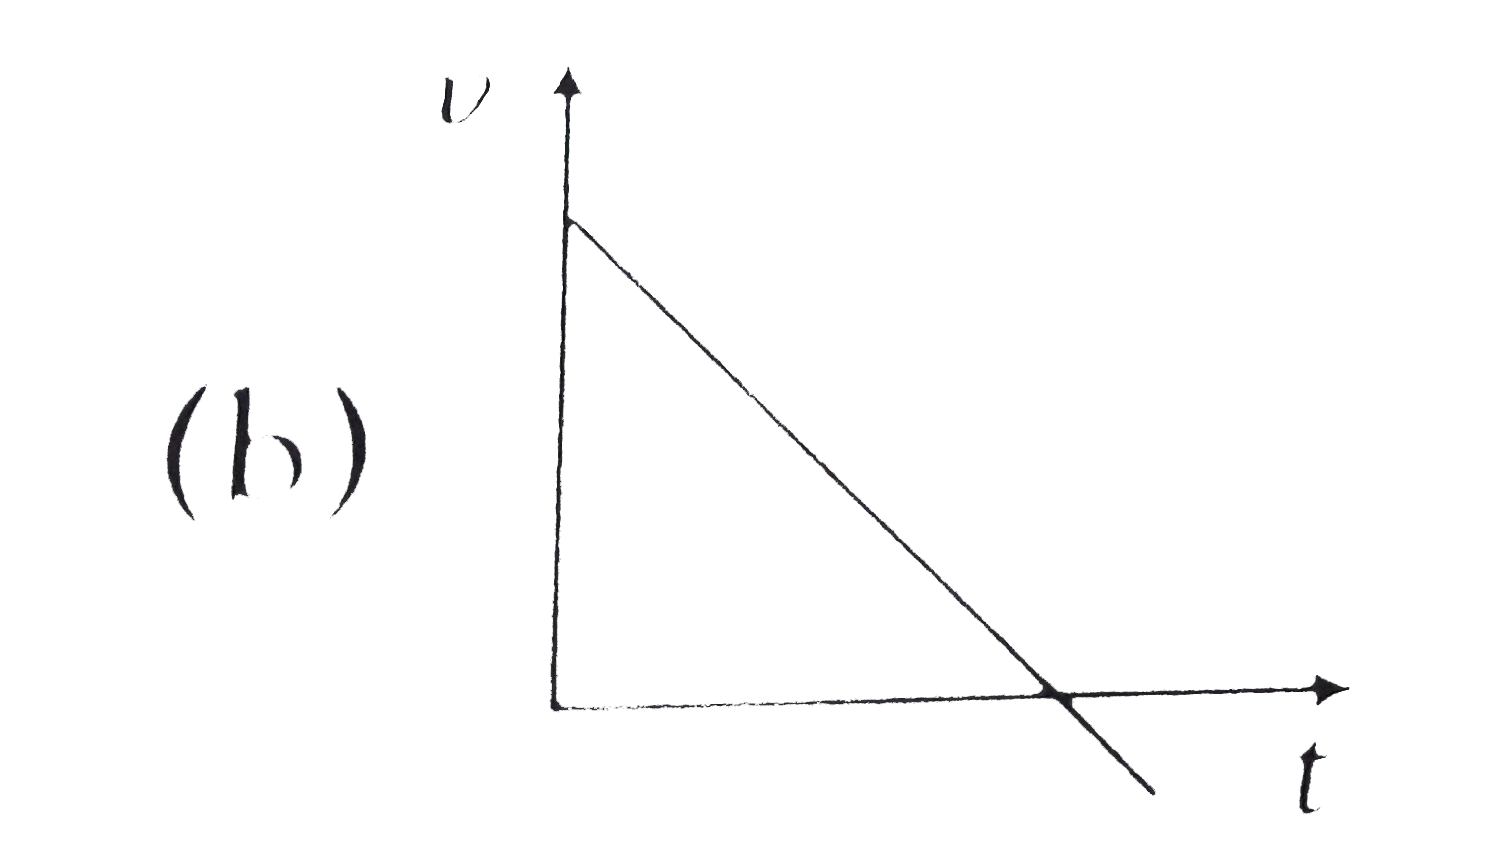
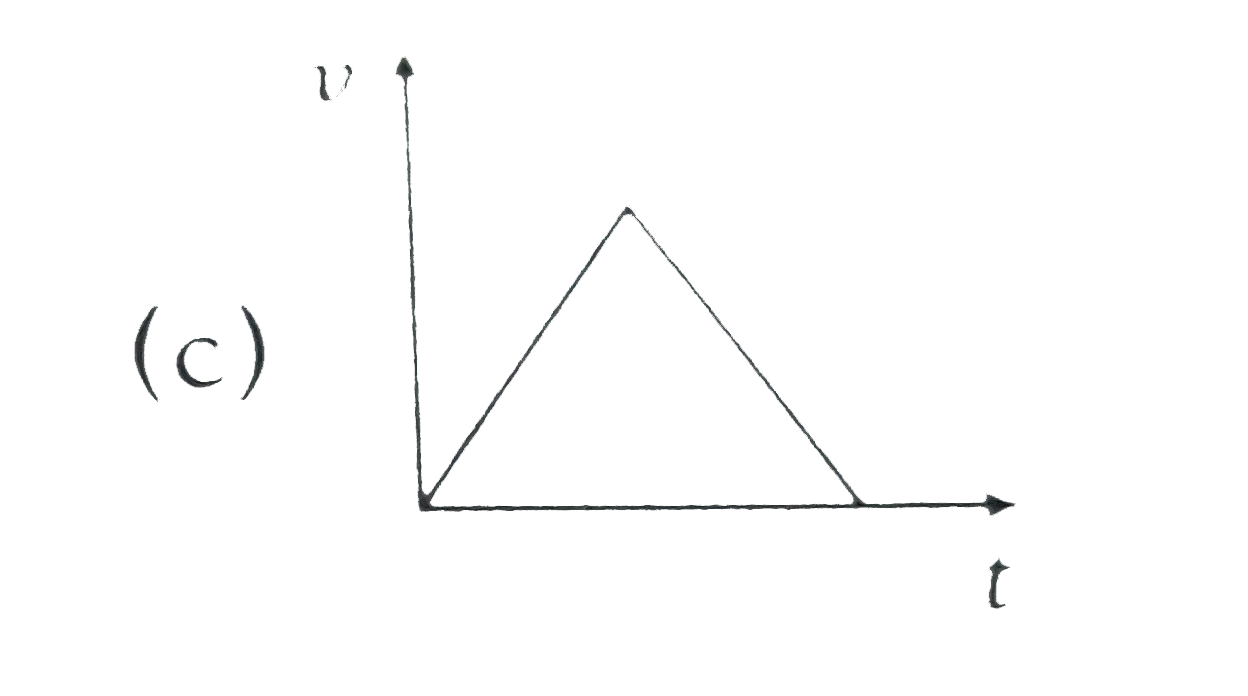
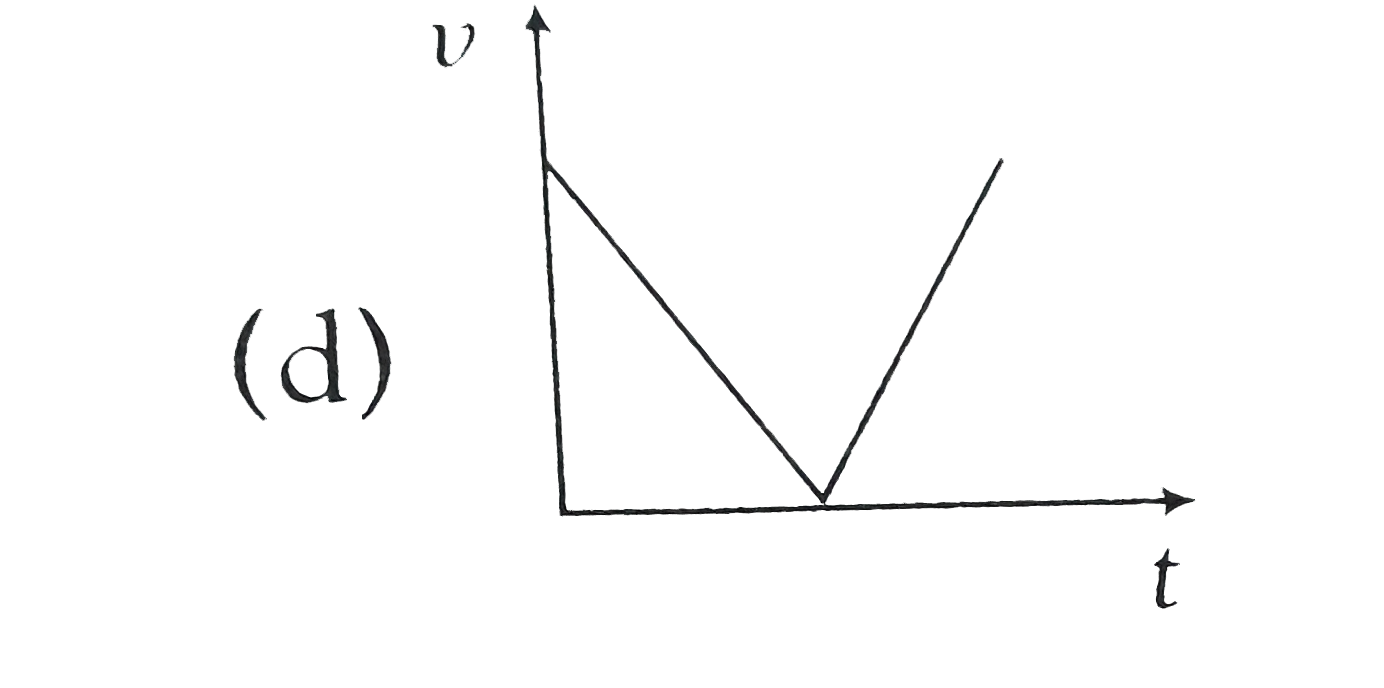
Which of the following graph correctly represents velocity-time relationship for a particle released from rest to fall freely under gravity ?
A
B
C
D
Video Solution
Text Solution
The correct Answer is:A
Velocity will continuously increase (starting from rest).
|
Topper's Solved these Questions
- MOTION IN A PLANEBOOK - DC PANDEYCHAPTER - MOTION IN A PLANEEXERCISE - Check point 3.7
15 Videos
- MOTION IN A PLANEBOOK - DC PANDEYCHAPTER - MOTION IN A PLANEEXERCISE - (A) Taking it together
75 Videos
- MOTION IN A PLANEBOOK - DC PANDEYCHAPTER - MOTION IN A PLANEEXERCISE - Check point 3.5
25 Videos
- MOTIONBOOK - DC PANDEYCHAPTER - MOTIONEXERCISE - Medical entrances gallery
19 Videos
- PROJECTILE MOTIONBOOK - DC PANDEYCHAPTER - PROJECTILE MOTIONEXERCISE - Level - 2 Subjective
10 Videos
Similar Questions
Knowledge Check
Which of the following graph is correctly represented?
A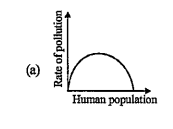 B
B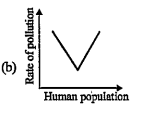 C
C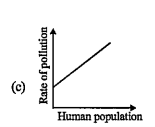 D
D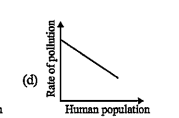
Which of the following graphs represents the velocity-time relationship for a falling apple?
A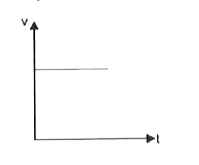 B
B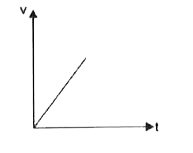 C
C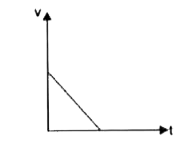 D
D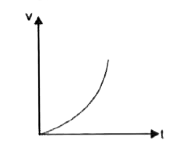
Which of the following equation correctly represent species-area relationship?
Alog C = log S + Z log ABlog A = log C + Z log SClog A = log S + Z log CDlog S = log C + Z log A
Which of the following diagrams correctly represents the relationship between automobile cars and motorcycles?
View Solutionwhich of the following graphs represents Charles' law correctly ?
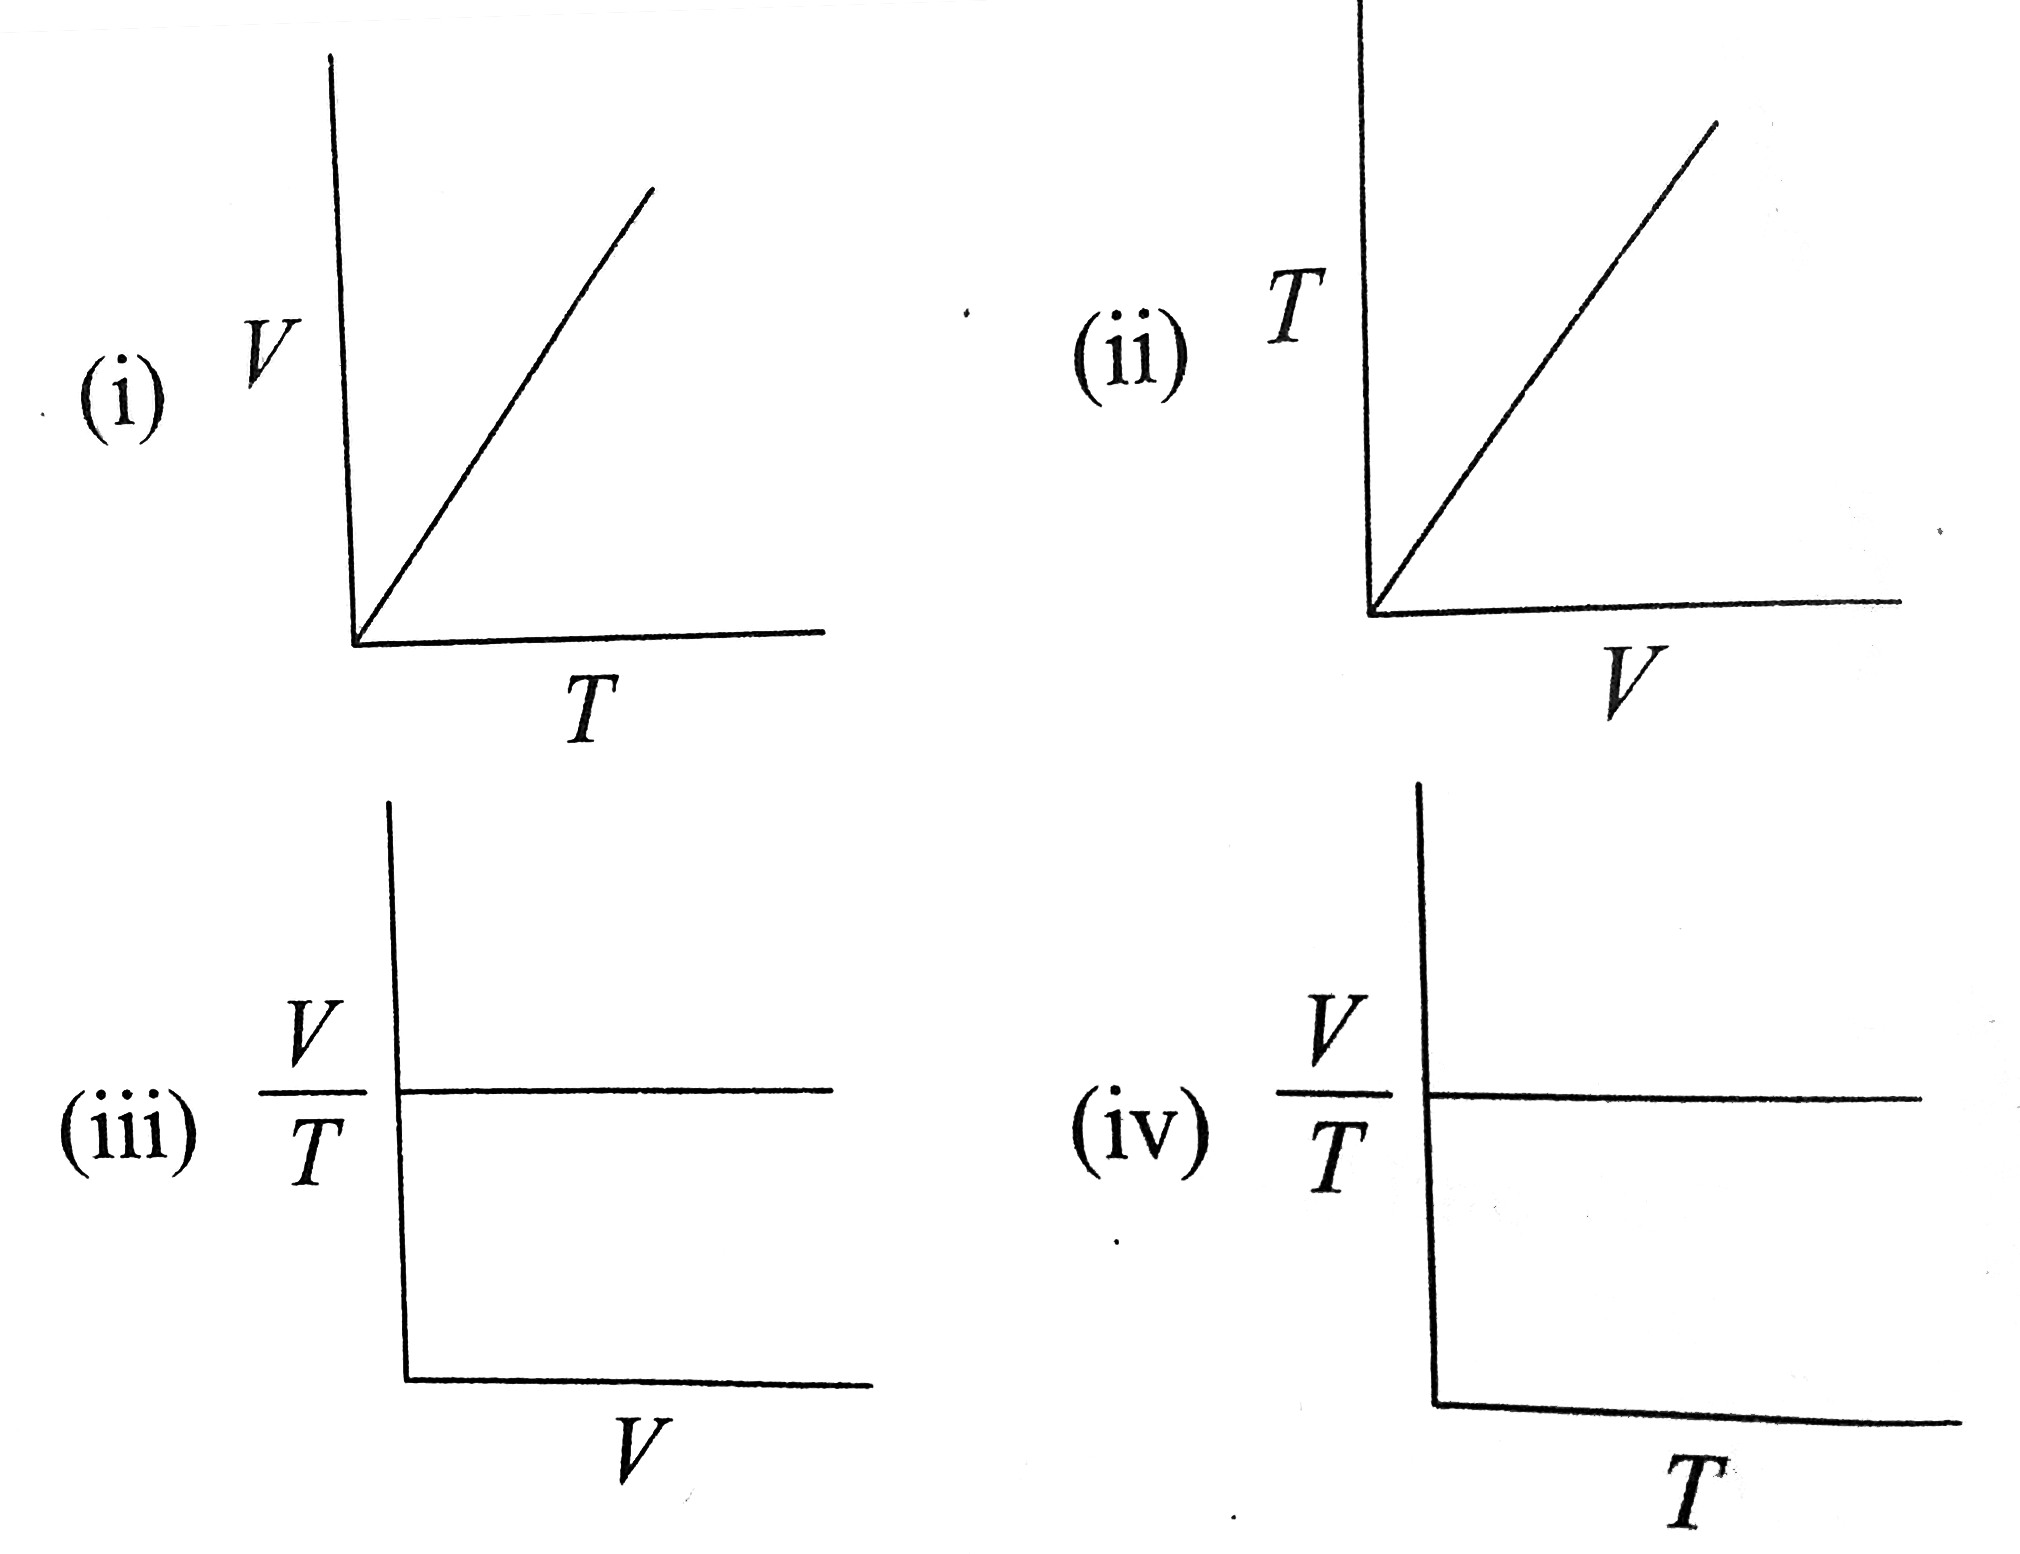
View SolutionWhich of the following flowchart correctly represents the relationship between Domestic concepts ?
View SolutionWhich of the following x-t graphs represents the distance-time variation of a body released from the top of a buiding?
View SolutionWhich of the following correctly represents the relationship among illiterates, poor people and unemployed?
View Solution


