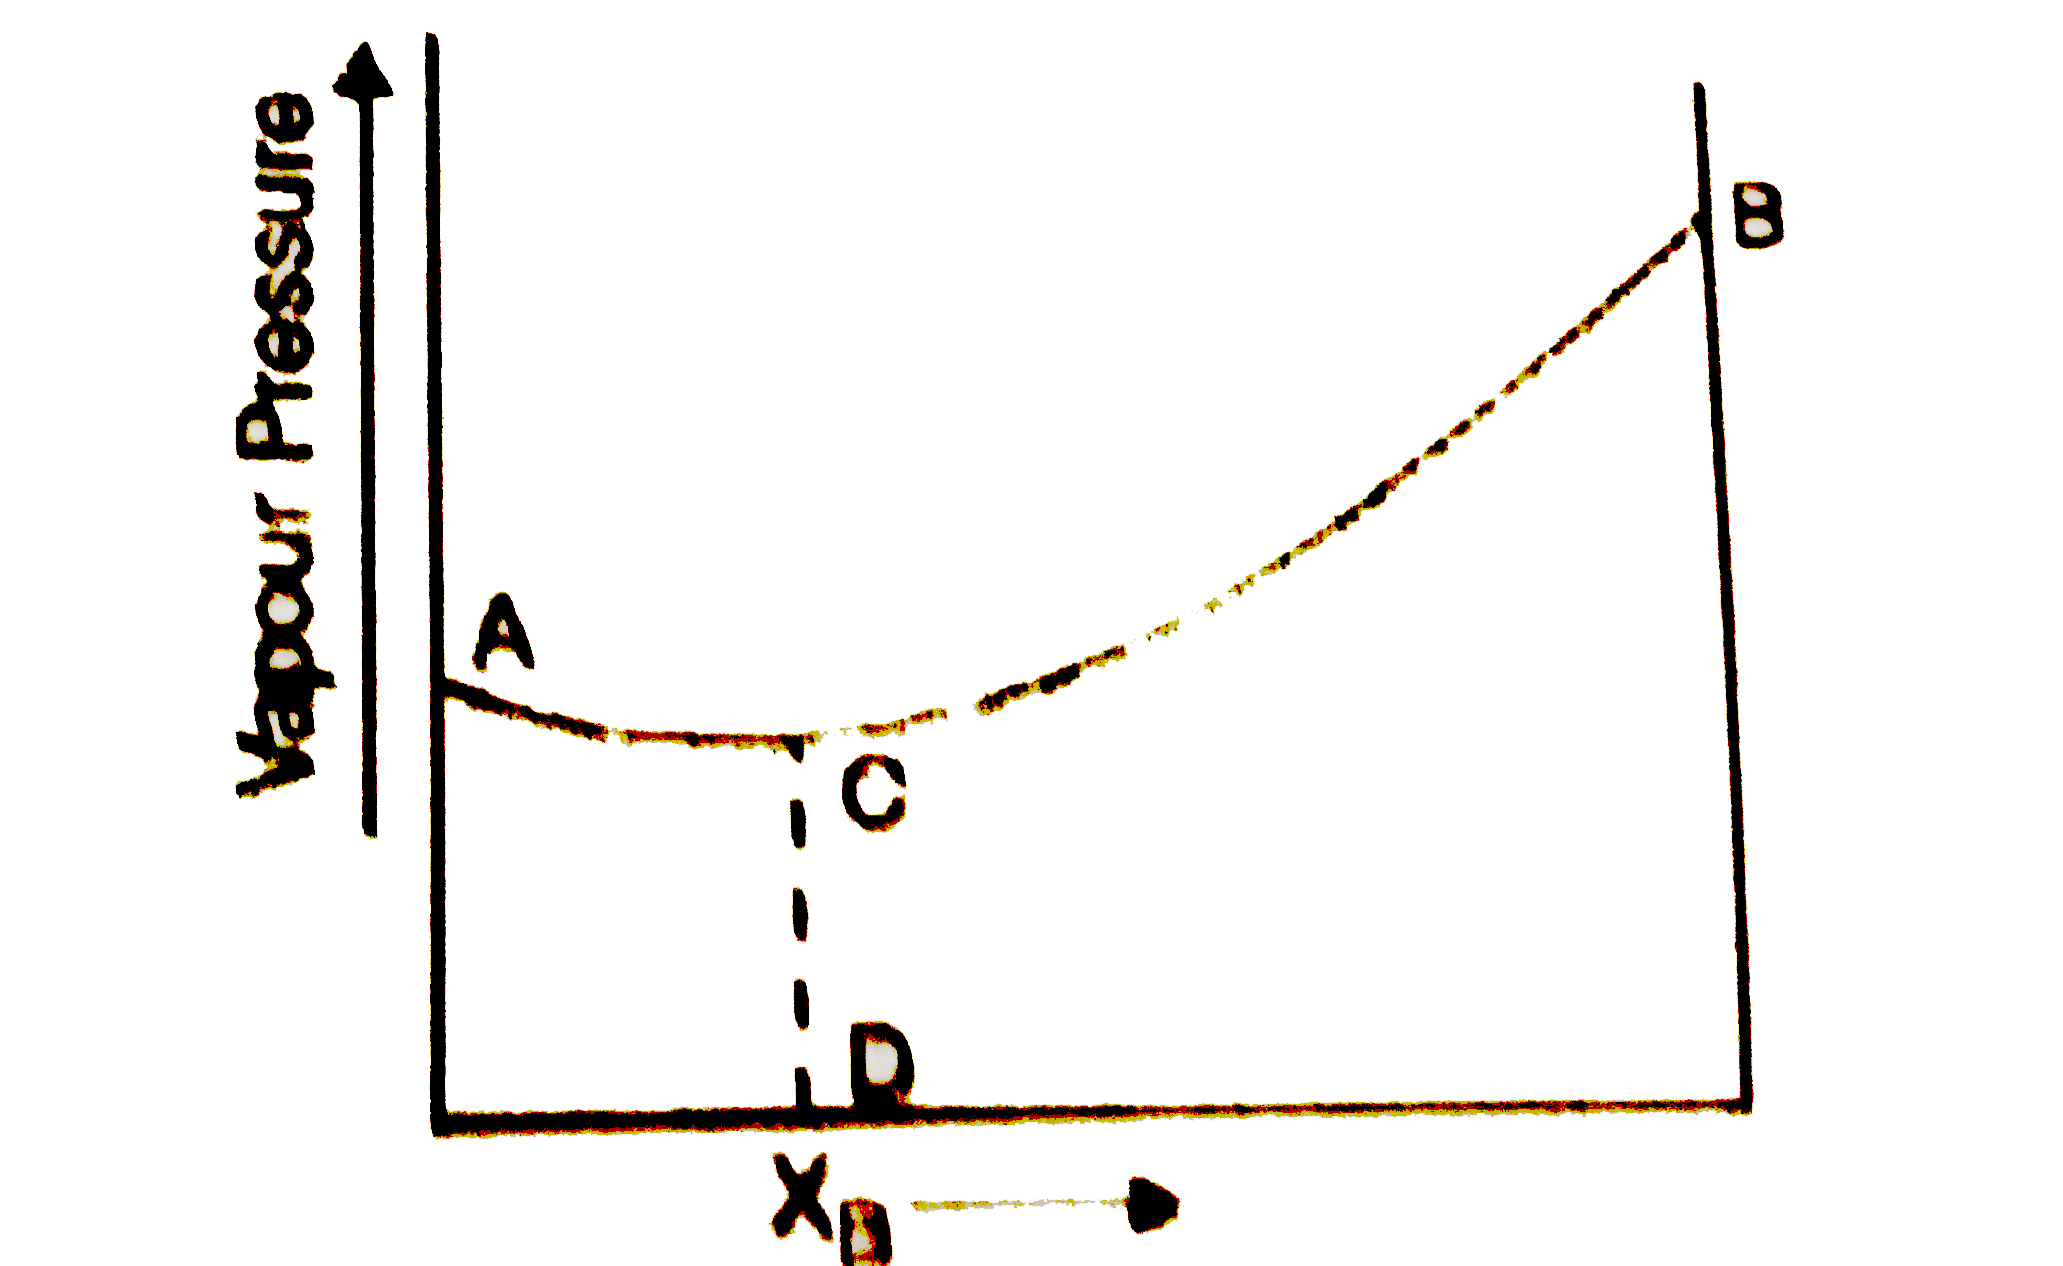
The diagram given below is a vapour pressure composition diagram for a binary solution of A and B. In the solution A-B interactions are
similar to A−A and B−B interactions
greater than A-A and B-B interactions
smaller than A-A and B-B interactions
unpredictable
The correct Answer is:B
The curve represents the solution with -ve deviation.
Topper's Solved these Questions
- SOLUTIONS Book:DINESH PUBLICATIONChapter:SOLUTIONS Exercise:REVISION QUESTION
Explore 186 Videos
- SOLUTIONS Book:DINESH PUBLICATIONChapter:SOLUTIONS Exercise:OBJECTIVE TYPE MCQs
Explore 47 Videos
- SOLID STATEBook:DINESH PUBLICATIONChapter:SOLID STATEExercise:Brain storming
Explore 10 Videos
- SOME BASIC CONCEPTS OF CHEMISTRYBook:DINESH PUBLICATIONChapter:SOME BASIC CONCEPTS OF CHEMISTRYExercise:ULTIMATE PREPARATORY PACKAGE
Explore 20 Videos
Similar Questions
Liquids A and B form ideal solution over the entire range of composition. At temperature T, equimolar binary solution of liquids A and B has vapour pressure 45 torr. At the same temperature, a new solution of A and B having mole fractions xAandxB, respectively, has vapours pressure of 22. torr. The value of xA/xB in the new solution is ______.
(Given that the vapour pressure of pure liquid A is 20 torr at temperature T).
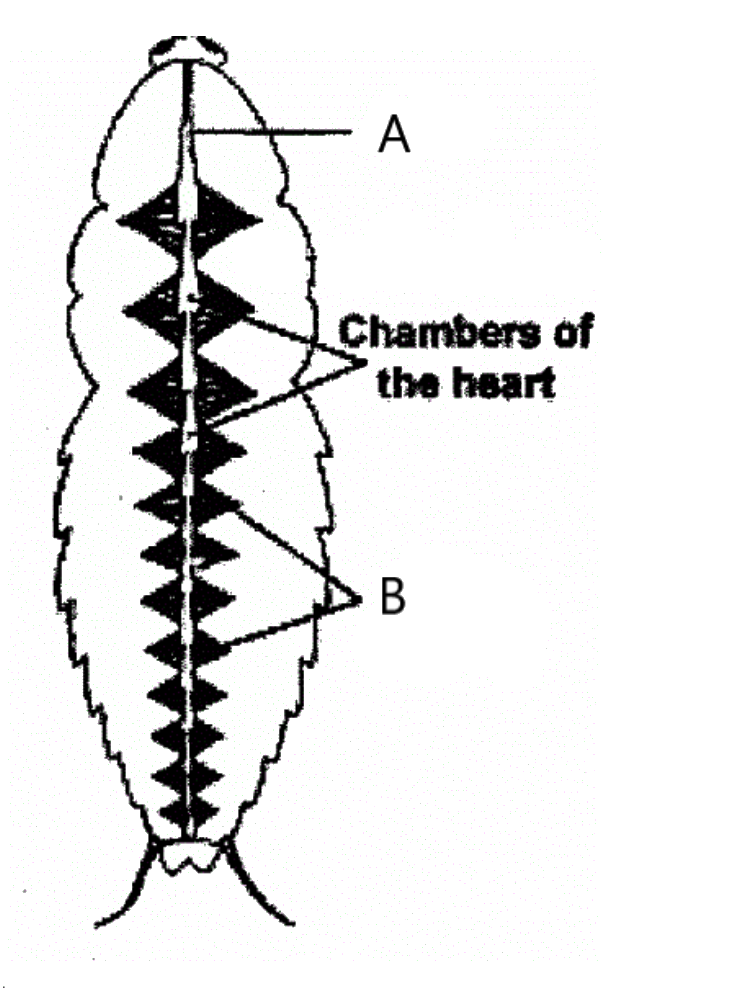
View SolutionRefer to the diagram given below and identify A and B .
View Solution
Knowledge Check
The diagram given below represents boiling point composition diagram of solution of component A and B. Which is/are incorrect among the following ?
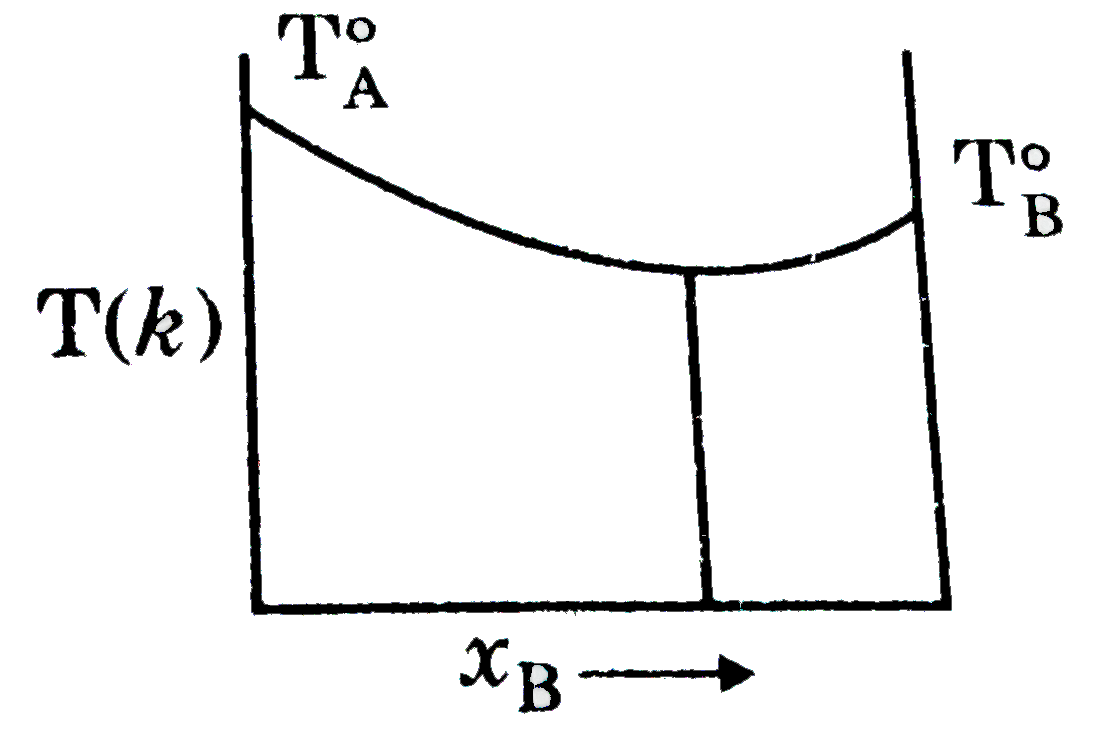 AThe solution shows negative deviation.BA-B interaction are stronger than A-A and B-BCThe solution is ideal solutionDThe solution shows positive deviation
The diagram given below represents boiling point composition diagram of solution of component A and B, which is/are incorrect among the following?
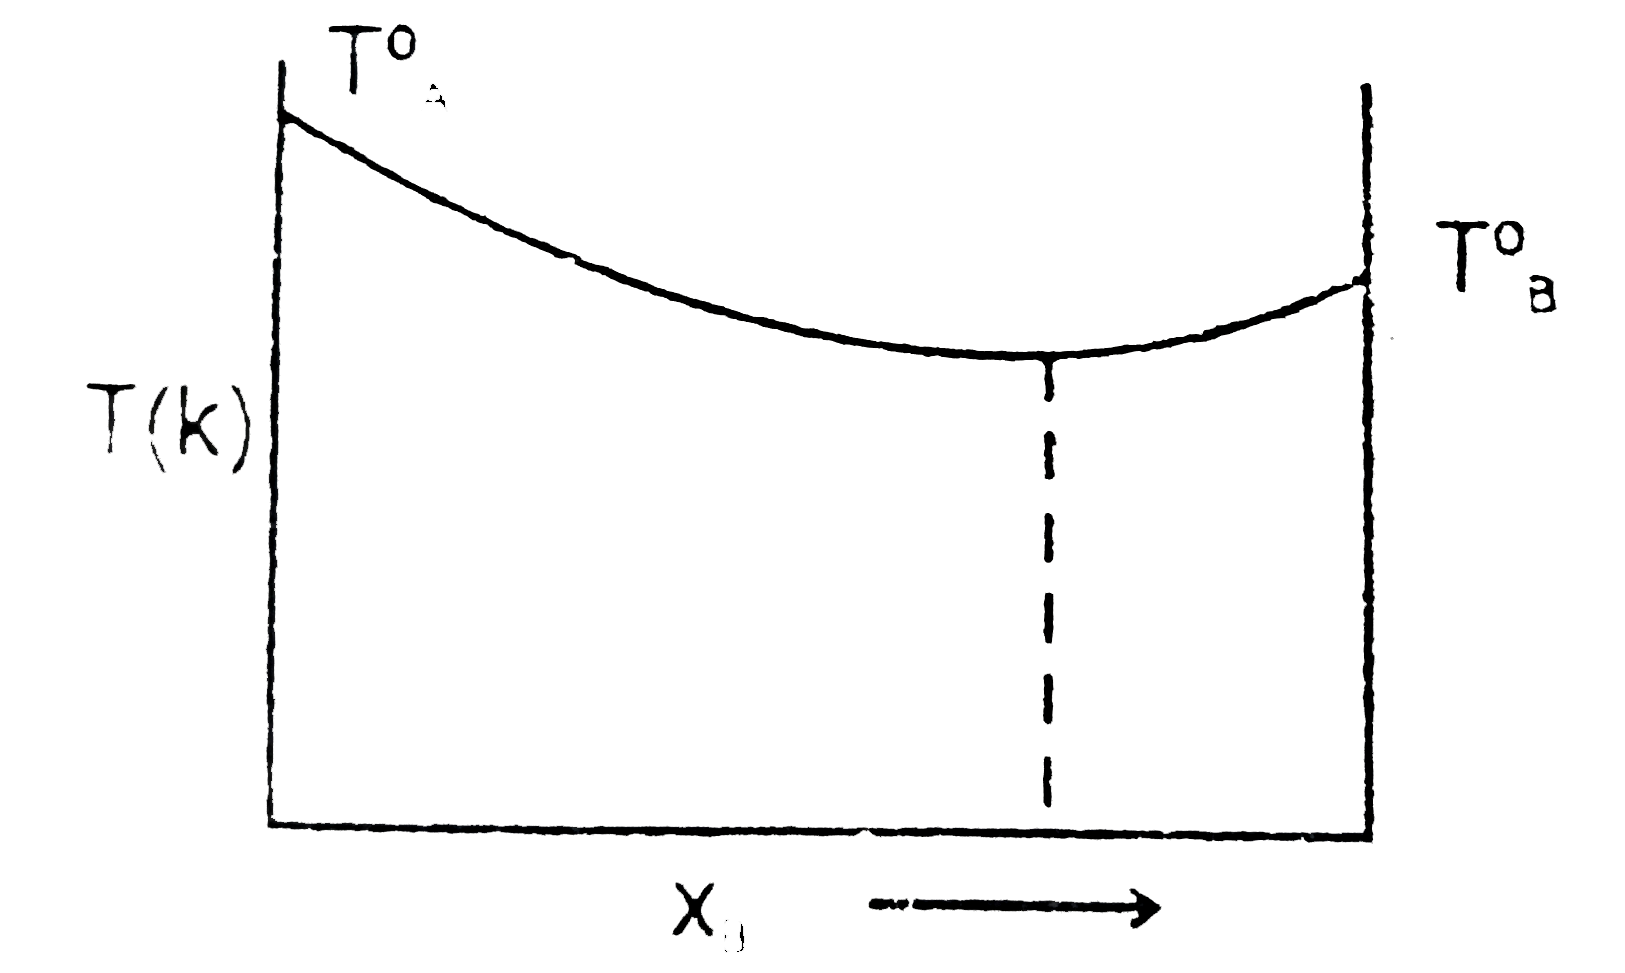 AThe solution shows negative deviationBA−B− interactions are stronger than A−A and B−BCKH has temperature dependenceDKH increases with temperature
In the diagram given in the point D refers to composition where, the solution exhibits
AMaximum boiling azeotropyBMinimum boiling azeotropyCHighest vapour pressureDLowest boiling point
Answer the questions (given below) which are based on the following diagram: vapour pessure diagram for real solution of two liquids A and B that exhibit a negative deviation from Raoult's law. The vapour pressure of both A and B are less than predicted by Raoult's law. The dashed lines represent the plots for ideal solutions.
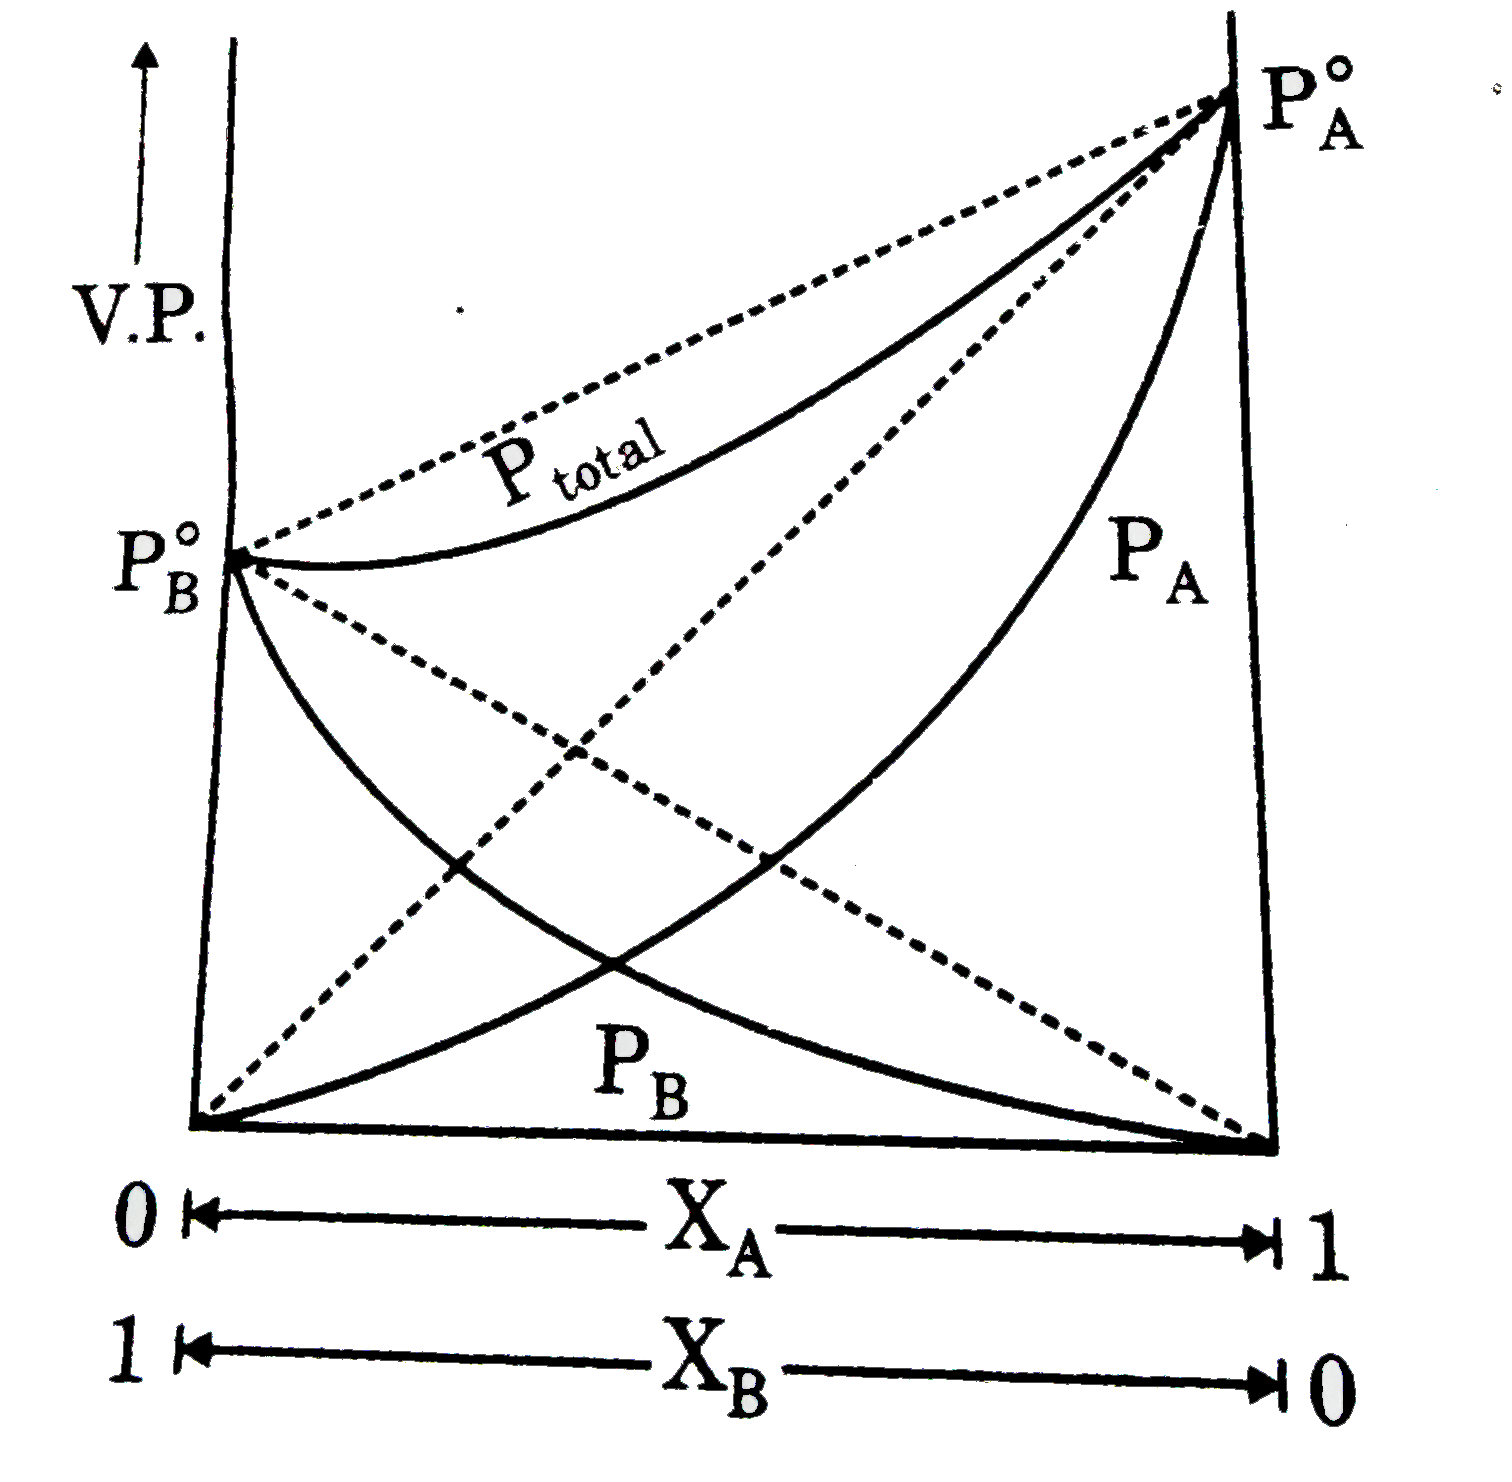
Solution containing components A and B show this type of deviation from ideal behaviour when:
View SolutionAnswer the question (given below) which are based on the following diagra.
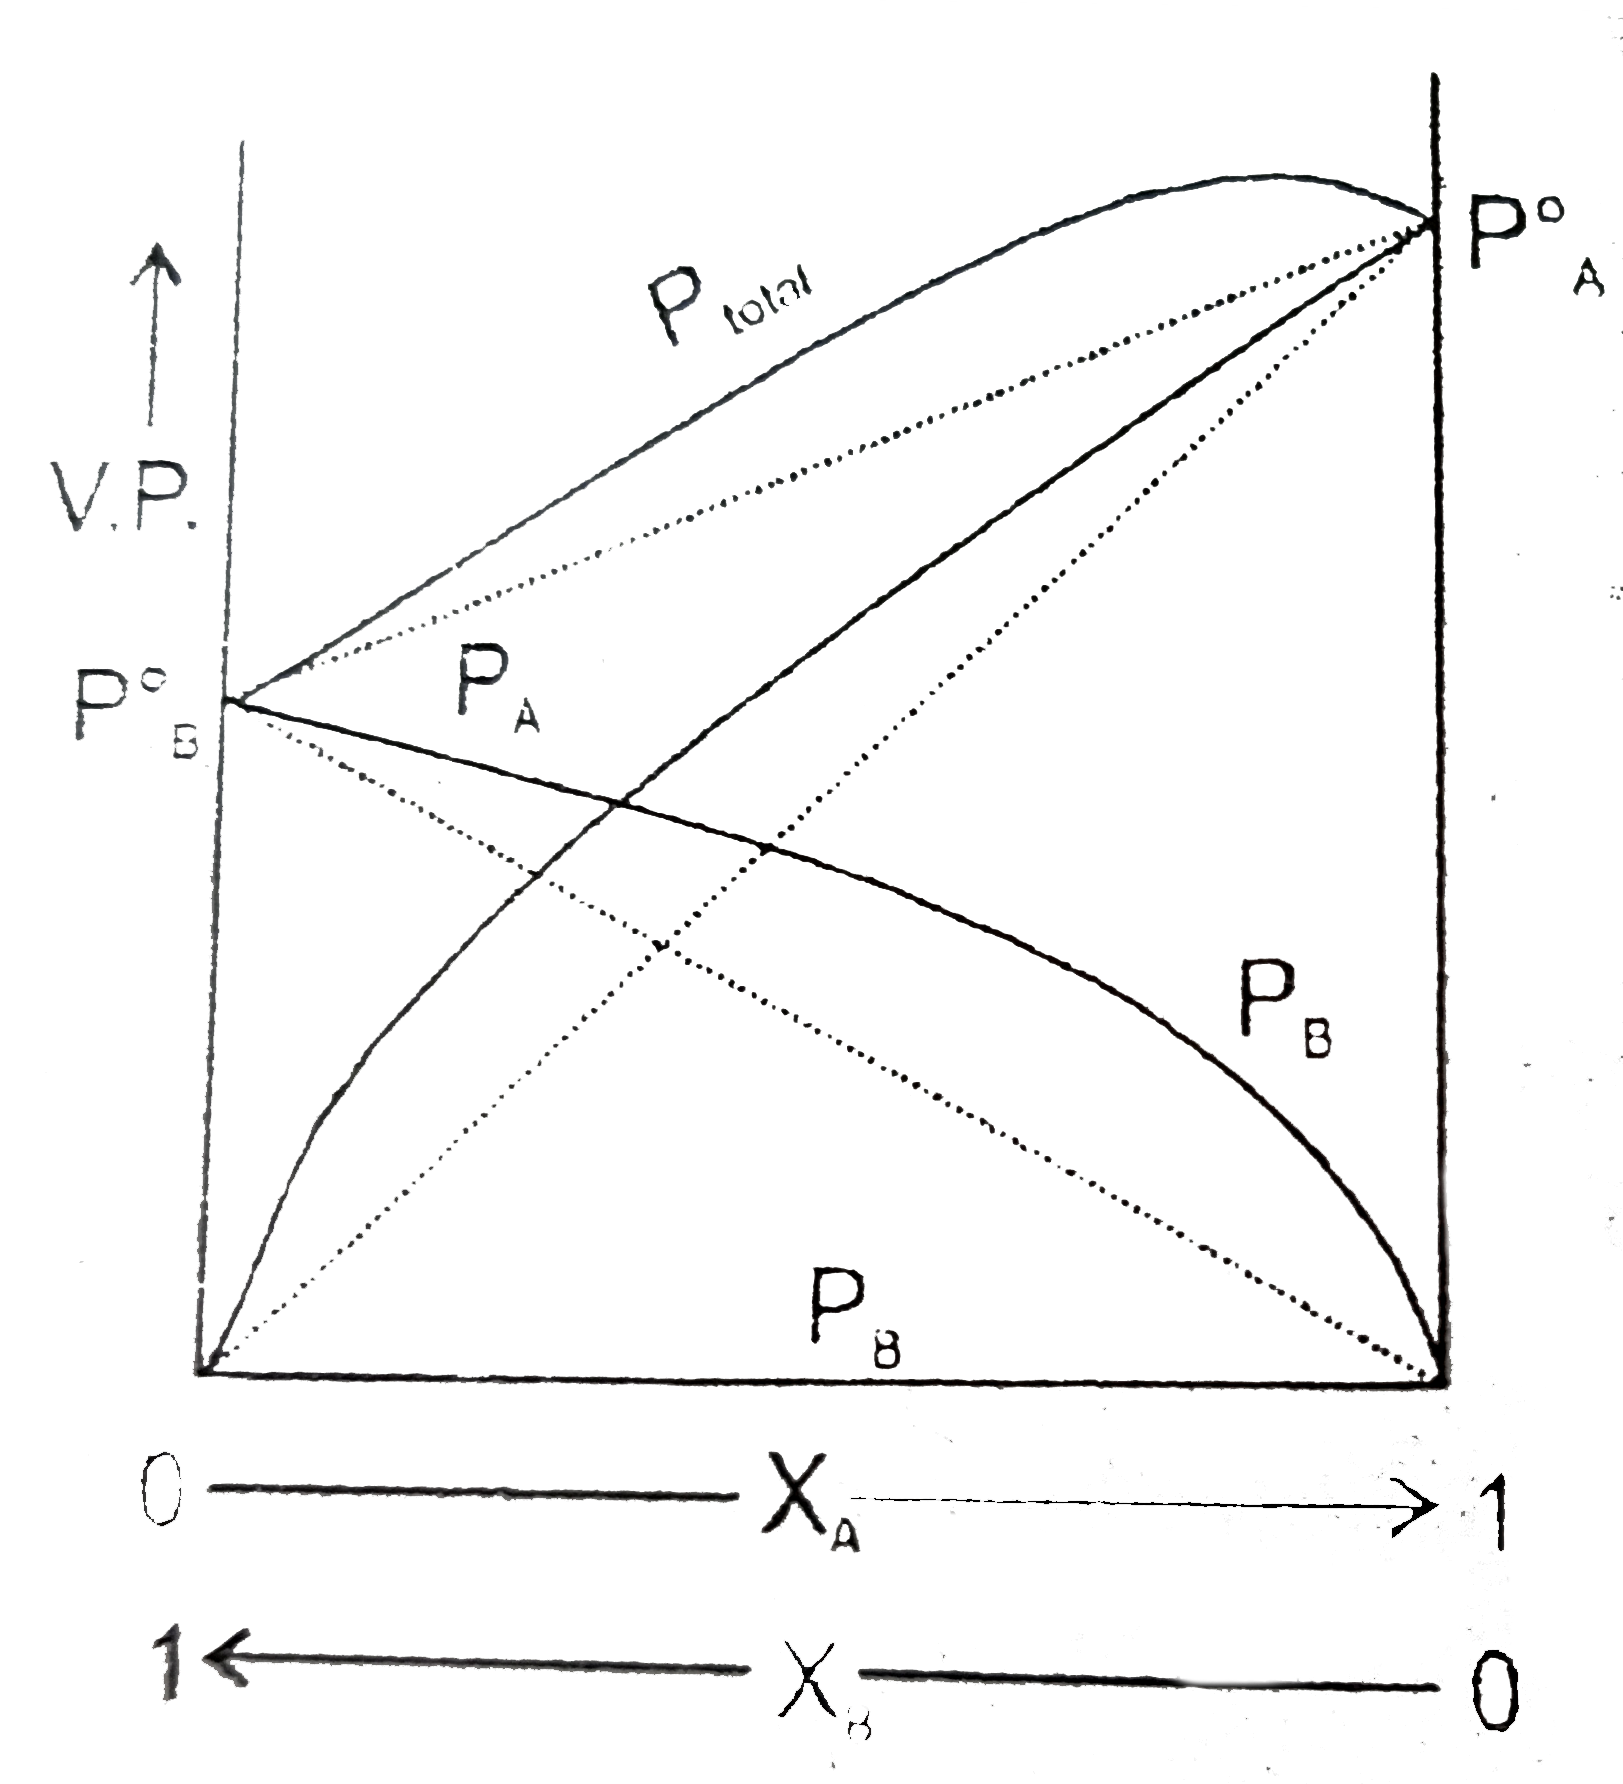
Consider some facts about the above phase diagram :
Vapour pressure diagram for real solutions of two liquids A and B that exhibit a positive deviation from Raoult's law. The vapour pressure of both A and B are greater than predicted by Raoult's law. The dashed lines lines represented the plots for ideal solutions.
A: This is observed when A...B attraction are greater than average of A...B and B...B attraction:
B: ΔHmix=+ve,ΔVmix=+ve
C: Boiling point is smaller than expected such that vaporisation is increased
D: Mixture is called azeotropic mixture
Select correct facts
View SolutionAnswer the questions (given below) which are based on the following diagram ?
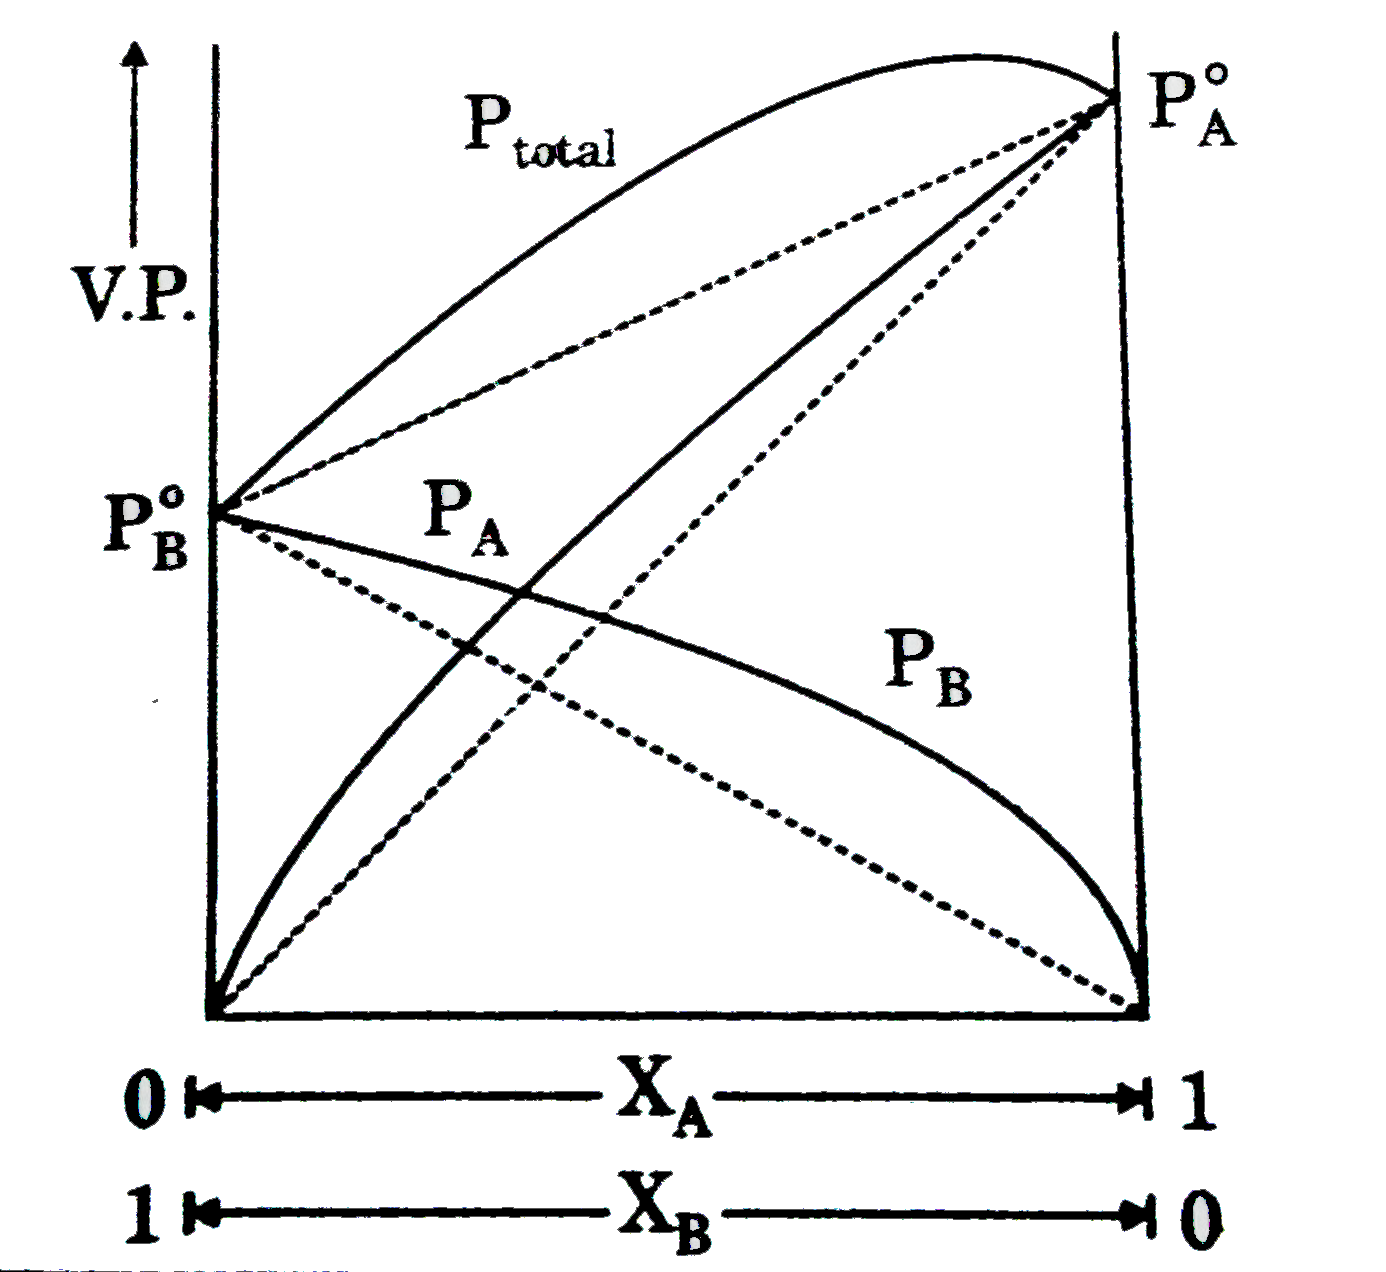
Consider some facts about the above phase diagram. Vapour pressure diagram for real solutions of two liquids A and B that exhibit a positive deviation from Raoult's law. The vapour presssure of both A and B are greater than predicted by Raoult's law. The dashed lines represented the plots for ideal solutions.
A : This is obserbed when A...B attractions are greater than average of A...B and B.....B attraction :
B : ΔHmix=+ve,ΔVmix=+ve
C : Boiling point is smaller than expected such that vaporisation is increased
D : Mixture can from azeotropic mixture Select correct facts.
View SolutionAnswer the question (given below) which are based on the following diagra.
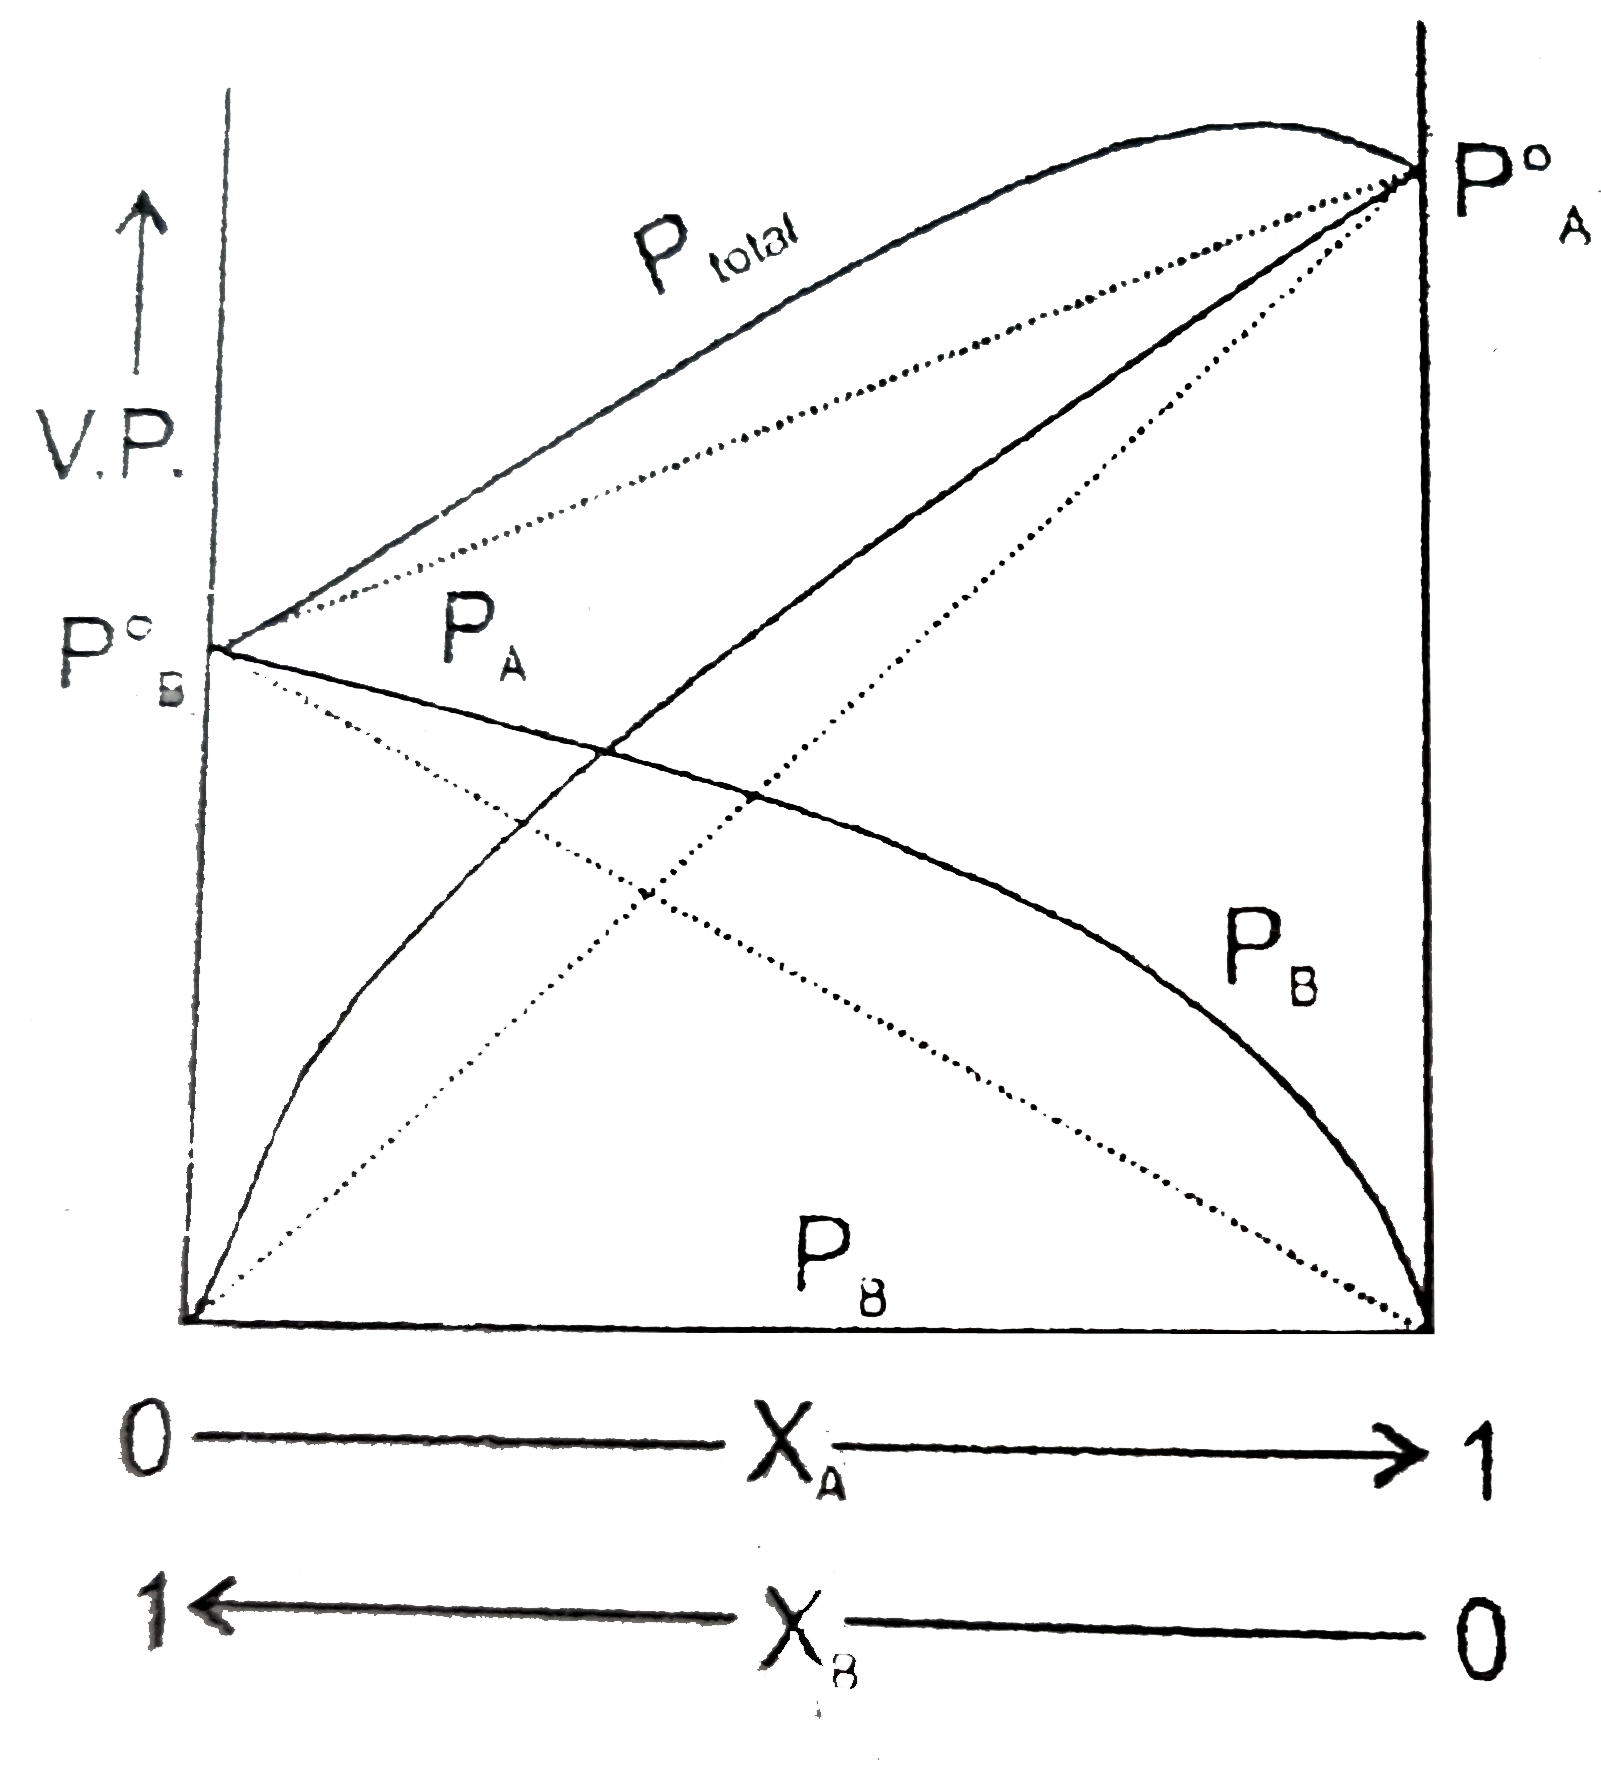
Consider some facts about the above phase diagram :
Vapour pressure diagram for real solutions of two liquids A and B that exhibit a positive deviation from Raoult's law. The vapour pressure of both A and B are greater than predicted by Raoult's law. The dashed lines lines represented the plots for ideal solutions.
Total vapour pressure of mixture of 1 mol of volatile component A(P∘A=100mmHg) and 3 mol of volatile component B(P∘B=60mmHg) is 75mm. For such case:
View SolutionFor a binary ideal liquid solution, the total vapour of the solution is given as:
View Solution

