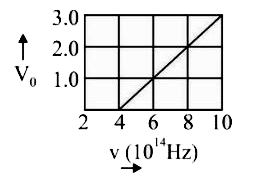
A student performs an experiment on photoelectric effect using two materials A and B. A plot of stopping potential (V0) vs frequency (ν) is as shown in the figure.
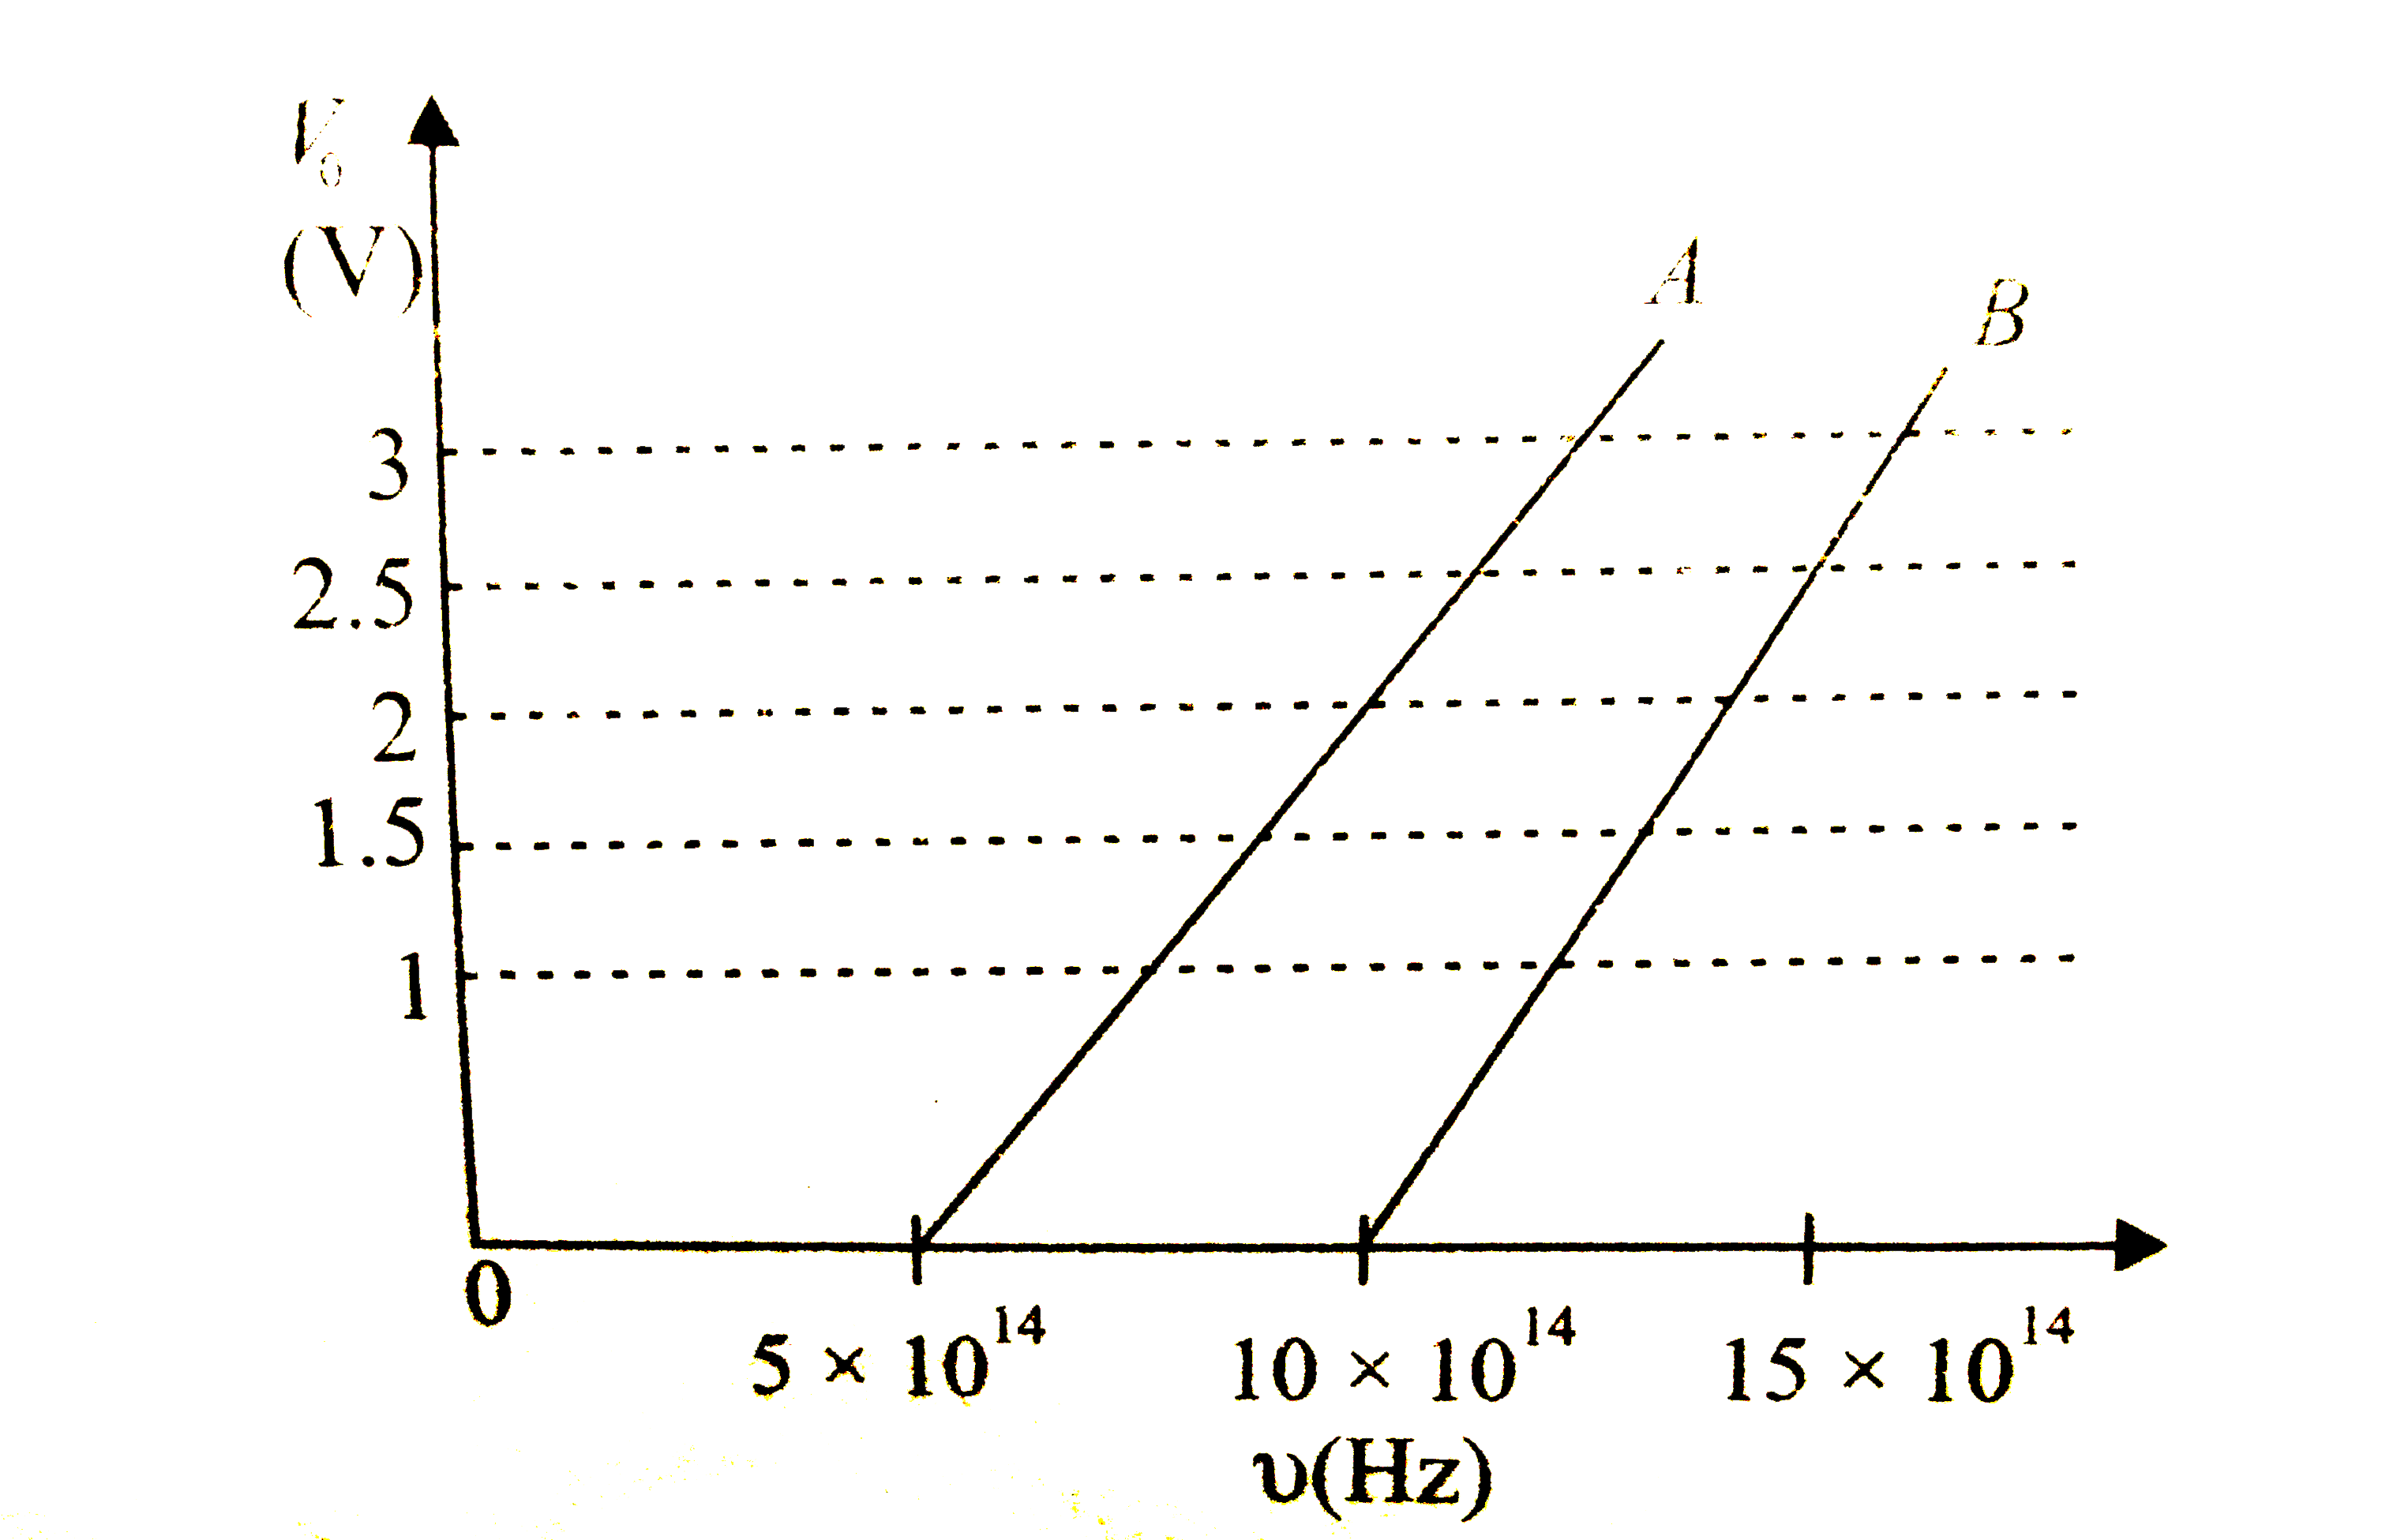
The value of Planck's constant obtained from the experiment for both A and B respectively is
(Given electric charge of an electron =1.6×10⁻¹⁹C)
3.2×10⁻³⁴Js,4×10−34Js
6.4×10⁻³⁴Js,8×10−34Js
1.2×10⁻³⁴Js,3.2×10−34Js
4.2×10⁻³⁴Js,5×10−34Js
The correct Answer is:B
(b) : 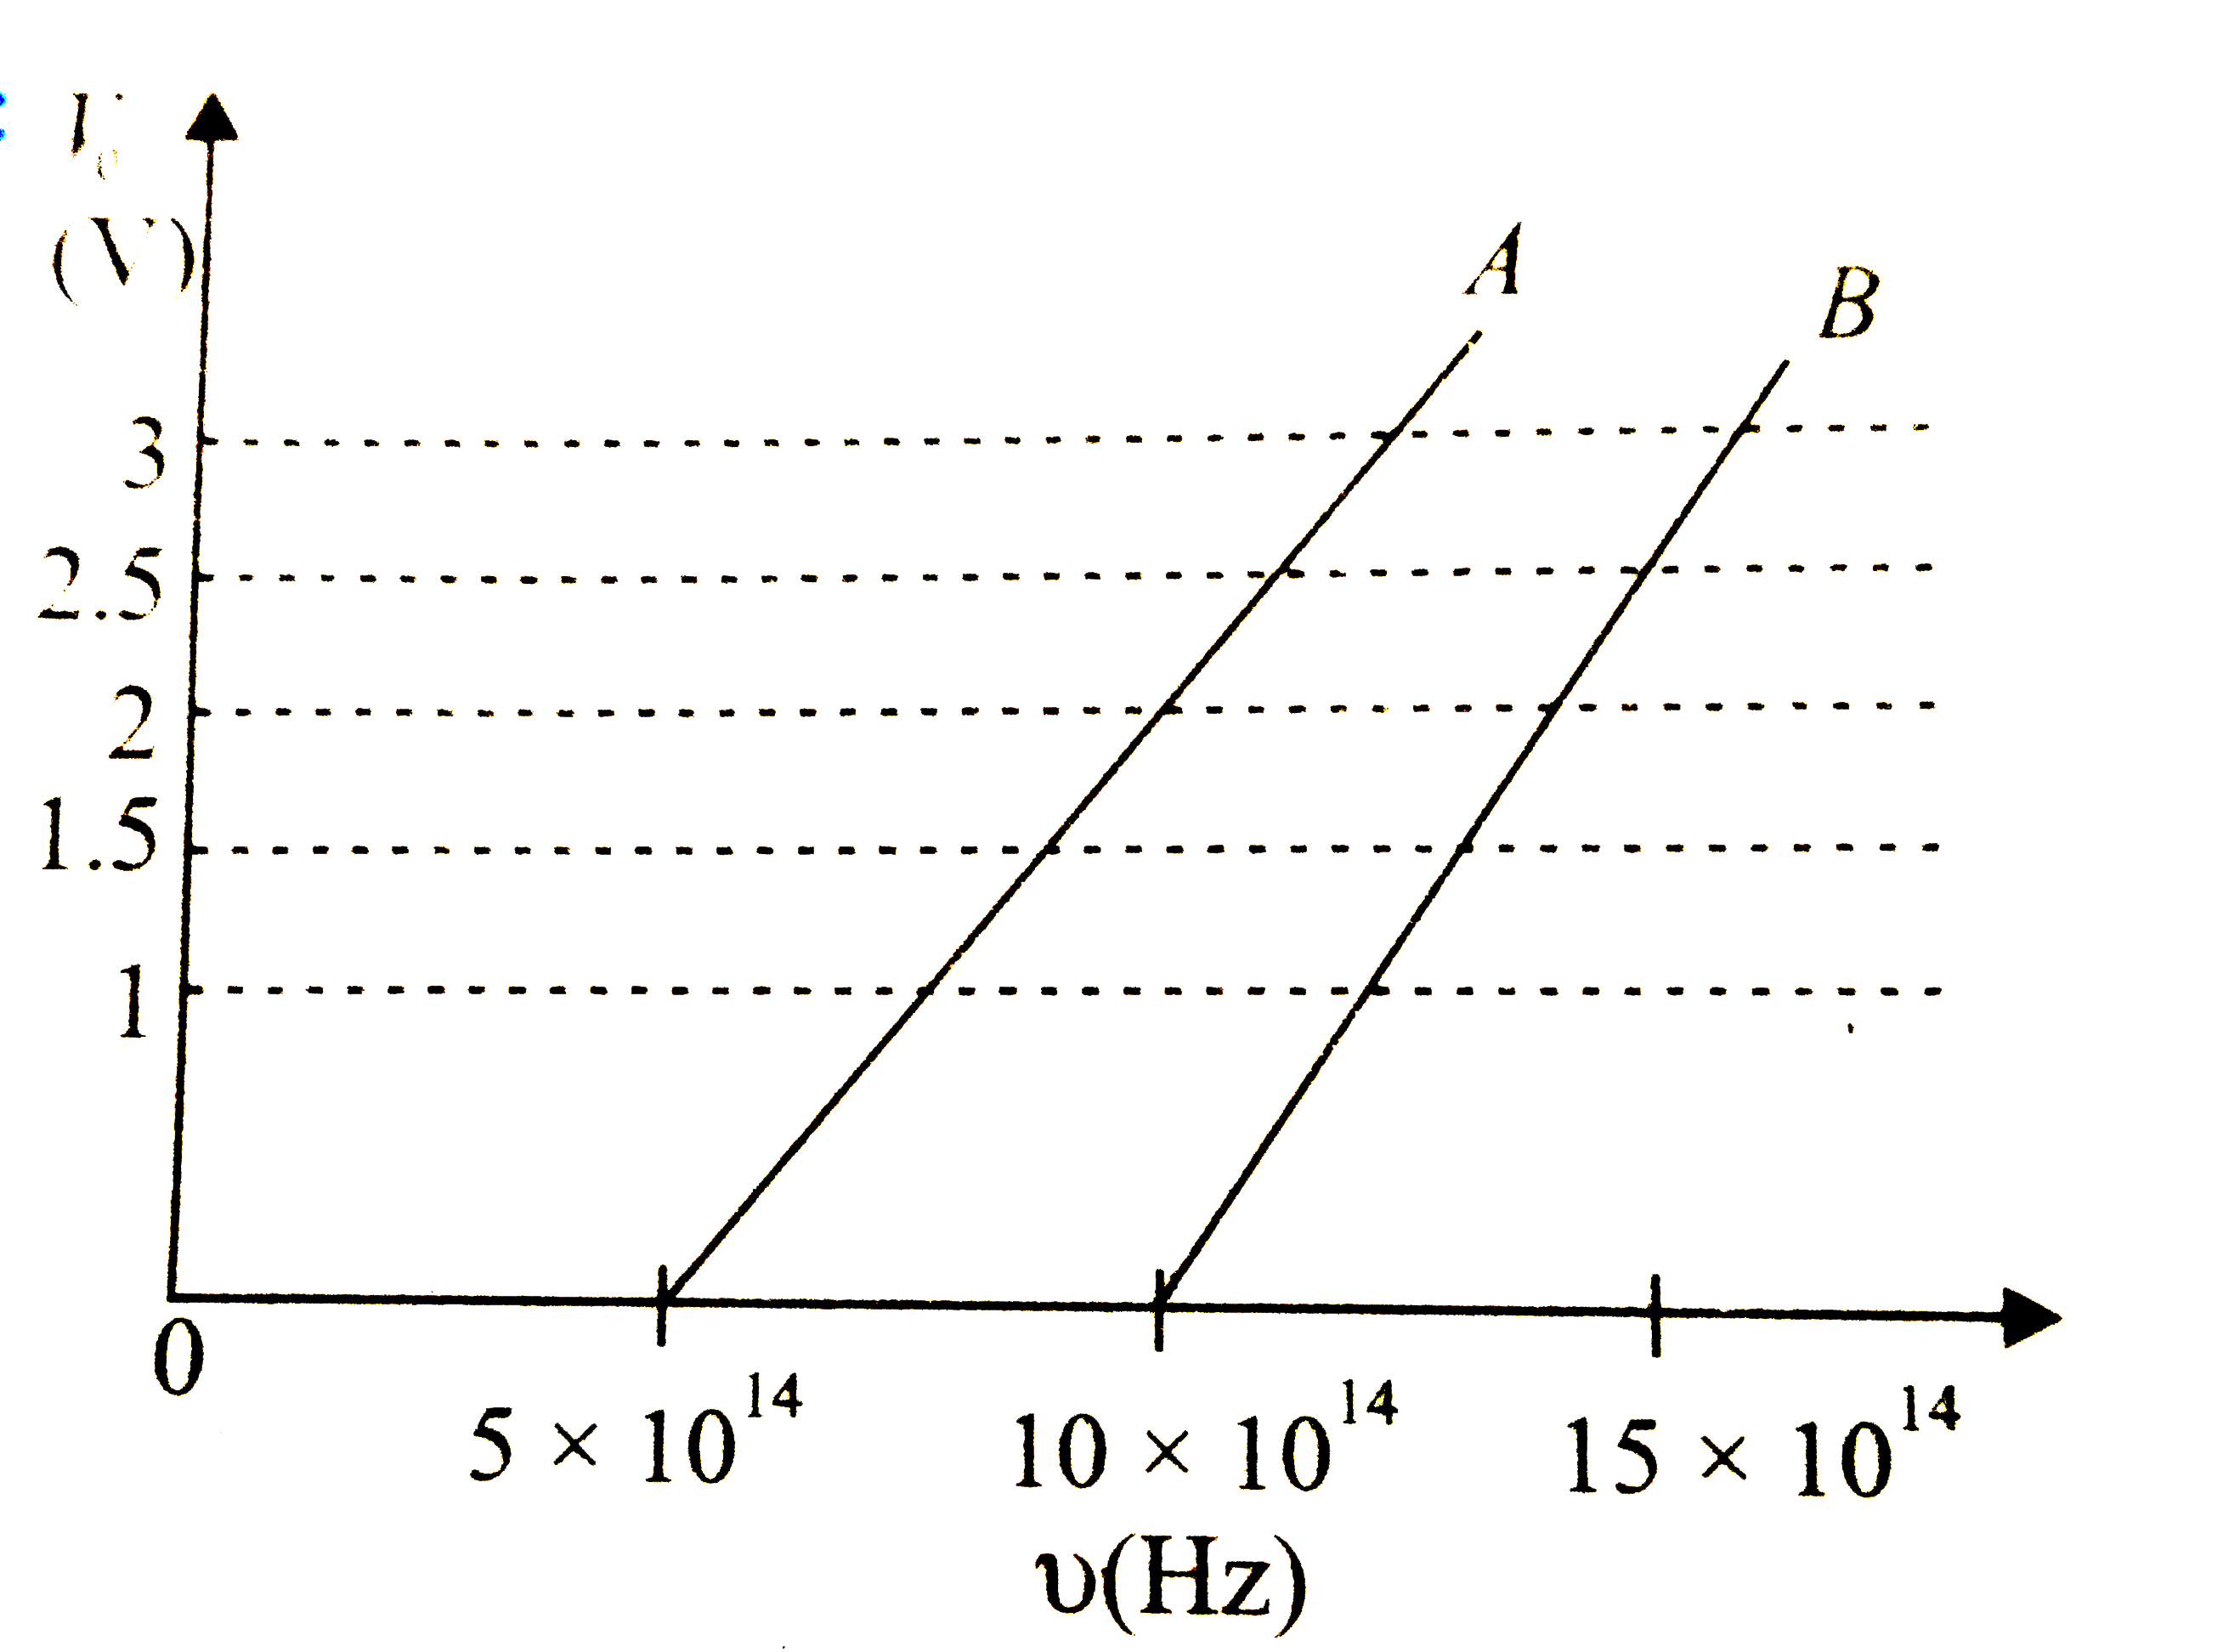
For metal A, Slope =he=2−0(10−5)×1014
orh=2×e5×1014=2×1.6×10−195×1014=6.4×10⁻³⁴J s
For metal B, Slope =he=2.5−0(15−10)×1014
h=2.5×e5×1014=2.5×1.6×10−195×1014=8×10⁻³⁴J s
Topper's Solved these Questions
- DUAL NATURE OF RADIATION AND MATTER Book:NCERT FINGERTIPSChapter:DUAL NATURE OF RADIATION AND MATTER Exercise:Particle Nature Of Light : The Photon
Explore 19 Videos
- DUAL NATURE OF RADIATION AND MATTER Book:NCERT FINGERTIPSChapter:DUAL NATURE OF RADIATION AND MATTER Exercise:Wave Nature Of Matter
Explore 37 Videos
- DUAL NATURE OF RADIATION AND MATTER Book:NCERT FINGERTIPSChapter:DUAL NATURE OF RADIATION AND MATTER Exercise:Experimental Study Of Photoelectric Effect
Explore 11 Videos
- CURRENT ELECTRICITYBook:NCERT FINGERTIPSChapter:CURRENT ELECTRICITYExercise:Assertion And Reason
Explore 15 Videos
- ELECTRIC CHARGES AND FIELDSBook:NCERT FINGERTIPSChapter:ELECTRIC CHARGES AND FIELDSExercise:Assertion And Reason
Explore 15 Videos
Similar Questions
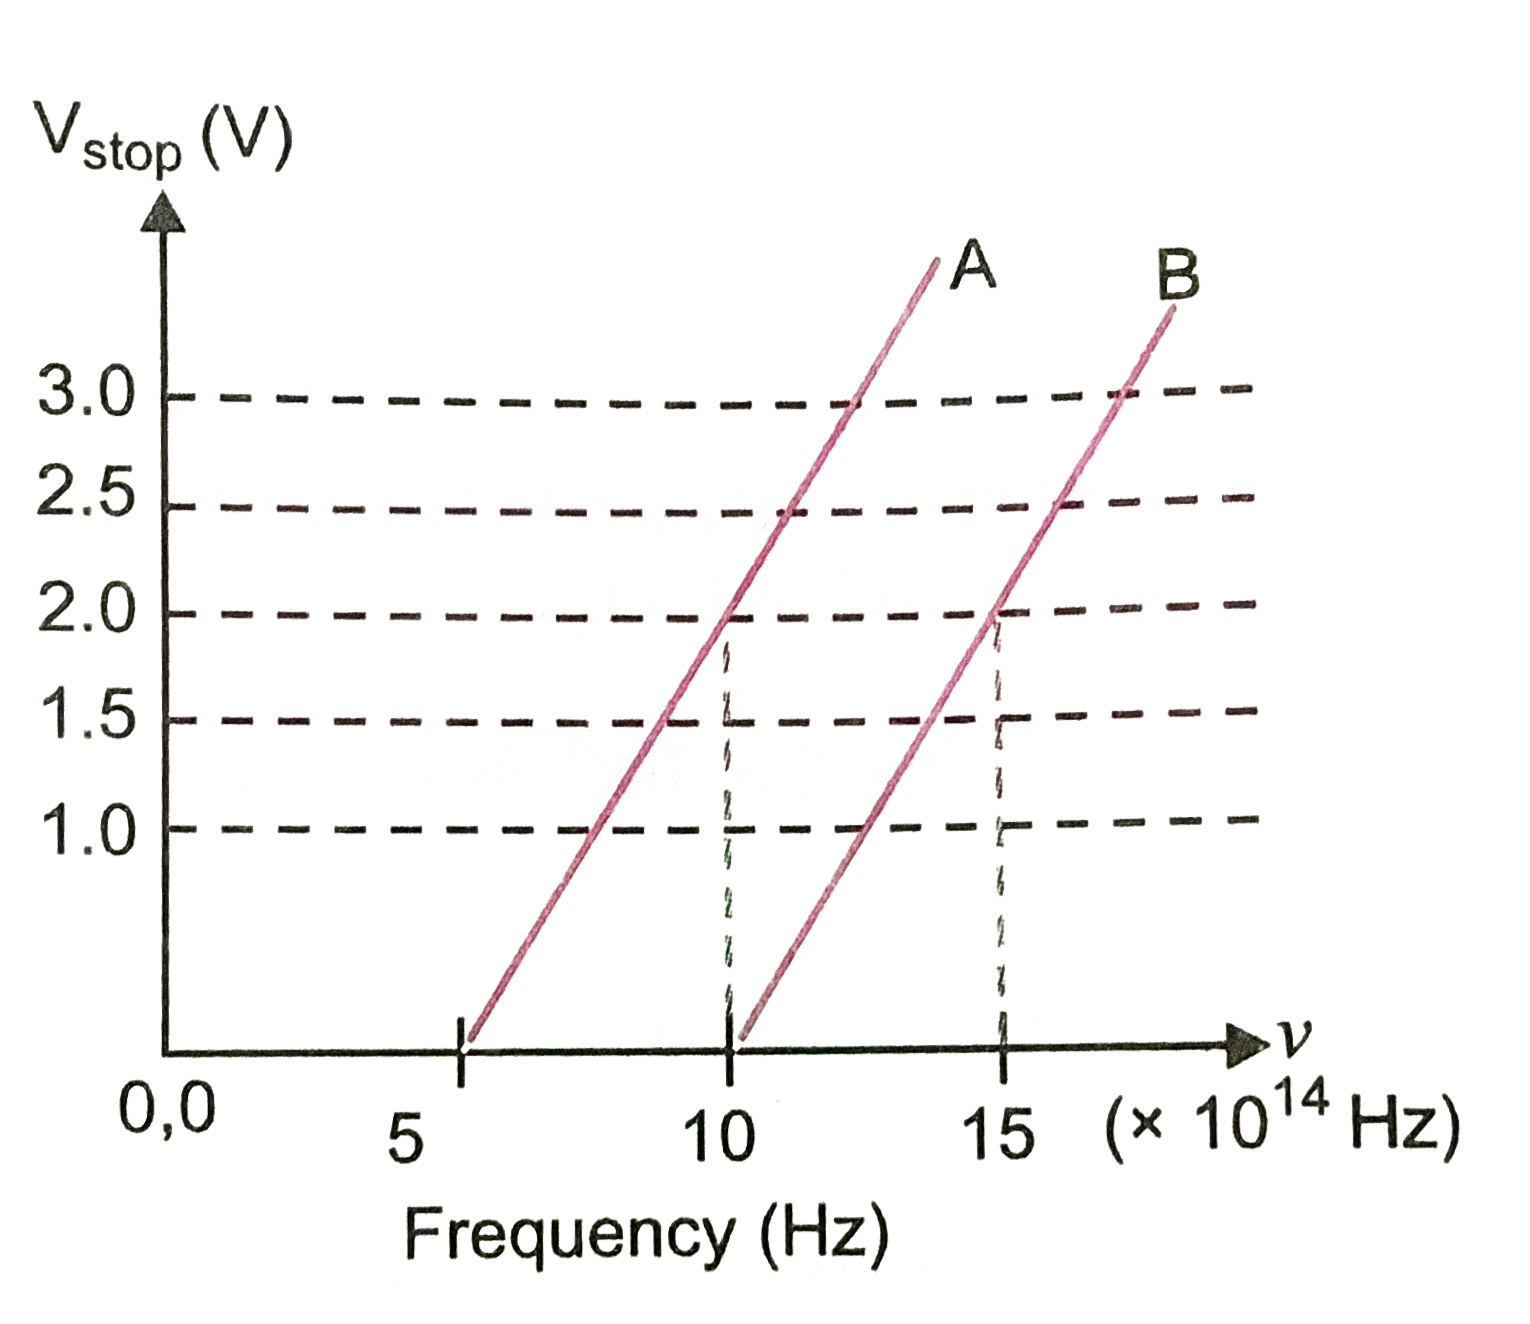
A student performs an experiment on photoelectric effect, using two materials A and B. A plot of Vs⊤vs.ν is given in fig.
(i) Which material A or B has a higher work function?
(ii) Given the electric charge of an electron =1.6×10⁻¹⁹C, find the value of h obtained from the experiment for both A and B. Comment on whether it is consistant with Eistein's theory.
View SolutionIn an experiment on photoelectric effect, the slope of the cut-offf voltage versus frequency of incident light is found to be 4.12×10⁻¹⁵V s. calculate the value of Planck's constant.
View Solution
Knowledge Check
A student performs an experiment on photoelectric effect using two materials A and B. A plot of stopping potential (V0) vs frequency (ν) is as shown in the figure.

The value of Planck's constant obtained from the experiment for both A and B respectively is
(Given electric charge of an electron =1.6×10⁻¹⁹C)A3.2×10−34Js,4×10−34JsB6.4×10−34Js,8×10−34JsC1.2×10−34Js,3.2×10−34JsD4.2×10−34Js,5×10−34JsIn an experiment on the photoelectric effect , the slope of the cut - off voltage versus frequency of incident light is found to be 4.12×10⁻¹⁵V s . The value of Planck's constant is
A6.592×10−34 J sB6.592×10−31 J sC9.592×10−34 J sD6.592×10−30 J sIn a photoelectric experiment, the graph of frequency v of incident light (in Hz) and stopping potential V (in V) is as shown in the figure. Planck's constant is (e is the elementary charge)
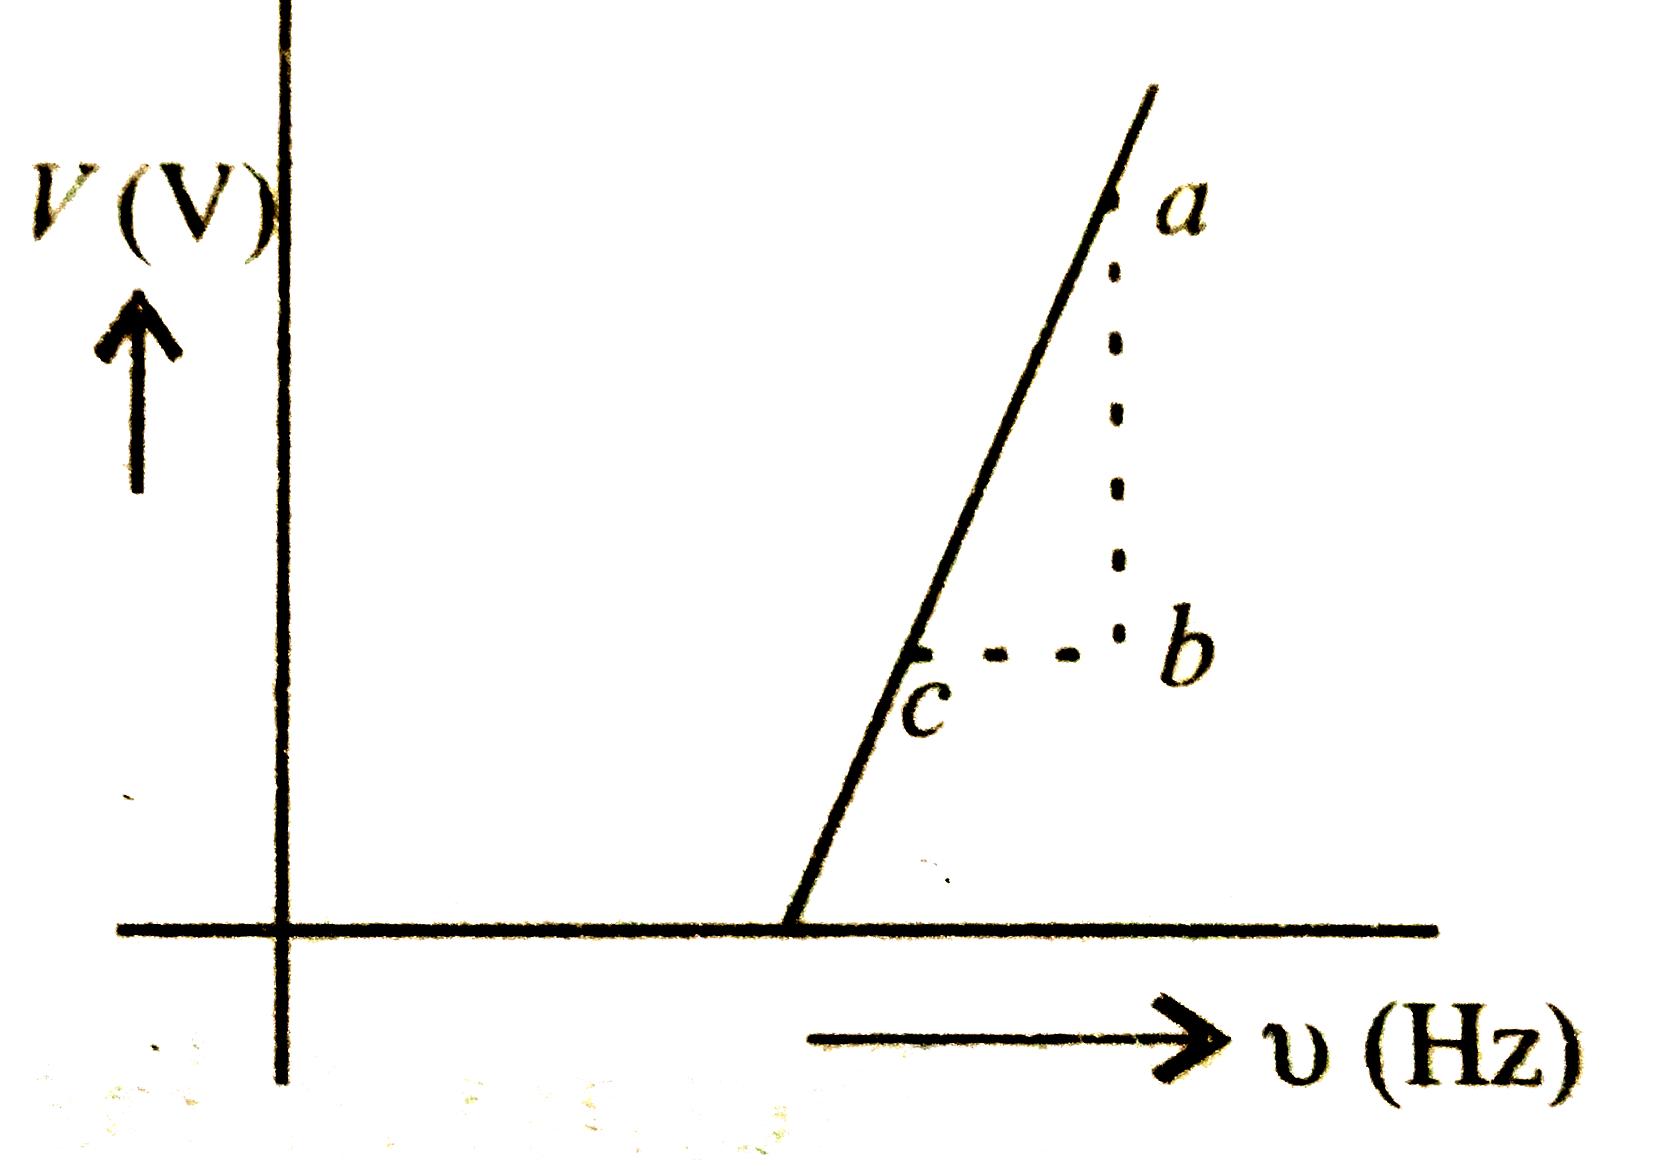 AeabbcBecbacCeacbcDeacab
How many electrons flow through the filament of 220 V and 100 W electric lamp per second. Given, electronic charge =1.6×10⁻¹⁹C.
View SolutionIn an experiment on photoelectric effect, the slope of the cut off voltage versus frequency of incident light is found to be 4.12×10⁻¹⁵Vs. Given e=1.6×10⁻¹⁹C, estimate the value of Planck's constant.
View SolutionThe stopping potential V0 (in volt) as a function of frequency (v) for a sodium emitter, is shown in the figure. The work function of sodium, from the data plotted in the figure, will be:
(Given : Planck’s constant)
(h)=6.63×10⁻³⁴Js electron charge e=1.6×10⁻¹⁹C)
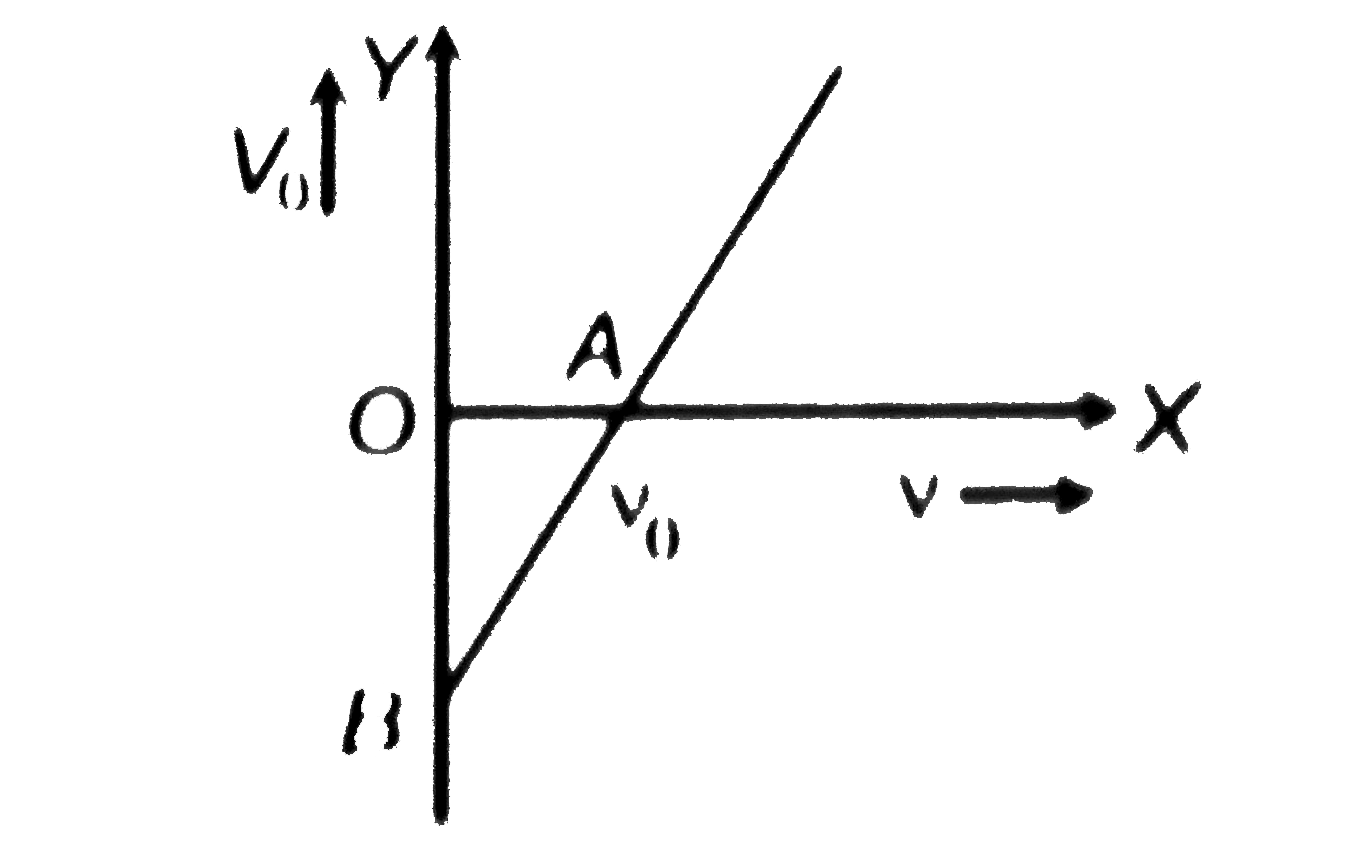
View SolutionIn an experiment on photoelectric effect the frequency f of the incident light is plotted against the stopping potential V0. The work function of the metal is given by ( e is the electronic charge)
View SolutionIn a photocell circuit the stopping potential, V0, is a measure of the maximum kinetic energy of the photoelectrons. The following graph shows experimentally measured values of stopping potential versus frequency v of incident light.
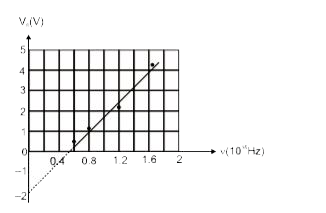
The values of Planks constant and the work function as determined from the graph are (taking the magnitude of electronic charge to be e=1.6×10⁻¹⁹C)
View Solution

