The given graph indicates :
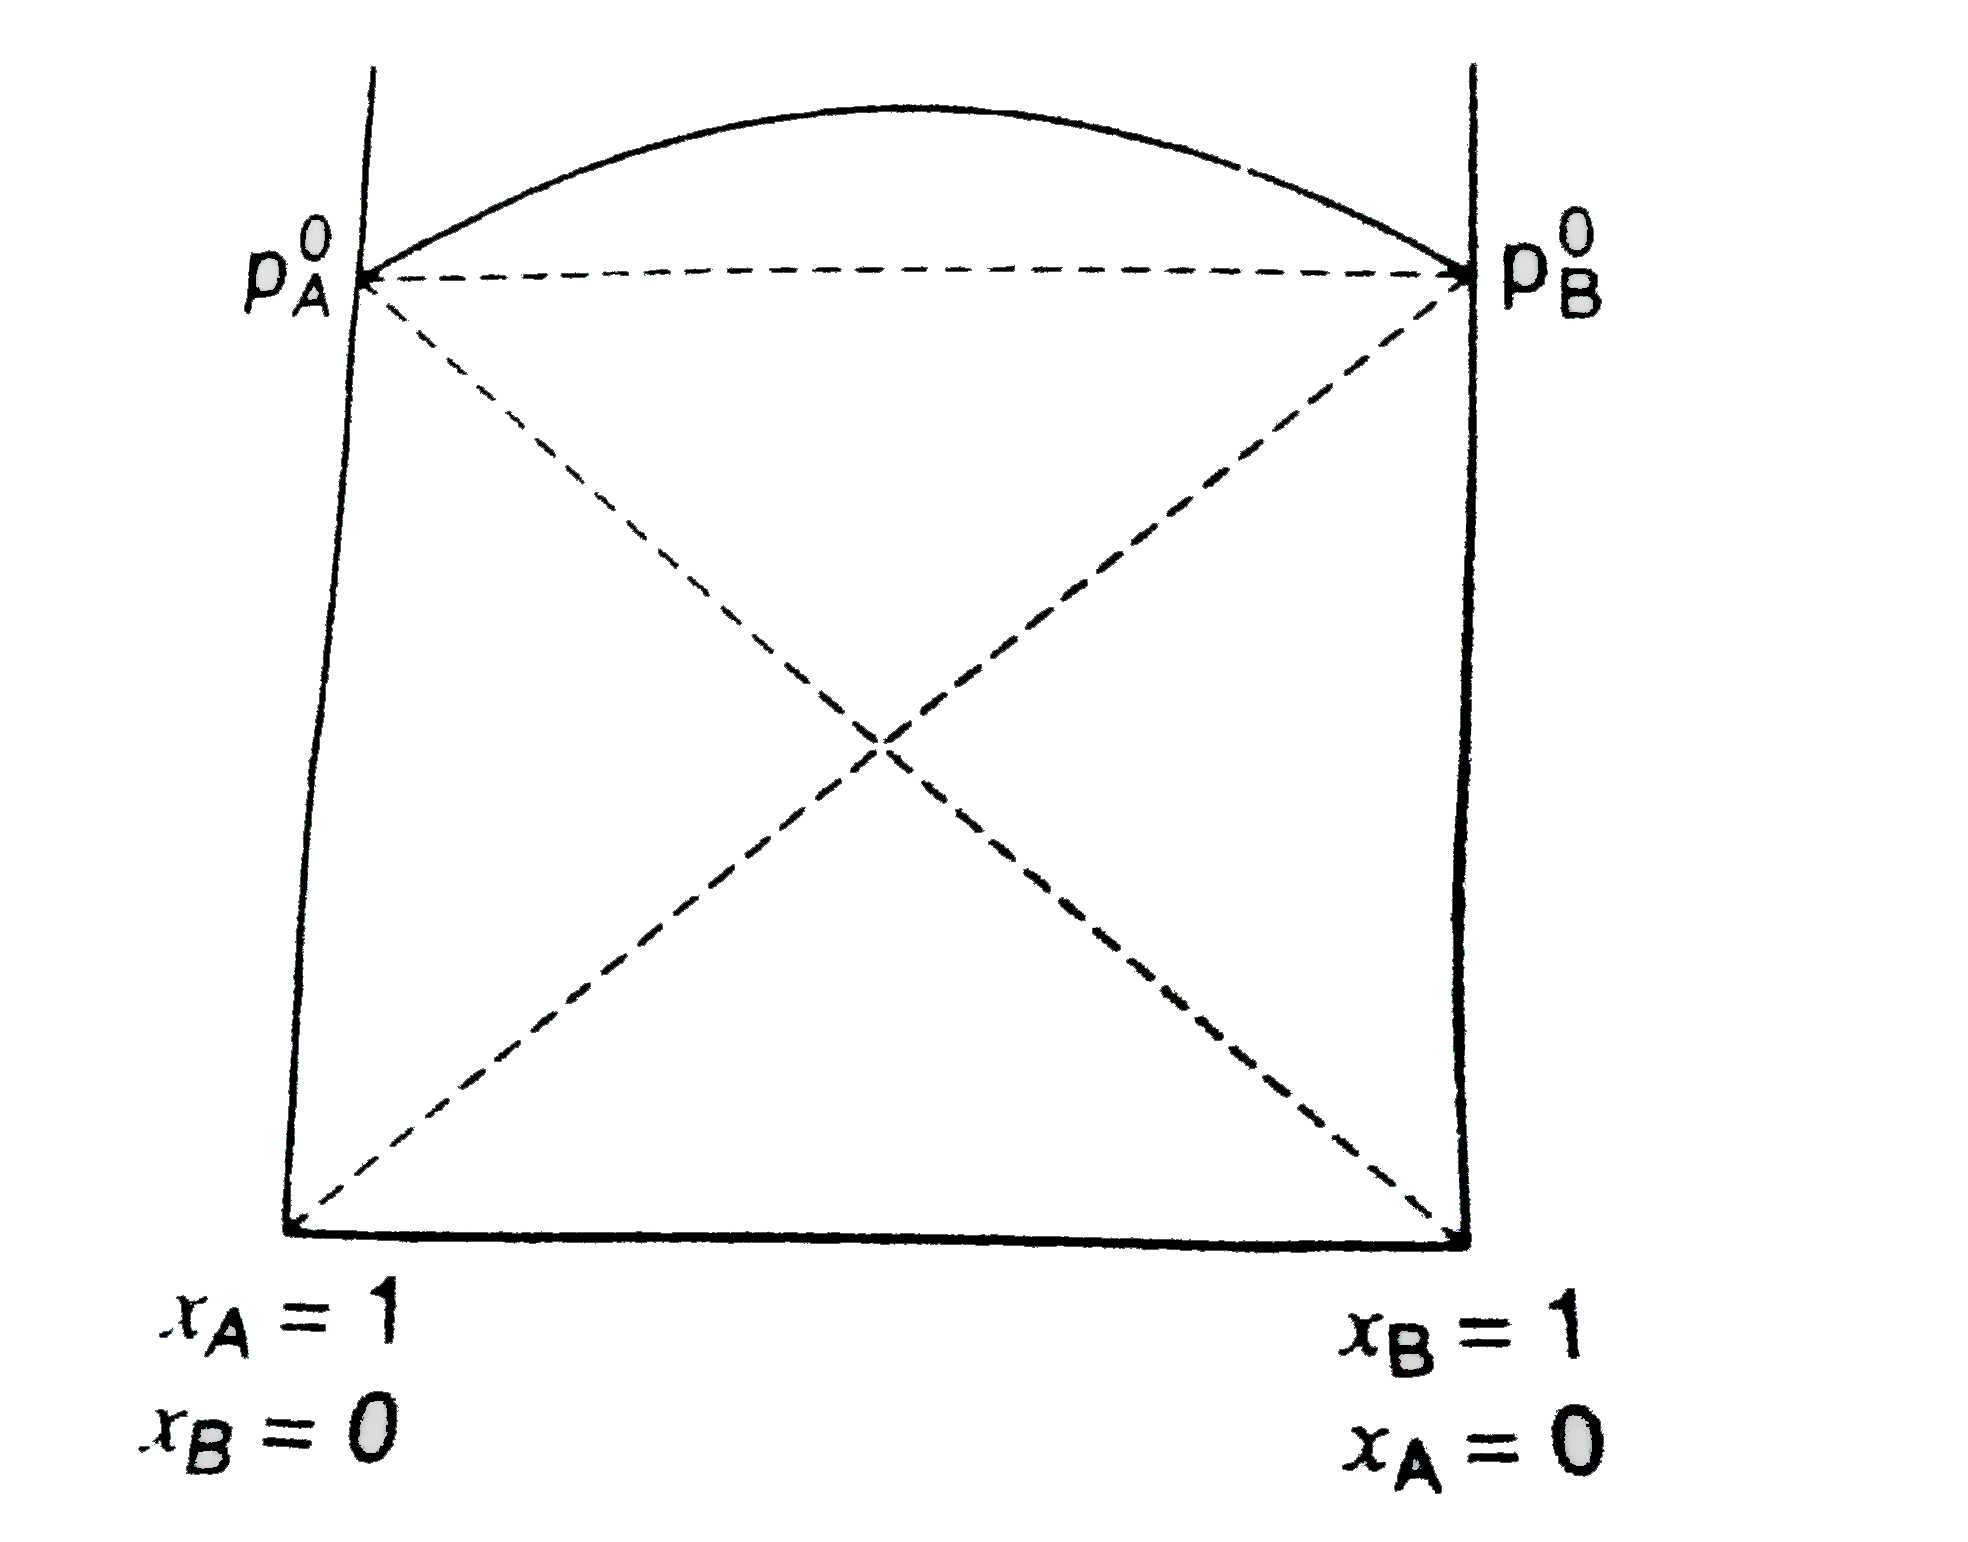
A
(+) deviation
B
(-) deviation
C
no deviation
D
none of these
Video Solution
Text Solution
The correct Answer is:A
|
Answer
Step by step video, text & image solution for The given graph indicates : by Chemistry experts to help you in doubts & scoring excellent marks in Class 11 exams.
Updated on:21/07/2023Topper's Solved these Questions
- SOLUTIONS (GENERAL AND COLLIGATIVE PROPERTIES)BOOK - OP TANDONCHAPTER - SOLUTIONS (GENERAL AND COLLIGATIVE PROPERTIES)EXERCISE - Level-B
53 Videos
- SOLUTIONS (GENERAL AND COLLIGATIVE PROPERTIES)BOOK - OP TANDONCHAPTER - SOLUTIONS (GENERAL AND COLLIGATIVE PROPERTIES)EXERCISE - Assertion-Reason
18 Videos
- SOLUTIONS (GENERAL AND COLLIGATIVE PROPERTIES)BOOK - OP TANDONCHAPTER - SOLUTIONS (GENERAL AND COLLIGATIVE PROPERTIES)EXERCISE - Set-1 (Level-A)
190 Videos
- PROBLEMS BASED UPON STRUCTURES AND REACTIONS OF ORGANIC COMPOUNDS BOOK - OP TANDONCHAPTER - PROBLEMS BASED UPON STRUCTURES AND REACTIONS OF ORGANIC COMPOUNDS EXERCISE - Some Solved Problems
21 Videos
- STATES OF MATTER (GASES AND LIQUIDS)BOOK - OP TANDONCHAPTER - STATES OF MATTER (GASES AND LIQUIDS)EXERCISE - Self Assess,ent
28 Videos
Similar Questions
Knowledge Check
the graph given in Fig.9.36 shows the effect of substrate concentration on the rate of reaction of the enzyme green-gram -phosphatase . What does the graph indicates ?
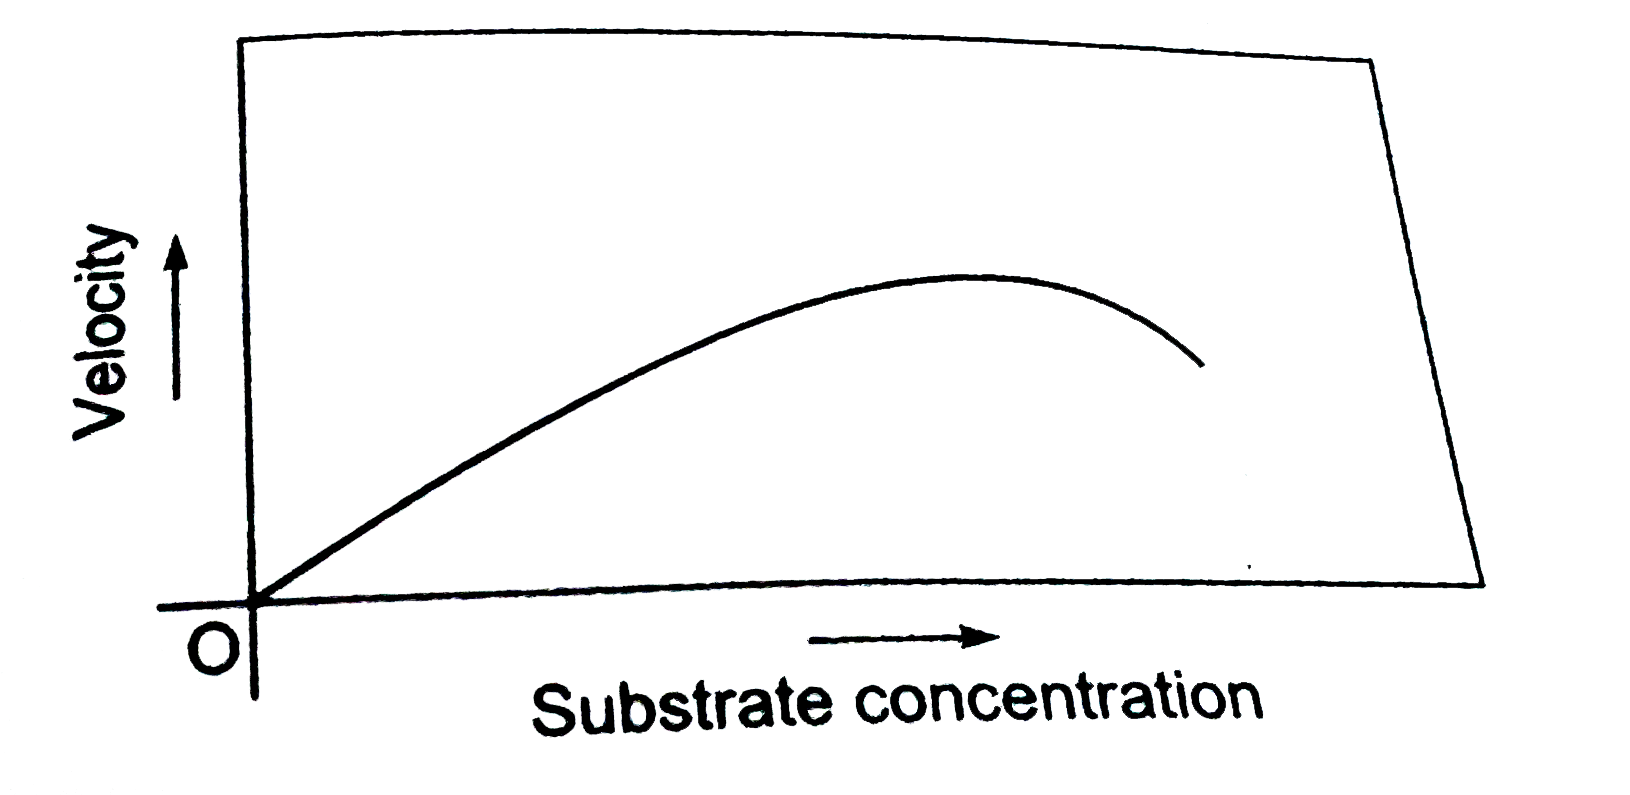 Athe rate of enzyme reaction is directly proportional to the substrate concentrationBPresence of an enzyme inhibitor in the reaction mixture .CFormation of an anzyme-substrate complex.DAt higher substrate concentration , the pH increases H+cone⏐↓
The Figure-1.109 shows the displacement-time graph ofa body subject only to the force of gravity. This graph indicates that:
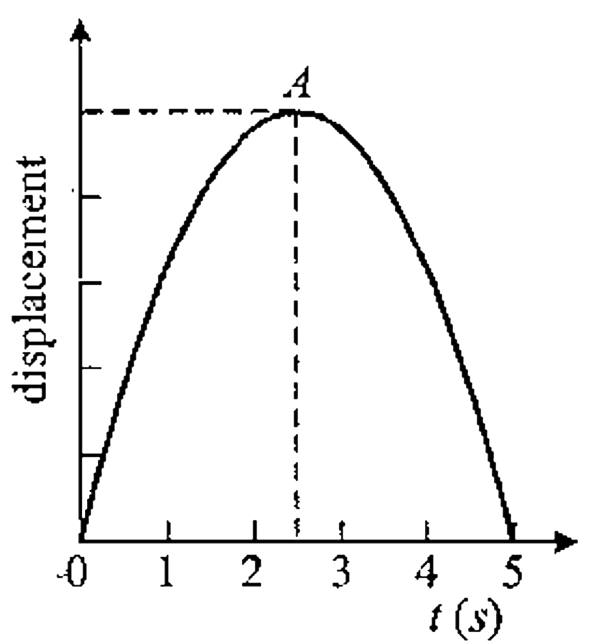 AAt A, the acceleration is zeroBAt A, the velocity is maximumCAt A, the displacement is zeroDThe acceleration is constant for all times shown
The distance of a particle as a function of time is shown here. The graph indicates that
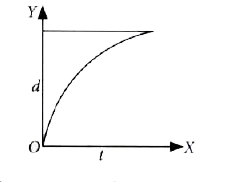 Athe particle starts with certain velocity but the motion is retarded and finally the particle stops.Bthe velocity of the particle is constant throughout.Cthe acceleration of the particle is constant throughout.Dthe particle starts with another constant velocity, the motion is in acceleration and finally the particle moves with another constant velocity.
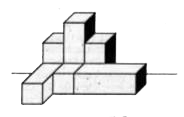
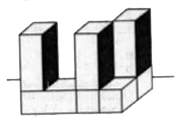
Please count the number of blocks in the given figure and indicate:
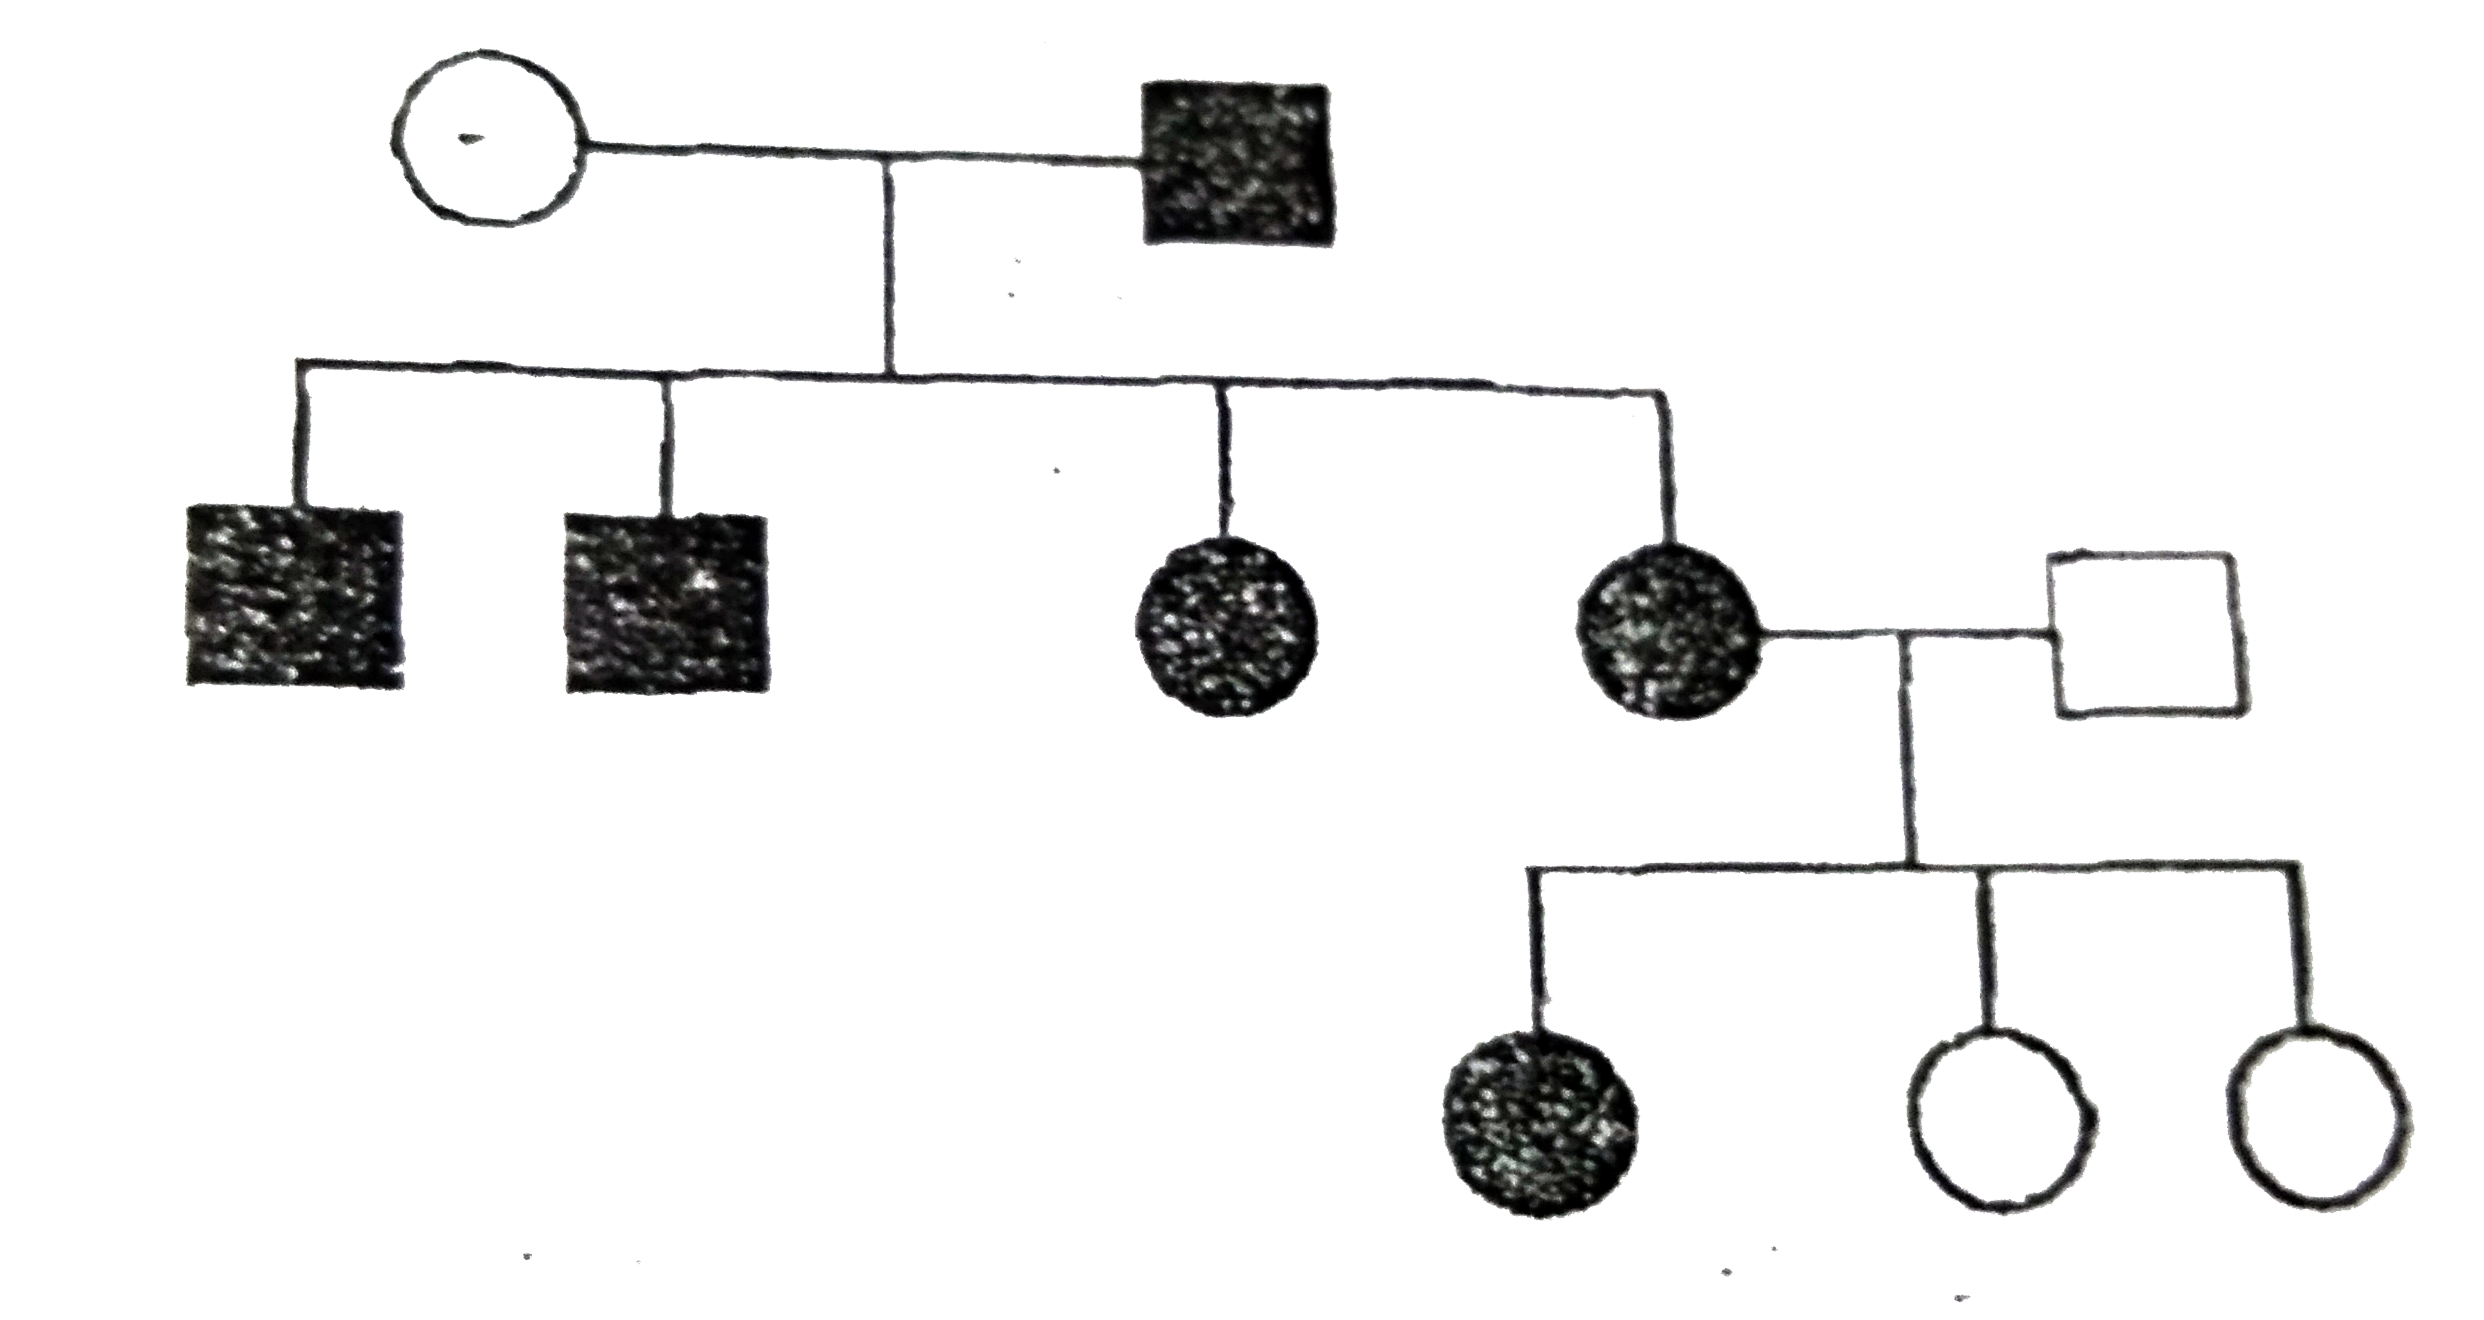
View SolutionIn the given pedigree, indicate whether the shaded symbols indicate dominant or recessive allele.
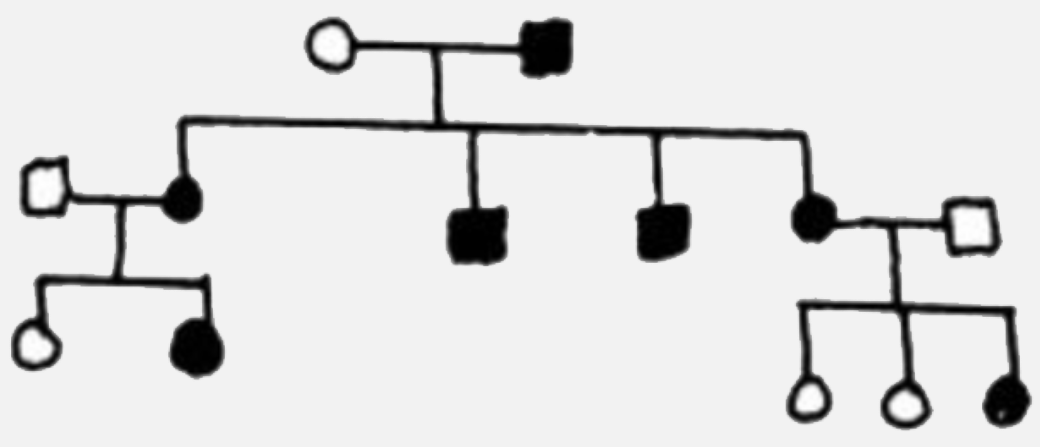
View SolutionIn the given pedigree, indicate whether the shaded symbols indicate dominant or recessive allele.
View SolutionPlease count the number of blocks in the given figure and indicate.
View SolutionWhat does the slope of a speed-time graph indicate ?
View Solution


