If m1,m2 are masses of an ideal gas, then which of the graph represents m2>m1 ?.
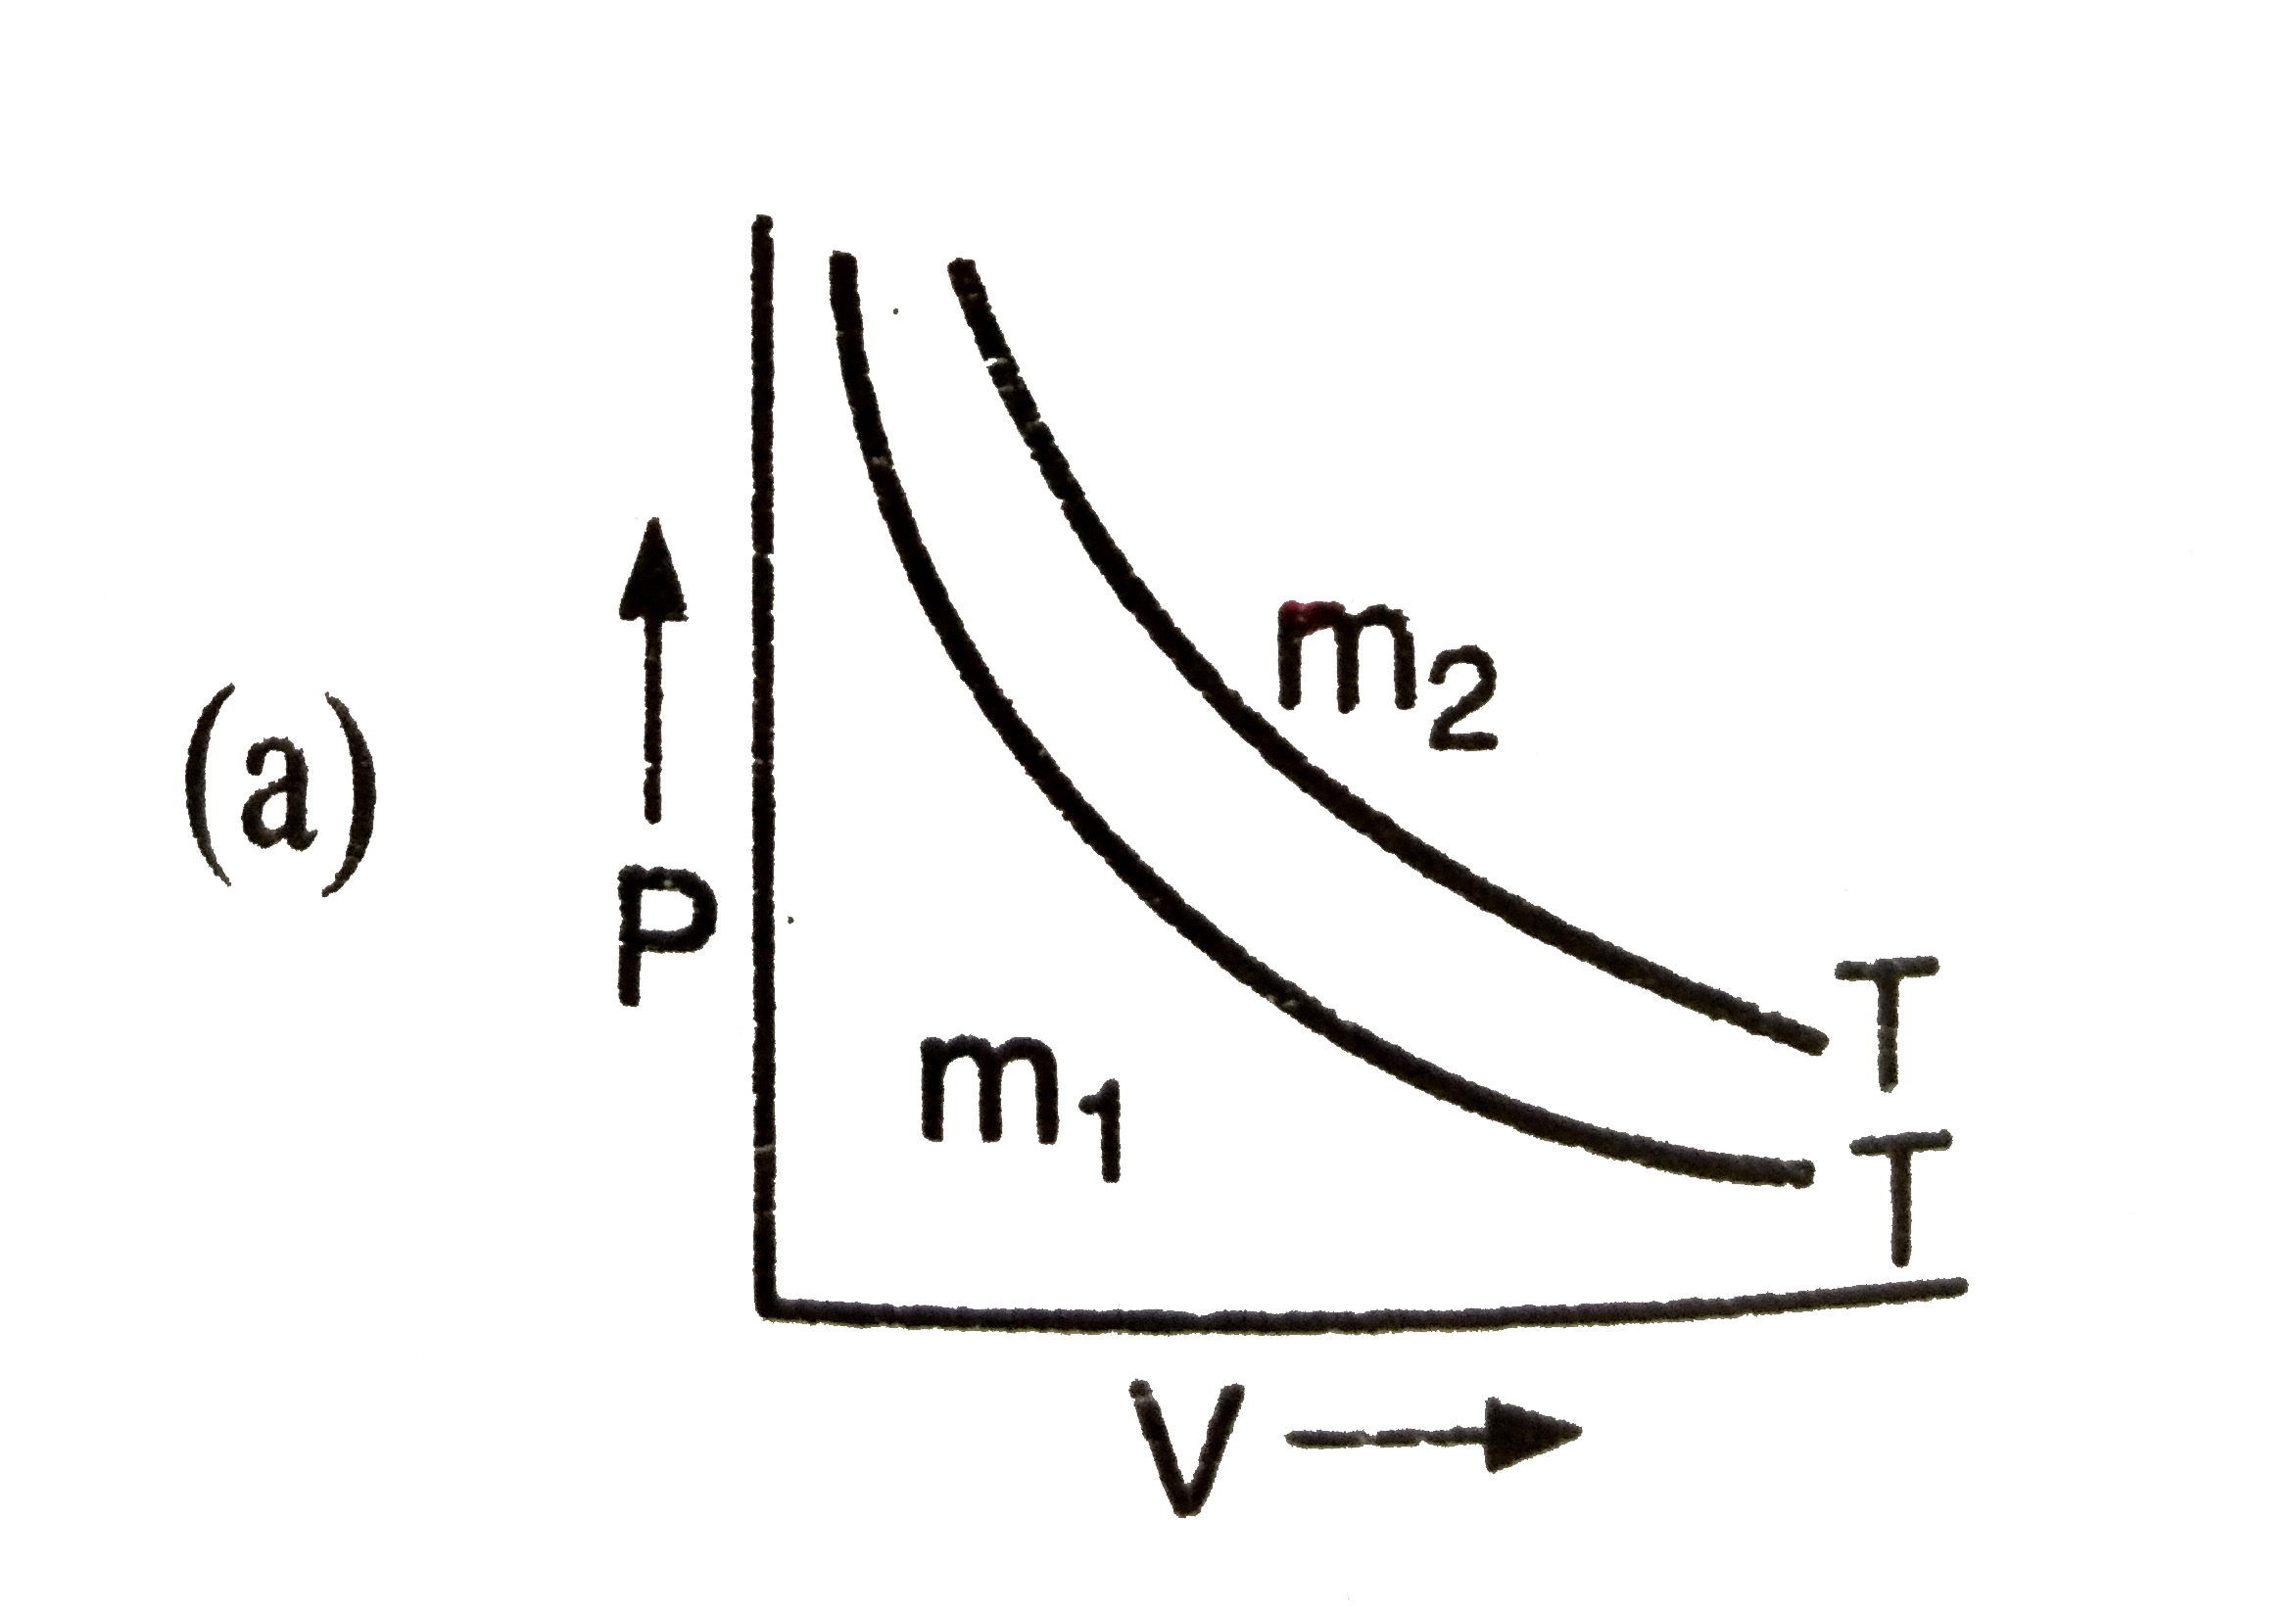
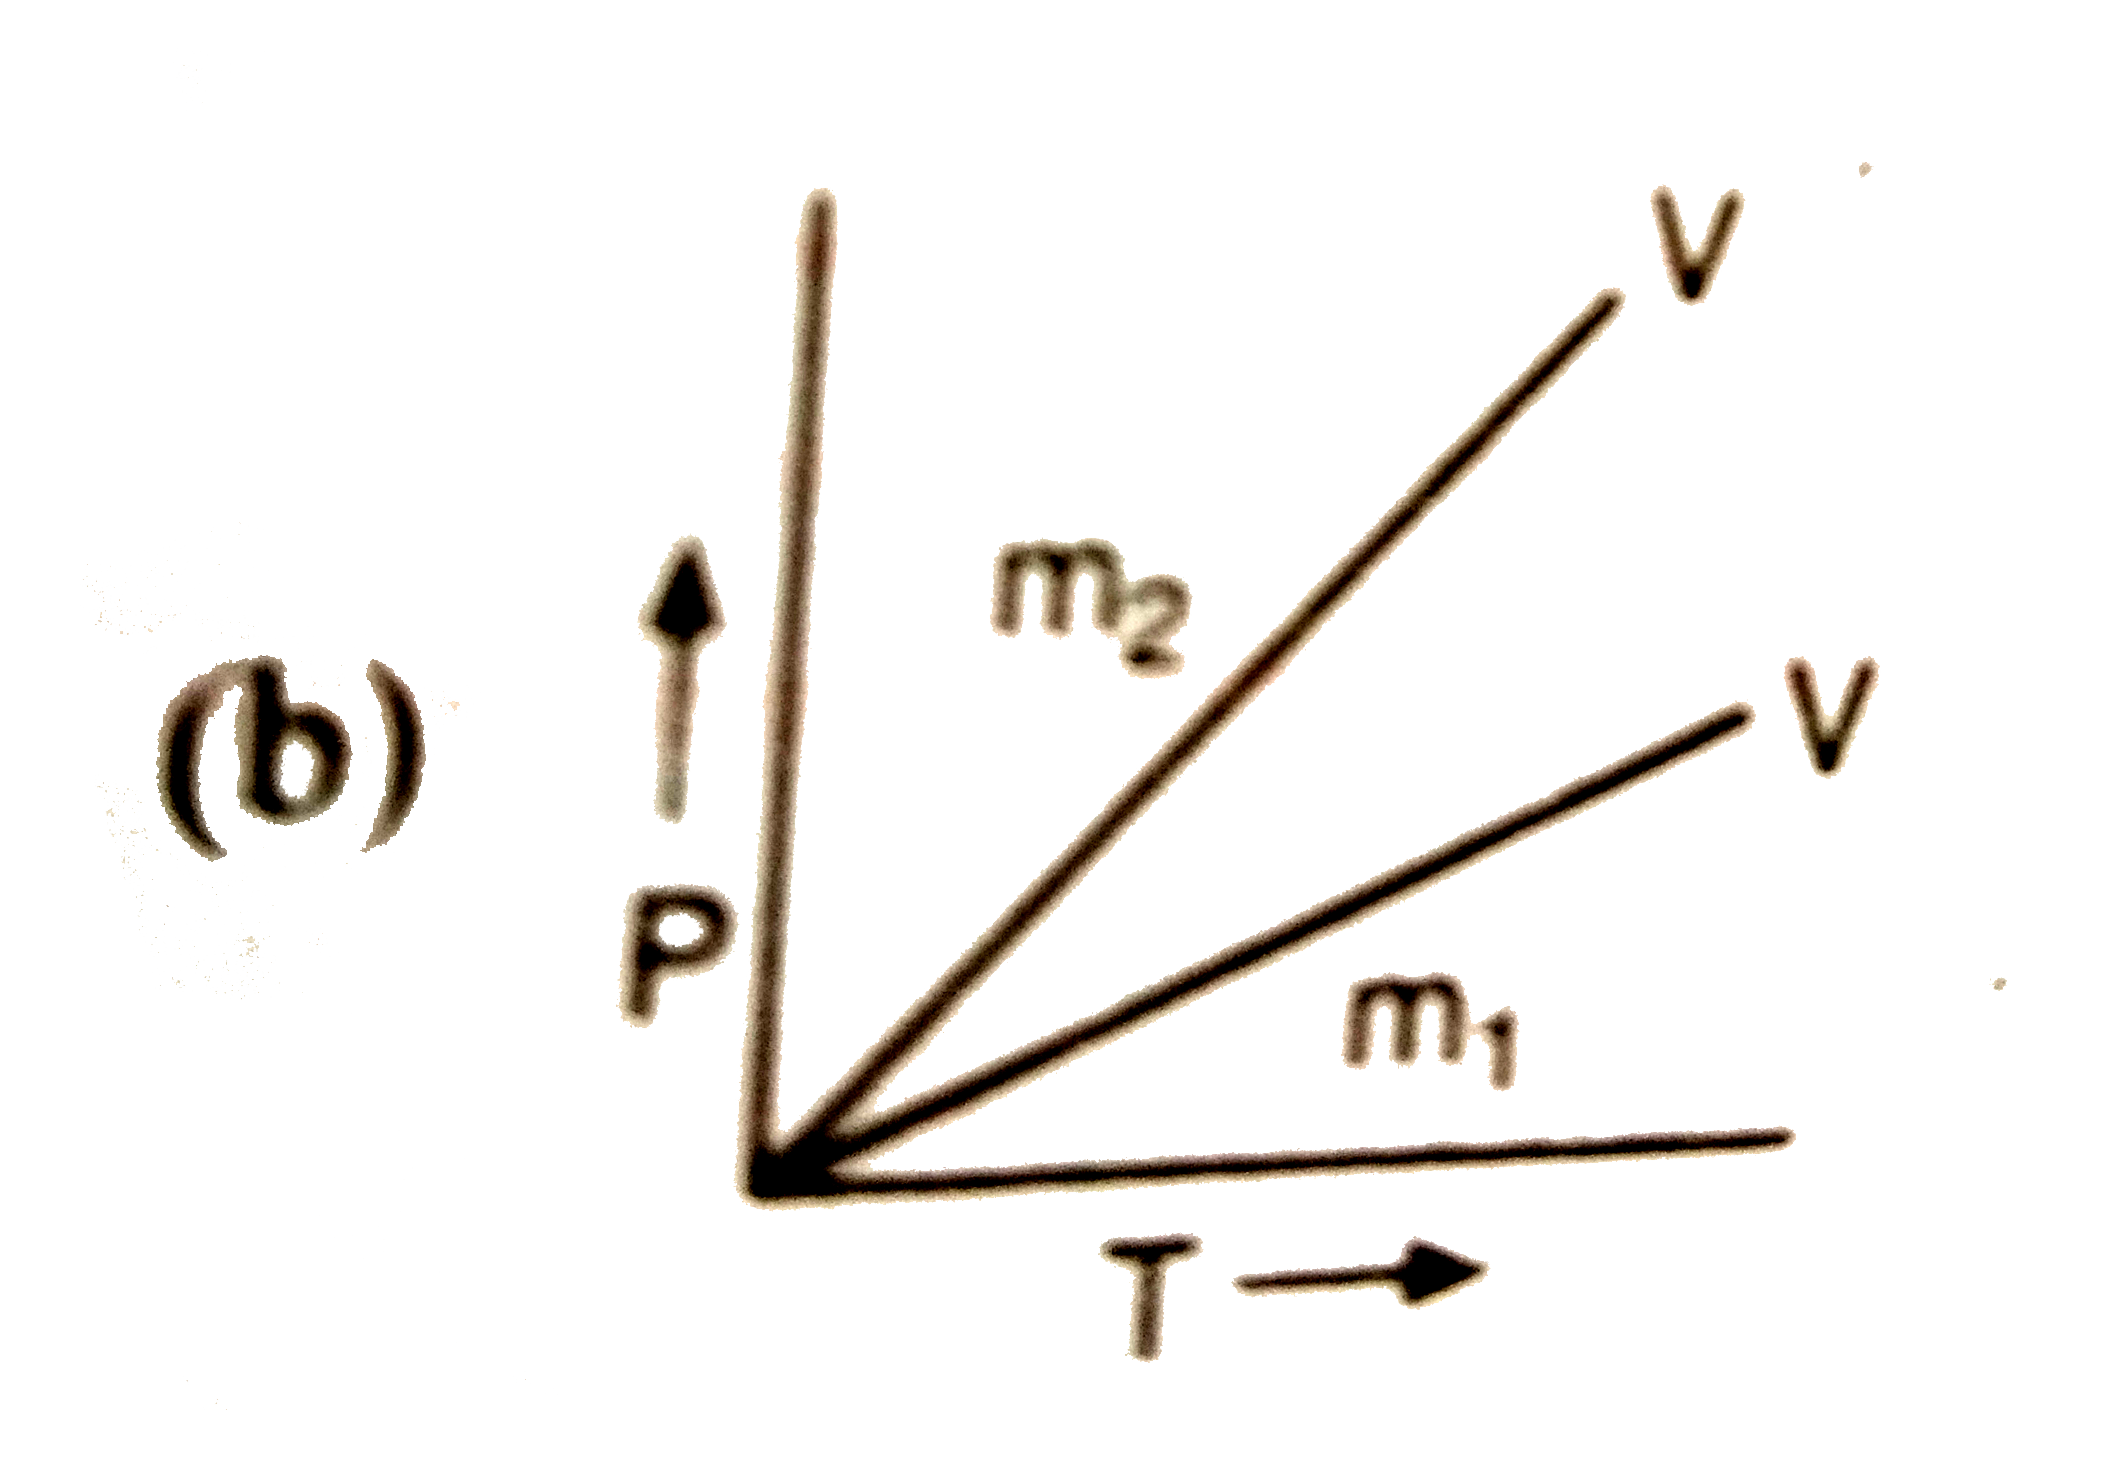
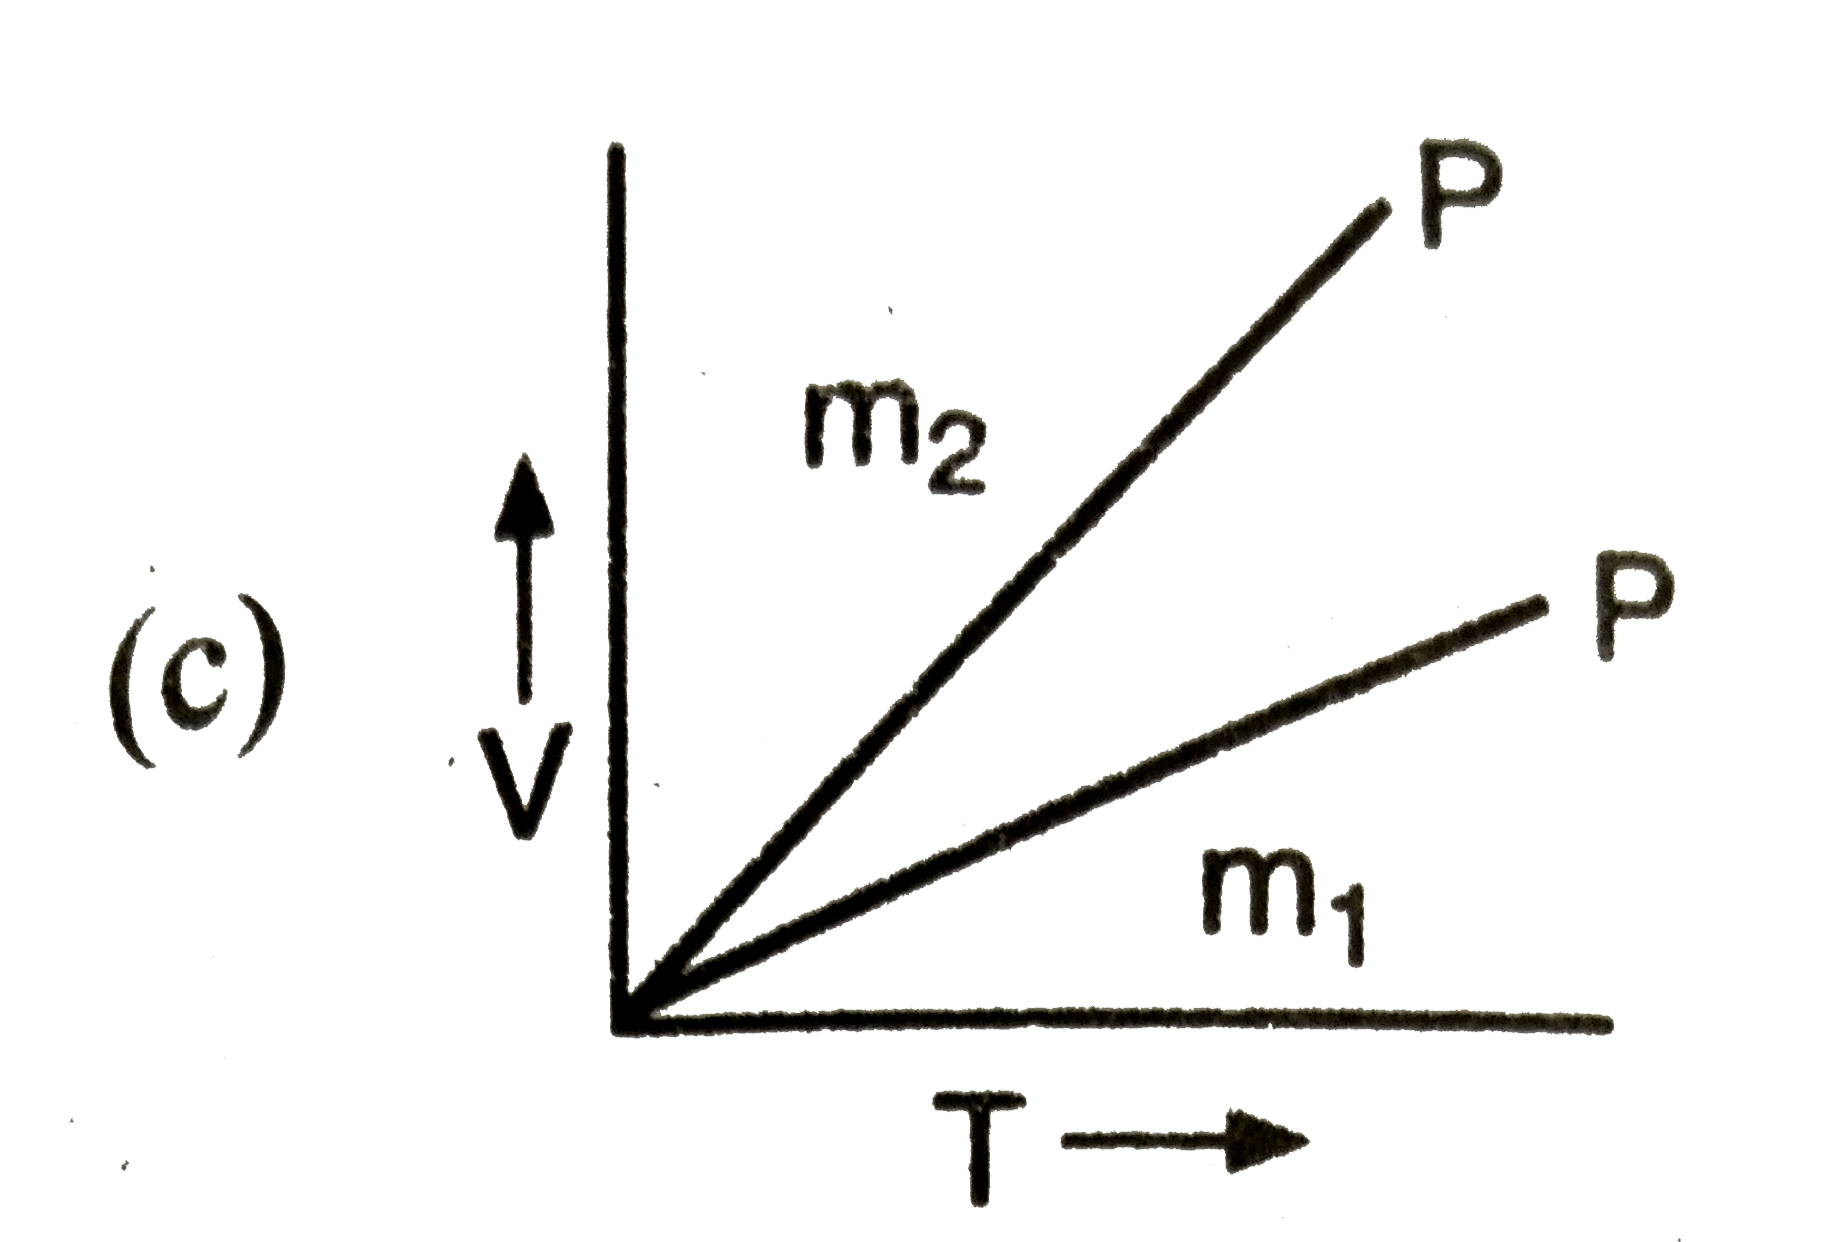
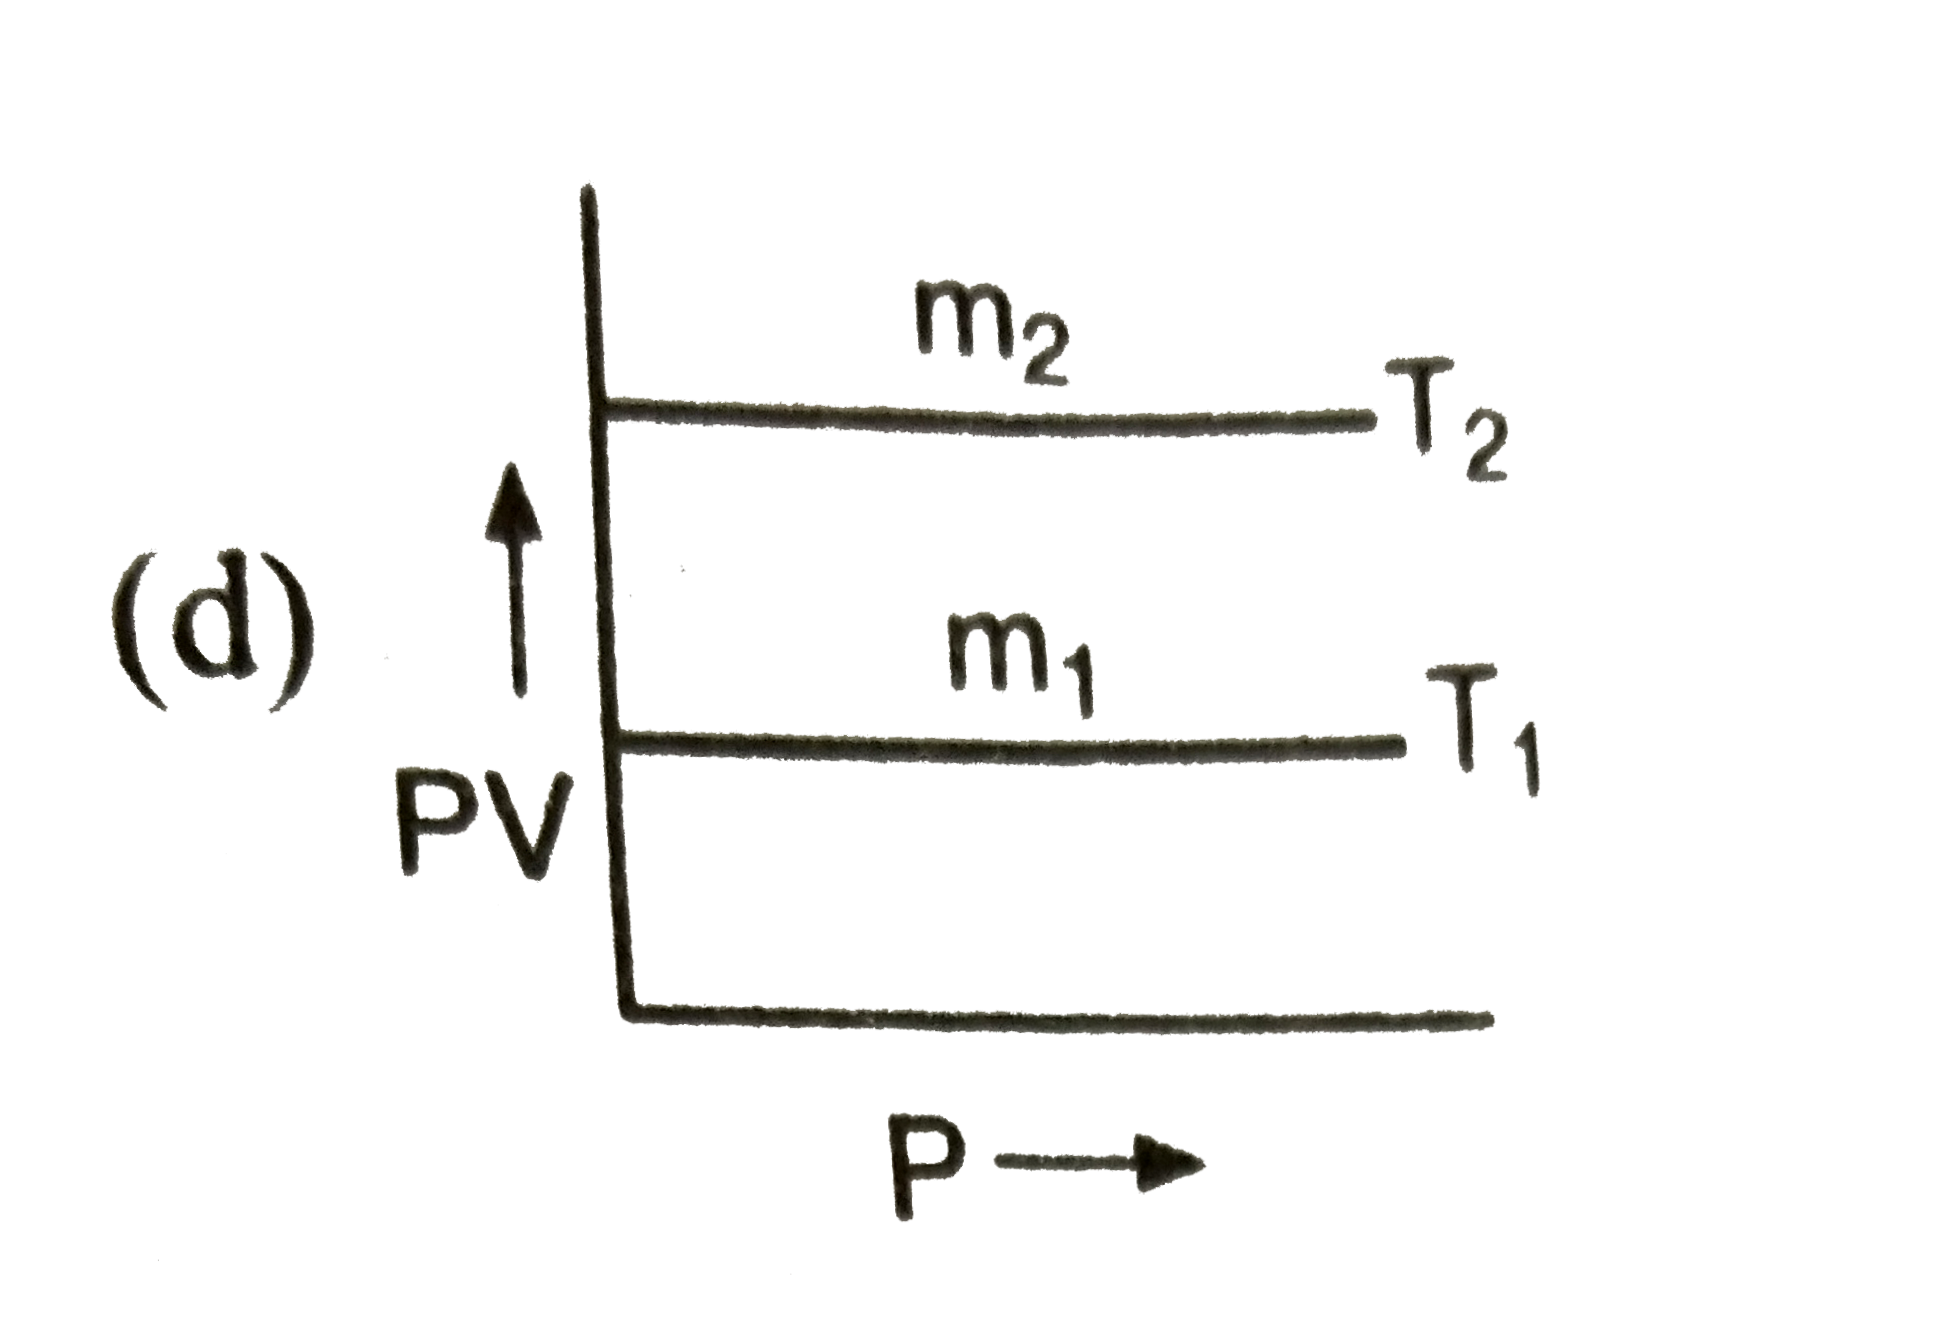
The correct Answer is:A, B, C
Step by step video, text & image solution for If m_(1),m_(2) are masses of an ideal gas, then which of the graph represents m_(2)gtm_(1) ?. by Chemistry experts to help you in doubts & scoring excellent marks in Class 11 exams.
Updated on:21/07/2023Topper's Solved these Questions
- STATES OF MATTER (GASES AND LIQUIDS)BOOK - OP TANDONCHAPTER - STATES OF MATTER (GASES AND LIQUIDS)EXERCISE - Objective questions Level B
34 Videos
- STATES OF MATTER (GASES AND LIQUIDS)BOOK - OP TANDONCHAPTER - STATES OF MATTER (GASES AND LIQUIDS)EXERCISE - Assertion-Reason
10 Videos
- STATES OF MATTER (GASES AND LIQUIDS)BOOK - OP TANDONCHAPTER - STATES OF MATTER (GASES AND LIQUIDS)EXERCISE - Objective questions
105 Videos
- SOLUTIONS (GENERAL AND COLLIGATIVE PROPERTIES)BOOK - OP TANDONCHAPTER - SOLUTIONS (GENERAL AND COLLIGATIVE PROPERTIES)EXERCISE - Self Assessment
31 Videos
- STATES OF MATTER (SOLID STATE)BOOK - OP TANDONCHAPTER - STATES OF MATTER (SOLID STATE)EXERCISE - SELF ASSESSMENT Section VI
3 Videos
Similar Questions
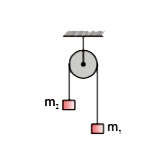
Two blocks of masses m1 and m2 are attached at the ends of an inextensible string which passes over a smooth massless pulley. If m1>m2, find :
(i) the acceleration of each block
(ii) the tension in the string.
View SolutionTwo masses m1 and m2(m1<m2) are positioned as shown in figure,m1 being on the ground and m2 at a height h above the ground.When m2 is released, the speed at which it hits the ground will be
View Solution
Knowledge Check
If m1,m2 are masses of an ideal gas, then which of the graph repersents m2>m1 ?.
A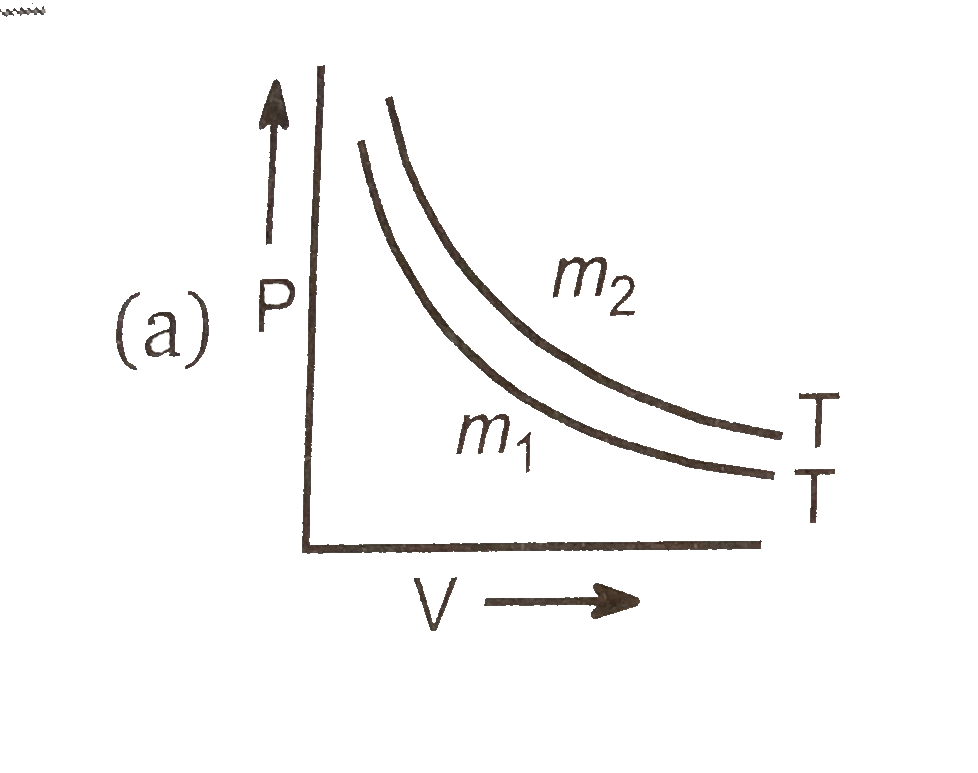 B
B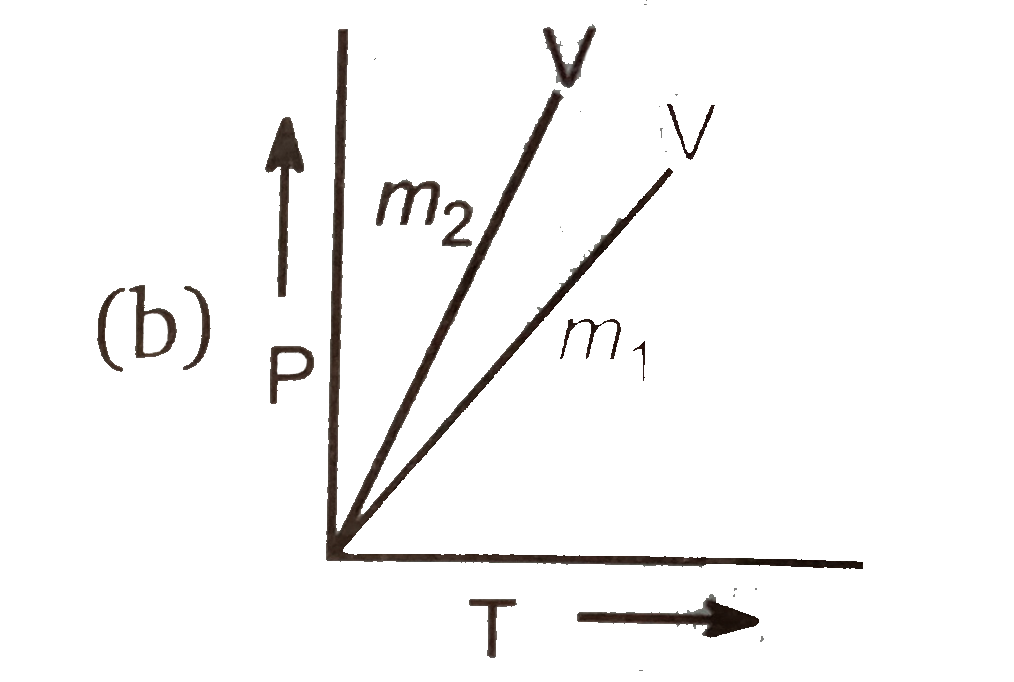 C
C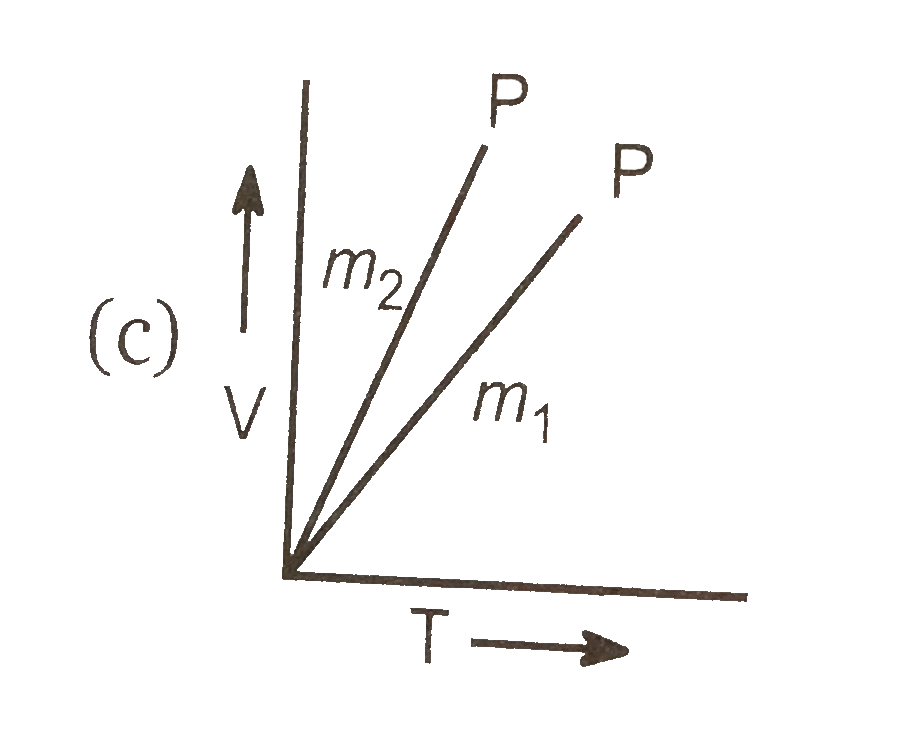 D
D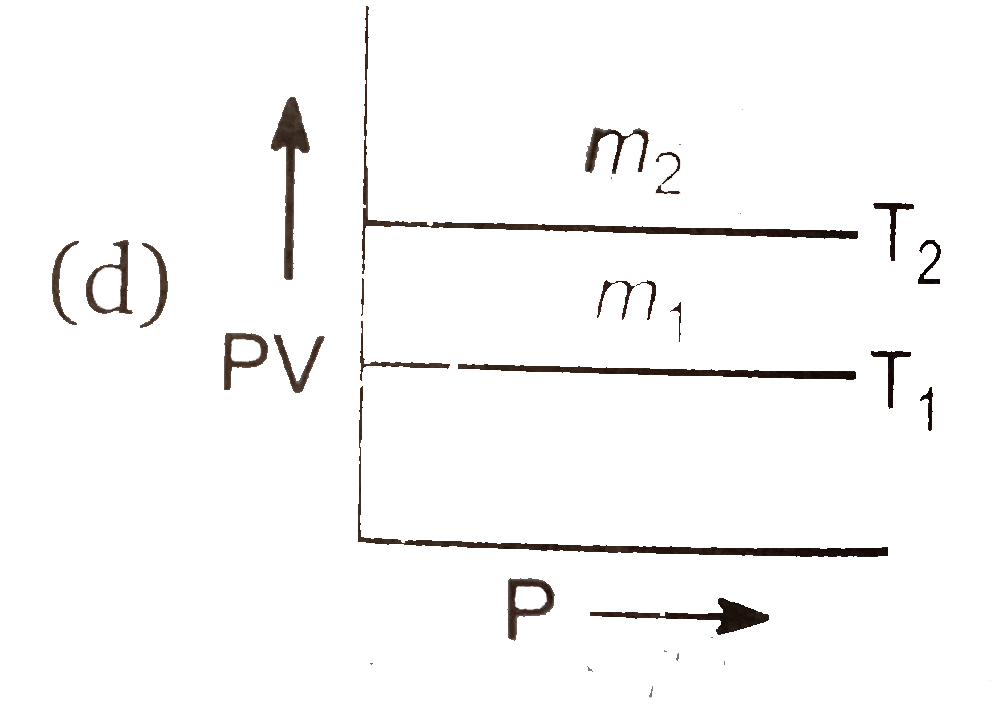
If m1 and m2 are masses of two reactants in any reaction, having their gram equivalent masses E1 and E2 respectively, which of the following equatios represents the law of equivence correctly?
AmE_=m2E2Bm1m1=E1ECm1E2=m2E1D√m1/E1=√m2/E2Two identical constaners A and B having same volume of an ideal gas at same temperature hace mass of the gas as m1 and m2 respectively and 2m1=3m2. The gas in each cylinder expands isomthermally to double of its voume. If change in pressure in A is 300Pa, then the change in pressure in B is
A200PaB300PaC400PaD500Pa
Plot a graph showing variation of de-broglie wavelength λ versus 1/√V, where V is accelerating potential for two particle A and P carrying same charge but of masses m1andm2(m1>m2). Which one of the two represents a particle of smaller mass and why?
View SolutionTwo masses m1 and m2 are attached to a spring balance S as shown in figure. m1>m2 then the reading of spring balance will be .
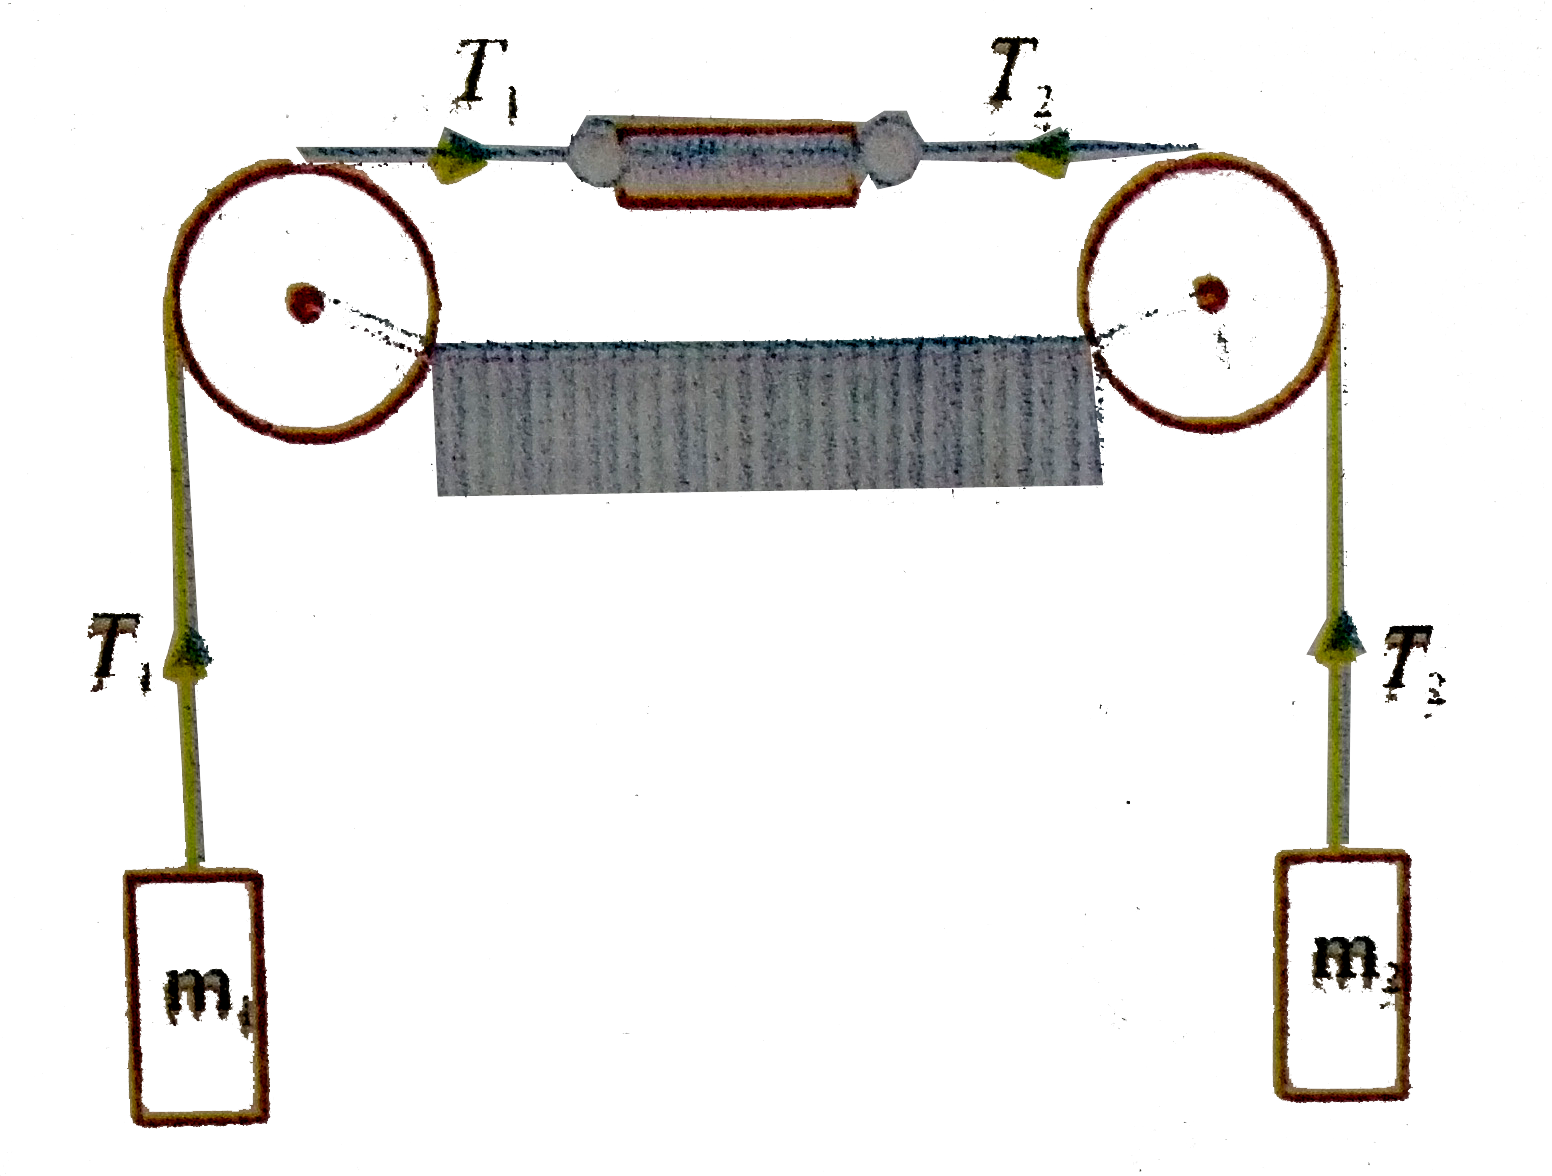 .
.
View SolutionTwo masses m1 and m2 are attached to a spring balance S as shown in Figure. If m1>m2 then the reading of spring balance will be
View SolutionIf m1 and m2 are slopes of line represented 2x2−3xy+y2=0 , then (m1)3+(m2)3=
View SolutionCorrect expression for density of an ideal gas mixture of two gases 1 and 2, where m1 and m2 are masses and n1 and n2 are moles and M1 and M2 are molar masses.
View Solution
