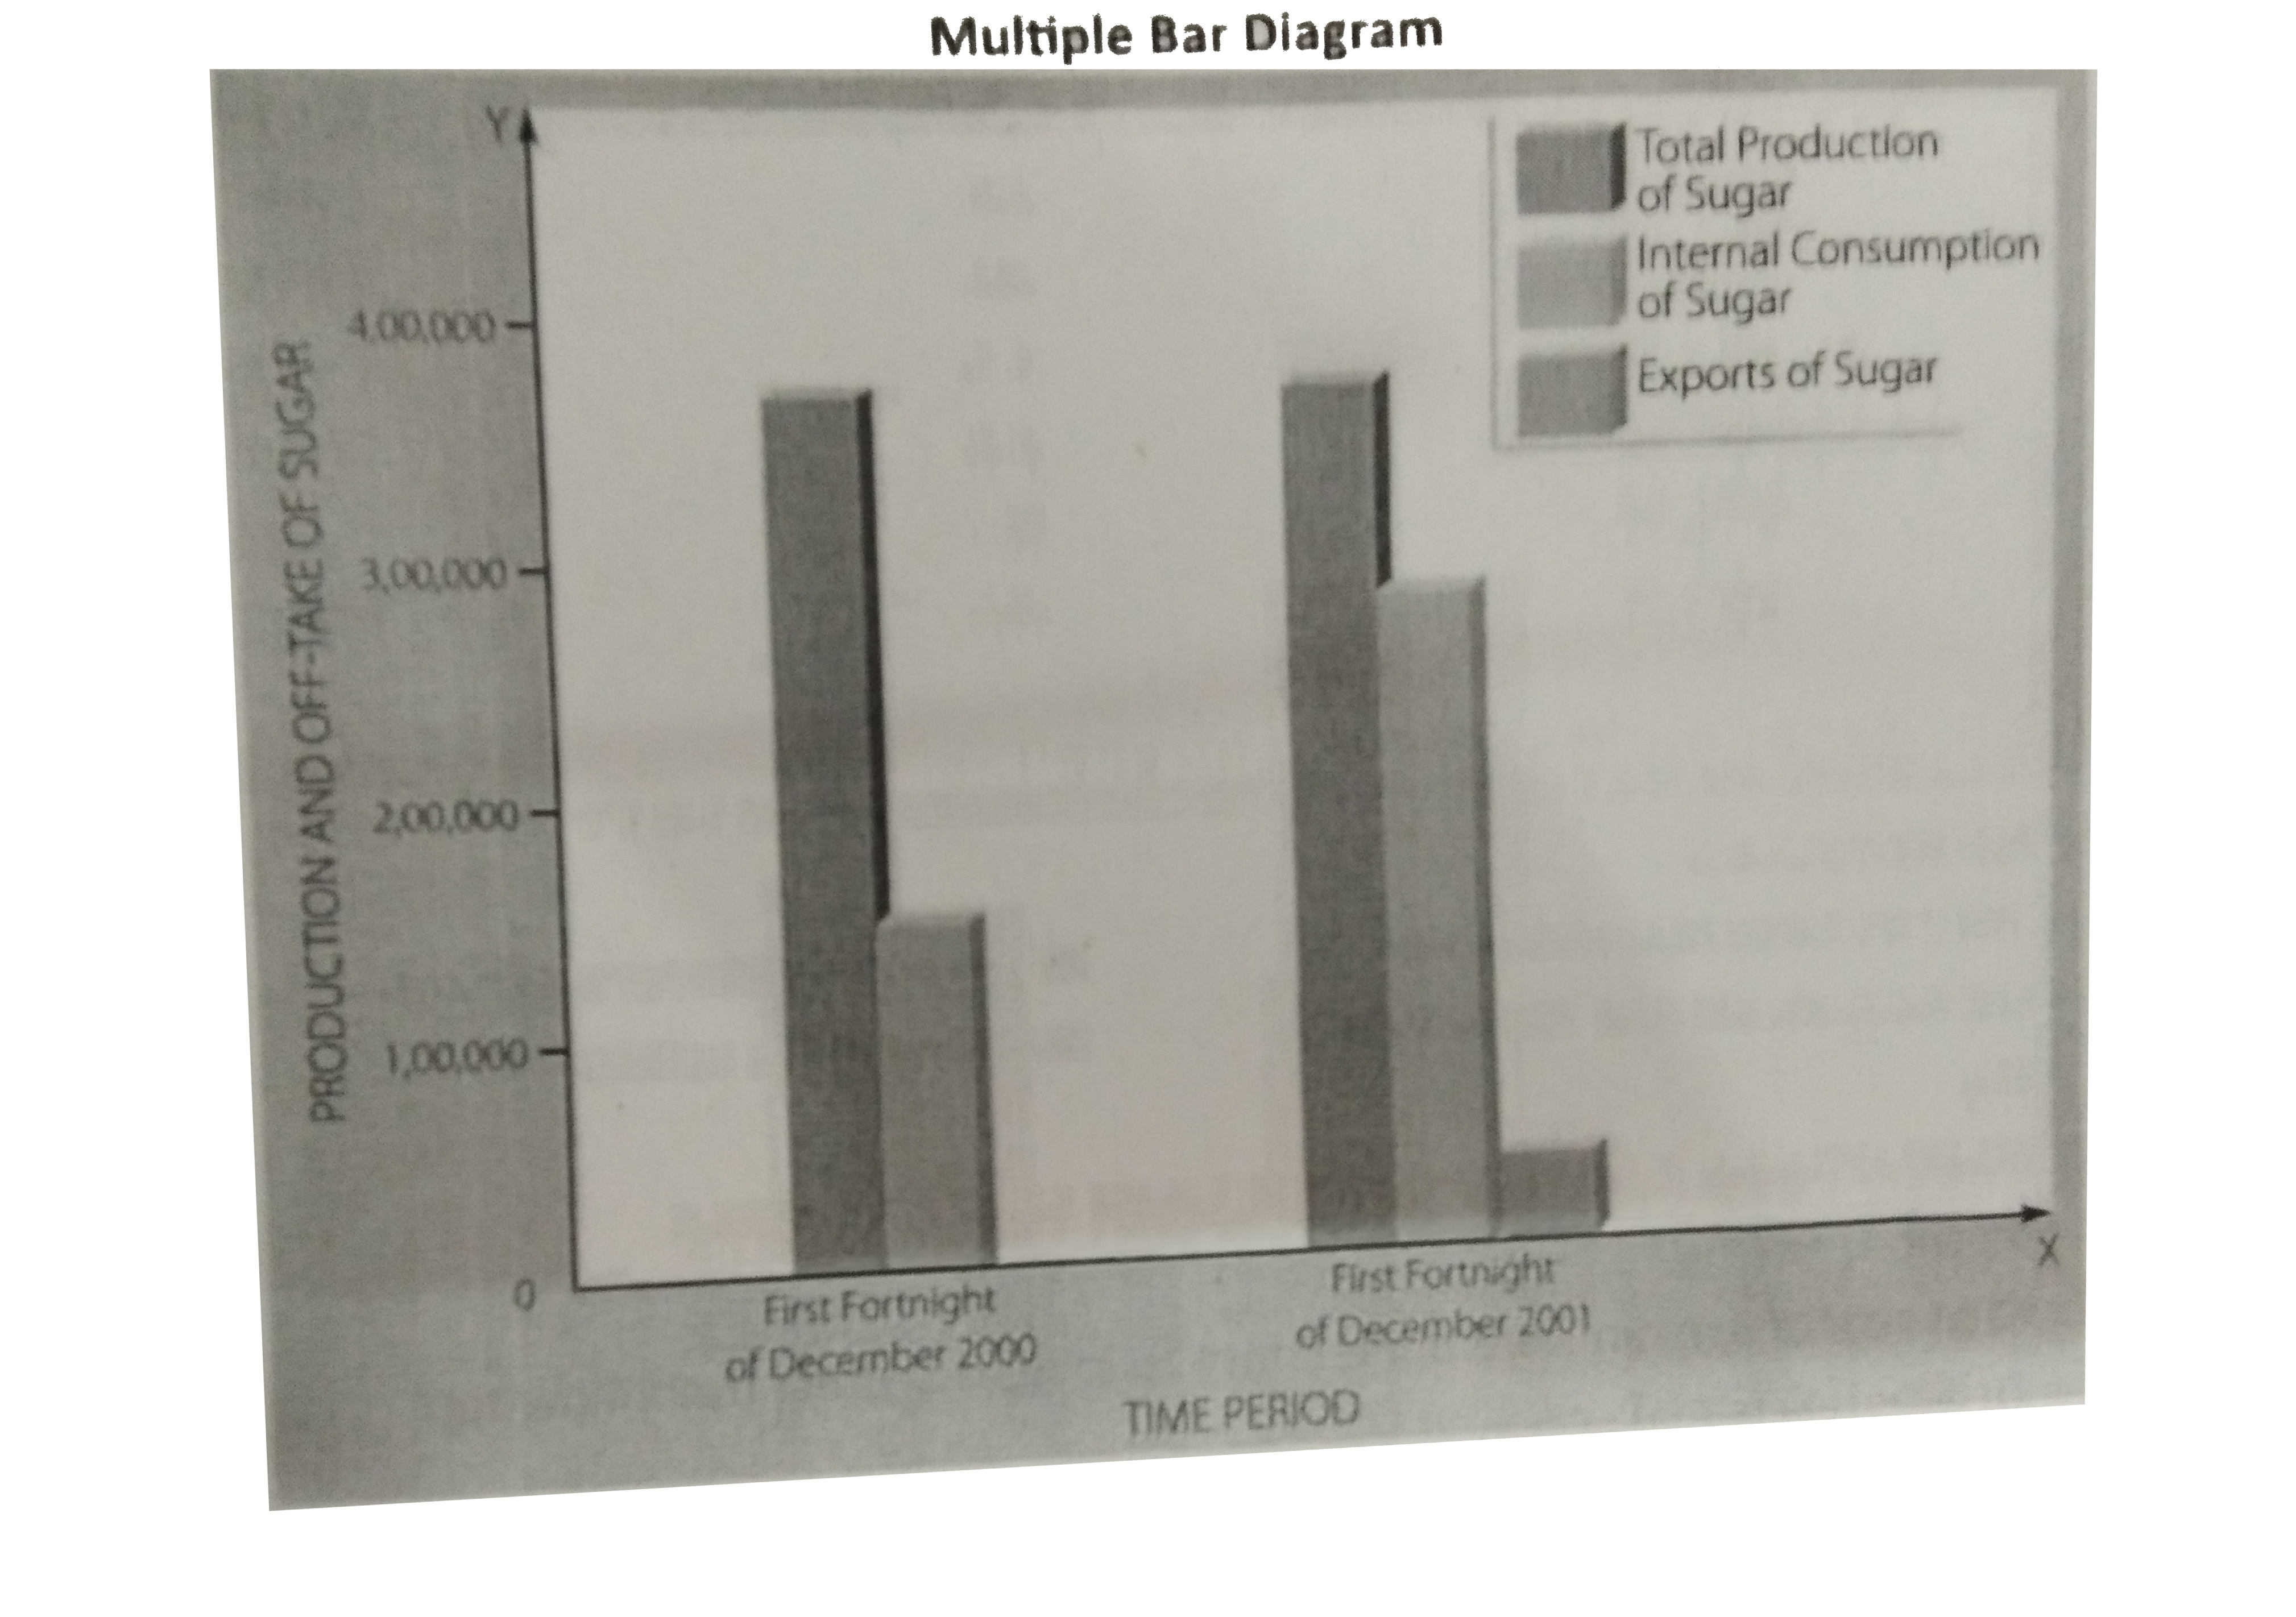
The indian sugar mills asocitation reproted that sugar productiion during the first fortnight of december 2001 was about 387000 tonnes as against 378000 tonnes during the same fortnight last year (2000).The off take of sugar from factories during the first fortnight of december 2001 was 28300 tonnes for internal consumption and 41000 tonnes for exprots as against 154000 tonnes for internal consumption and nil for exports during the same fortnight last season.
(i) present the data in tabular form
(ii) suppose you were to present these data in diagrammatic form which of the diagrams would you use and why?
(iii) Present these data diagrammatically


Step by step video & image solution for The indian sugar mills asocitation reproted that sugar productiion during the first fortnight of december 2001 was about 387000 tonnes as against 378000 tonnes during the same fortnight last year (2000).The off take of sugar from factories during the first fortnight of december 2001 was 28300 tonnes for internal consumption and 41000 tonnes for exprots as against 154000 tonnes for internal consumption and nil for exports during the same fortnight last season. (i) present the data in tabular form (ii) suppose you were to present these data in diagrammatic form which of the diagrams would you use and why? (iii) Present these data diagrammatically by Economics experts to help you in doubts & scoring excellent marks in Class 11 exams.
Related Playlists
- BOOK - TARUN JAIN & VK OHRICHAPTER - DIAGRAMMATIC PRESENTATION OF DATA BAR DIAGRAMS AND PIE DIAGRAMSEXERCISE - Long Answer Type Question10videos
DIAGRAMMATIC PRESENTATION OF DATA BAR DIAGRAMS AND PIE DIAGRAMS
- BOOK - TARUN JAIN & VK OHRICHAPTER - CORRELATIONEXERCISE - NCERT Questions (with Hints to Answers)10videos
CORRELATION
- BOOK - TARUN JAIN & VK OHRICHAPTER - FREQUENCY DIAGRAMS - HISTOGRAM, POLYGON AND OGIVEEXERCISE - EXERCISE NCERT7videos
FREQUENCY DIAGRAMS - HISTOGRAM, POLYGON AND OGIVE
Knowledge Check
- Question 1 - Select One
1 tonne is equal to
A1000 mgB1000 gC1000 kgD100 kg - Question 1 - Select One
FIND THE ERROR IN THE GIVEN SENTENCE AND CORRECT IT The terrorist was arrested for the first time in December, 2001.
Afor first timingBin the first timeCfor one timesDno improvement - Question 1 - Select One
She will finish the thesis in a fortnight.
AThe thesis would be finished in a fortnight by her.BThe thesis will finished by her in a fortnight.CThe thesis will be finished by her in a fortnight.DA fortnight is required to finish the thesis. - Question 1 - Select One
(A) Many vehicles met with accidents during the last fortnight at the major junction on the main arterial road in the city.
(B) The automatic signaling system at the major junction of the arterial road of the city was not waking well.Aif statement (A) is the cause and statement (B) is its effectBif statement (B) is the cause and statement (A) is its effectCif both the statements (A) and (B) are independent causesDif both the statements (A) and (B) are effects of independent causes - Question 1 - Select One
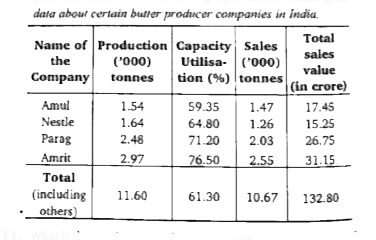
Answer the questions based on the following information, which gives data certain butter producer companies in India.

What is the approximate total production capacity (in '000 tonnes) for butter in India ?A7.8B18.9C11.6DData insufficient - Question 1 - Select One
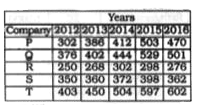
The table given below shows the production (in 1000 tonnes) of five companies from 2012 to 2016.

what is the average (in 1000 tonnes) of total production by all companies in the year 2013?A371.1B373.2C378.4D362.3 - Question 1 - Select One
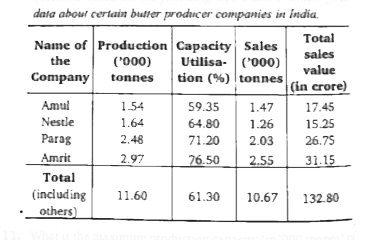
Answer the questions based on the following information, which gives data certain butter producer companies in India.

What is the maximum production capacity (in '000 tonnes) of Nestle for Butter ?A2.53B2.07C2.84D2.97
Similar Questions
Find the weight of a body of mass 1 tonn
View SolutionOut of total production of 6450 tonnes of a coalmine a quantity of 645 tonnes was lost during extraction. What per cent of the total production was the net coal extracted ?
View Solutionout of Total production of 6450 tonnes of coal mine A quantity of 645 tonnes was lost during extraction what percentage of the total production was the net coal extracted
View Solution

