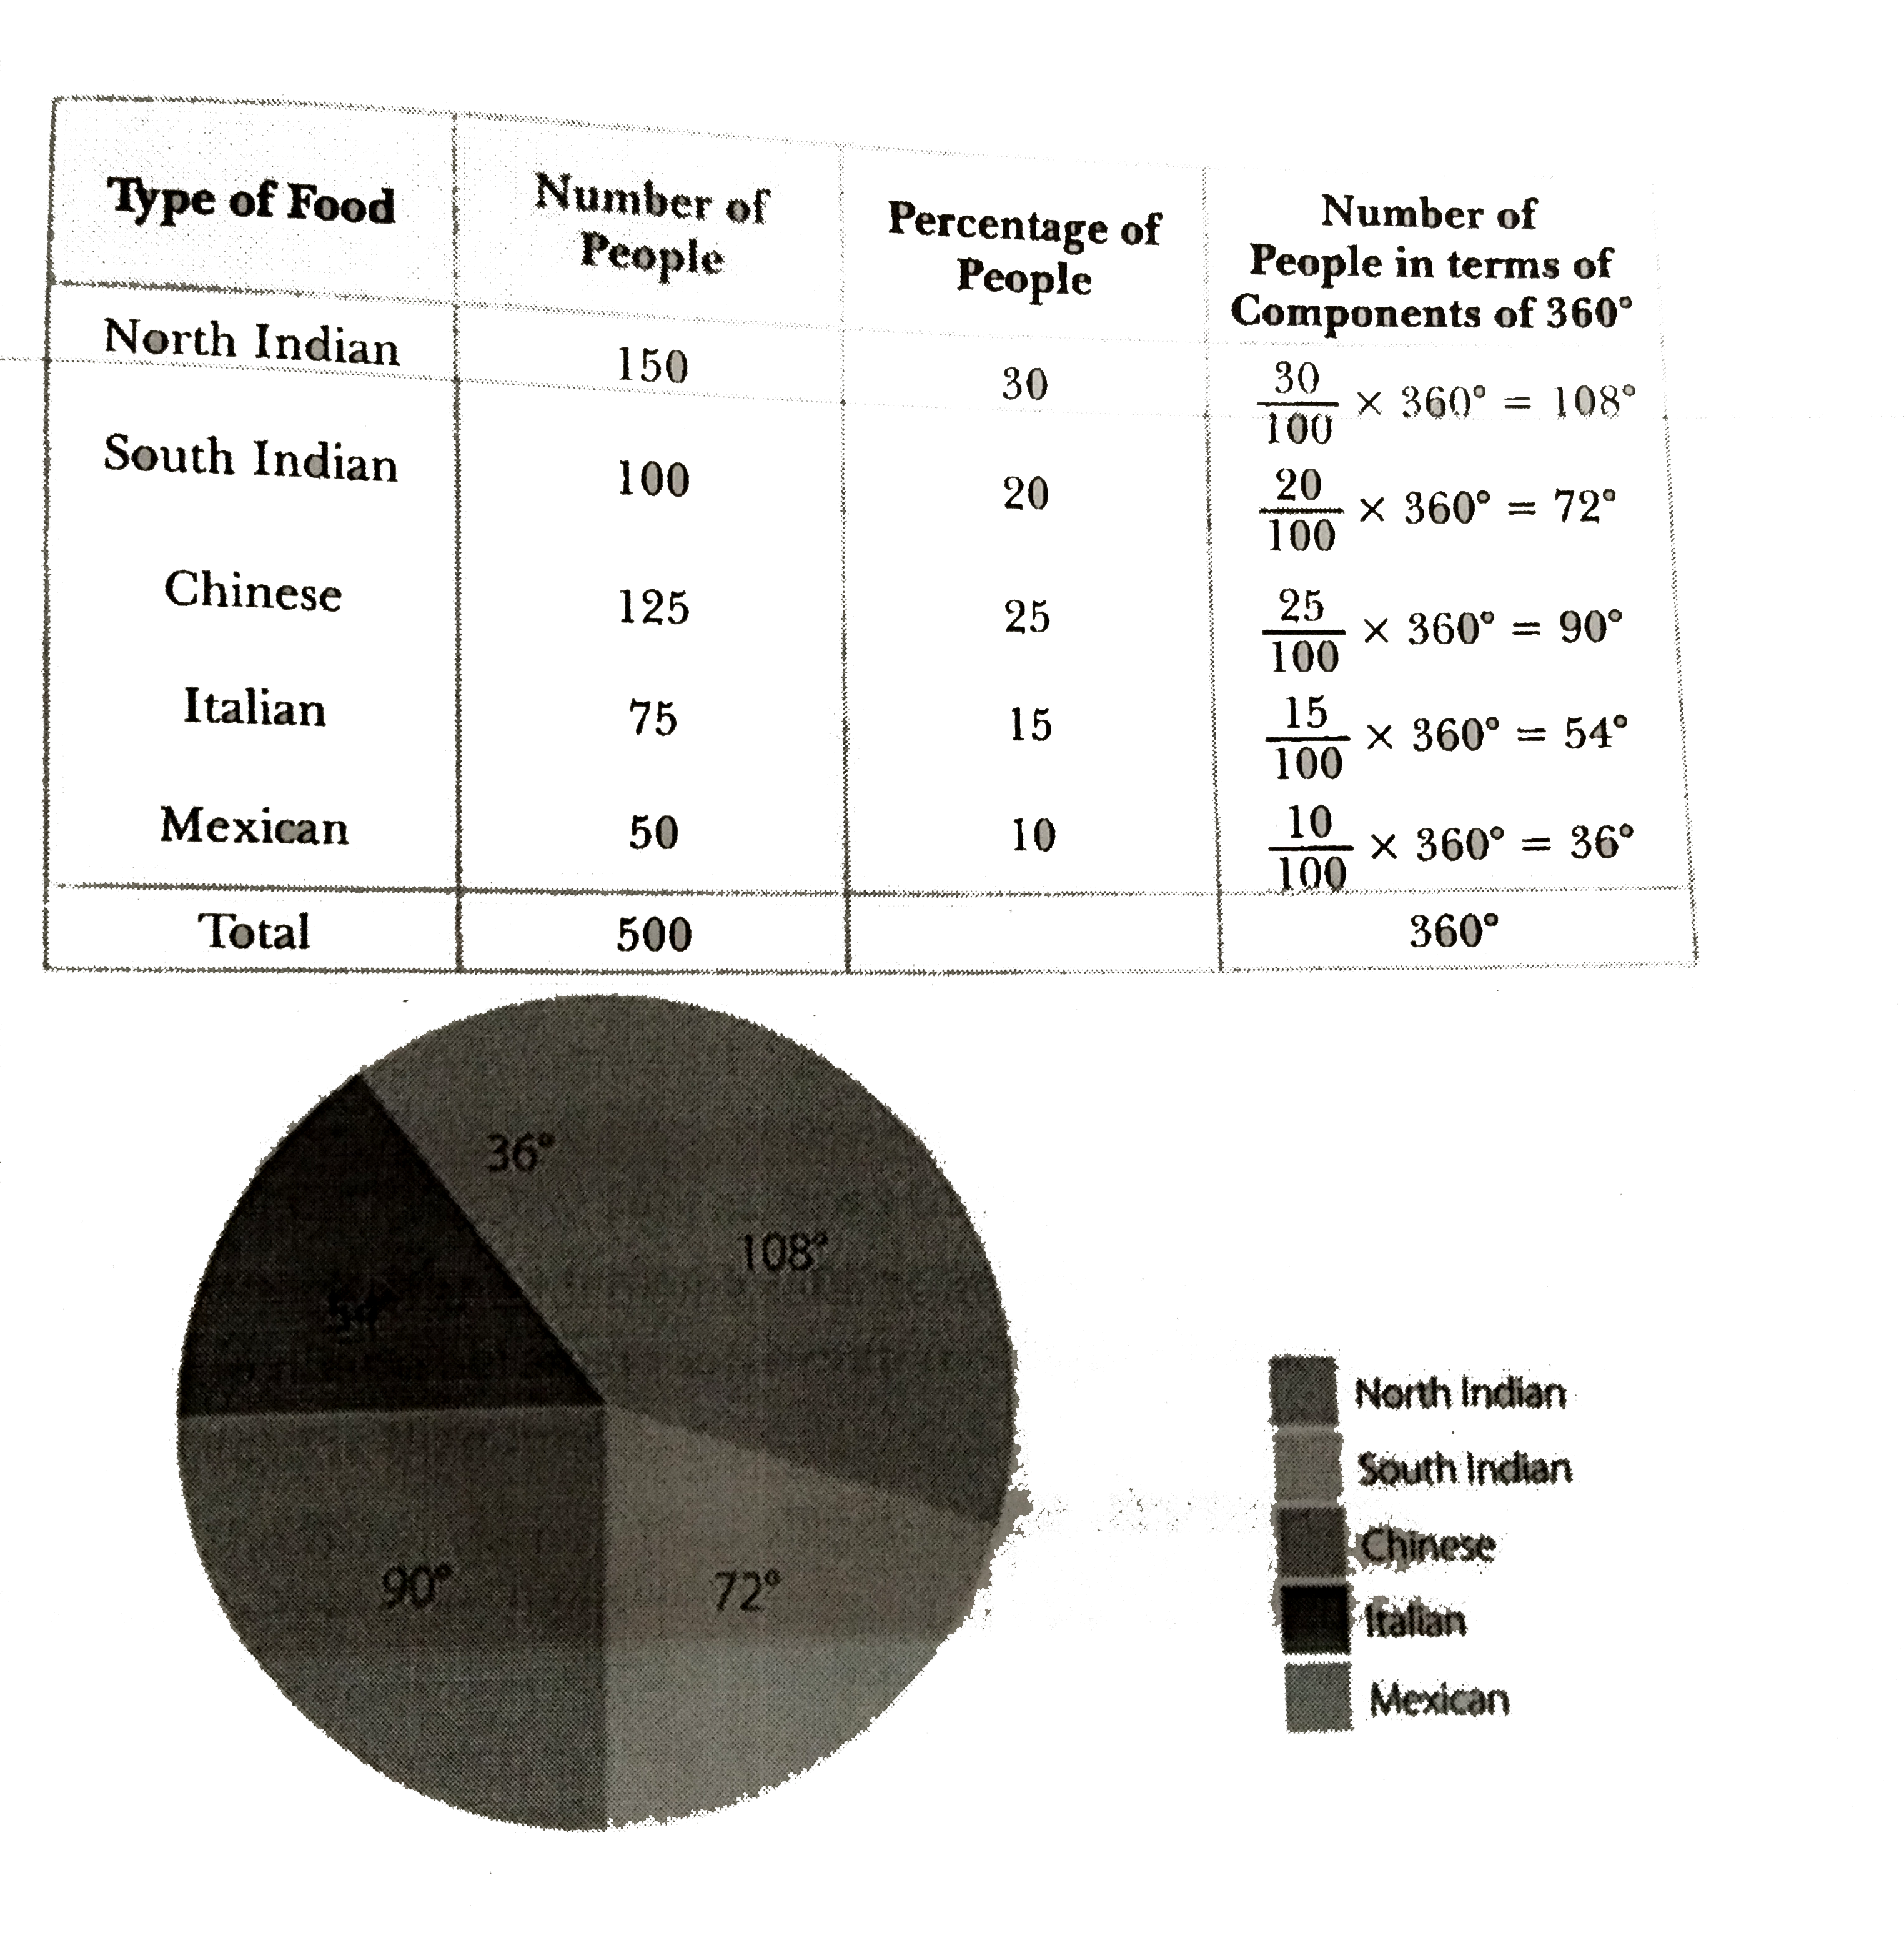
The tatste of 500 people of a sociaety for different type of food was recorded as follows :

Draw a pie diagram to represent the above data.
Similar Questions
Knowledge Check
A pie-diagram representing the following data is_____
 A
A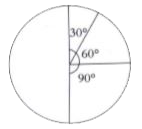 B
B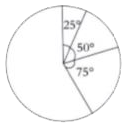 C
C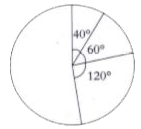 D
D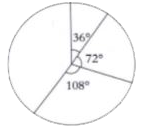
Why do different people eat different types of food?
View SolutionDraw a frequency polygon to represent the following data.

View SolutionThe income of a family i different year are as follows. Draw a bar graph to represent the data
View SolutionThe percentage of expenditure on different heads in a budget of a state is as shown below :

Draw a pie diagram to represent the information .
View SolutionDraw the diagrams of different types of aestivation.
View SolutionIn a botanical garden, the number of different types of plants are found as follows:
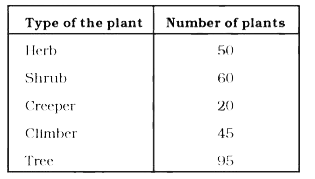
Draw a bar graph to represent the above information and answer the following question:
Which type of plant is maximum in number in the garden?
View SolutionIn a botanical garden, the number of different types of plants are found as follows:
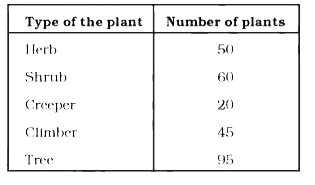
Draw a bar graph to represent the above information and answer the following question:
Which type of plant is minimum in number in the garden?
View Solution

