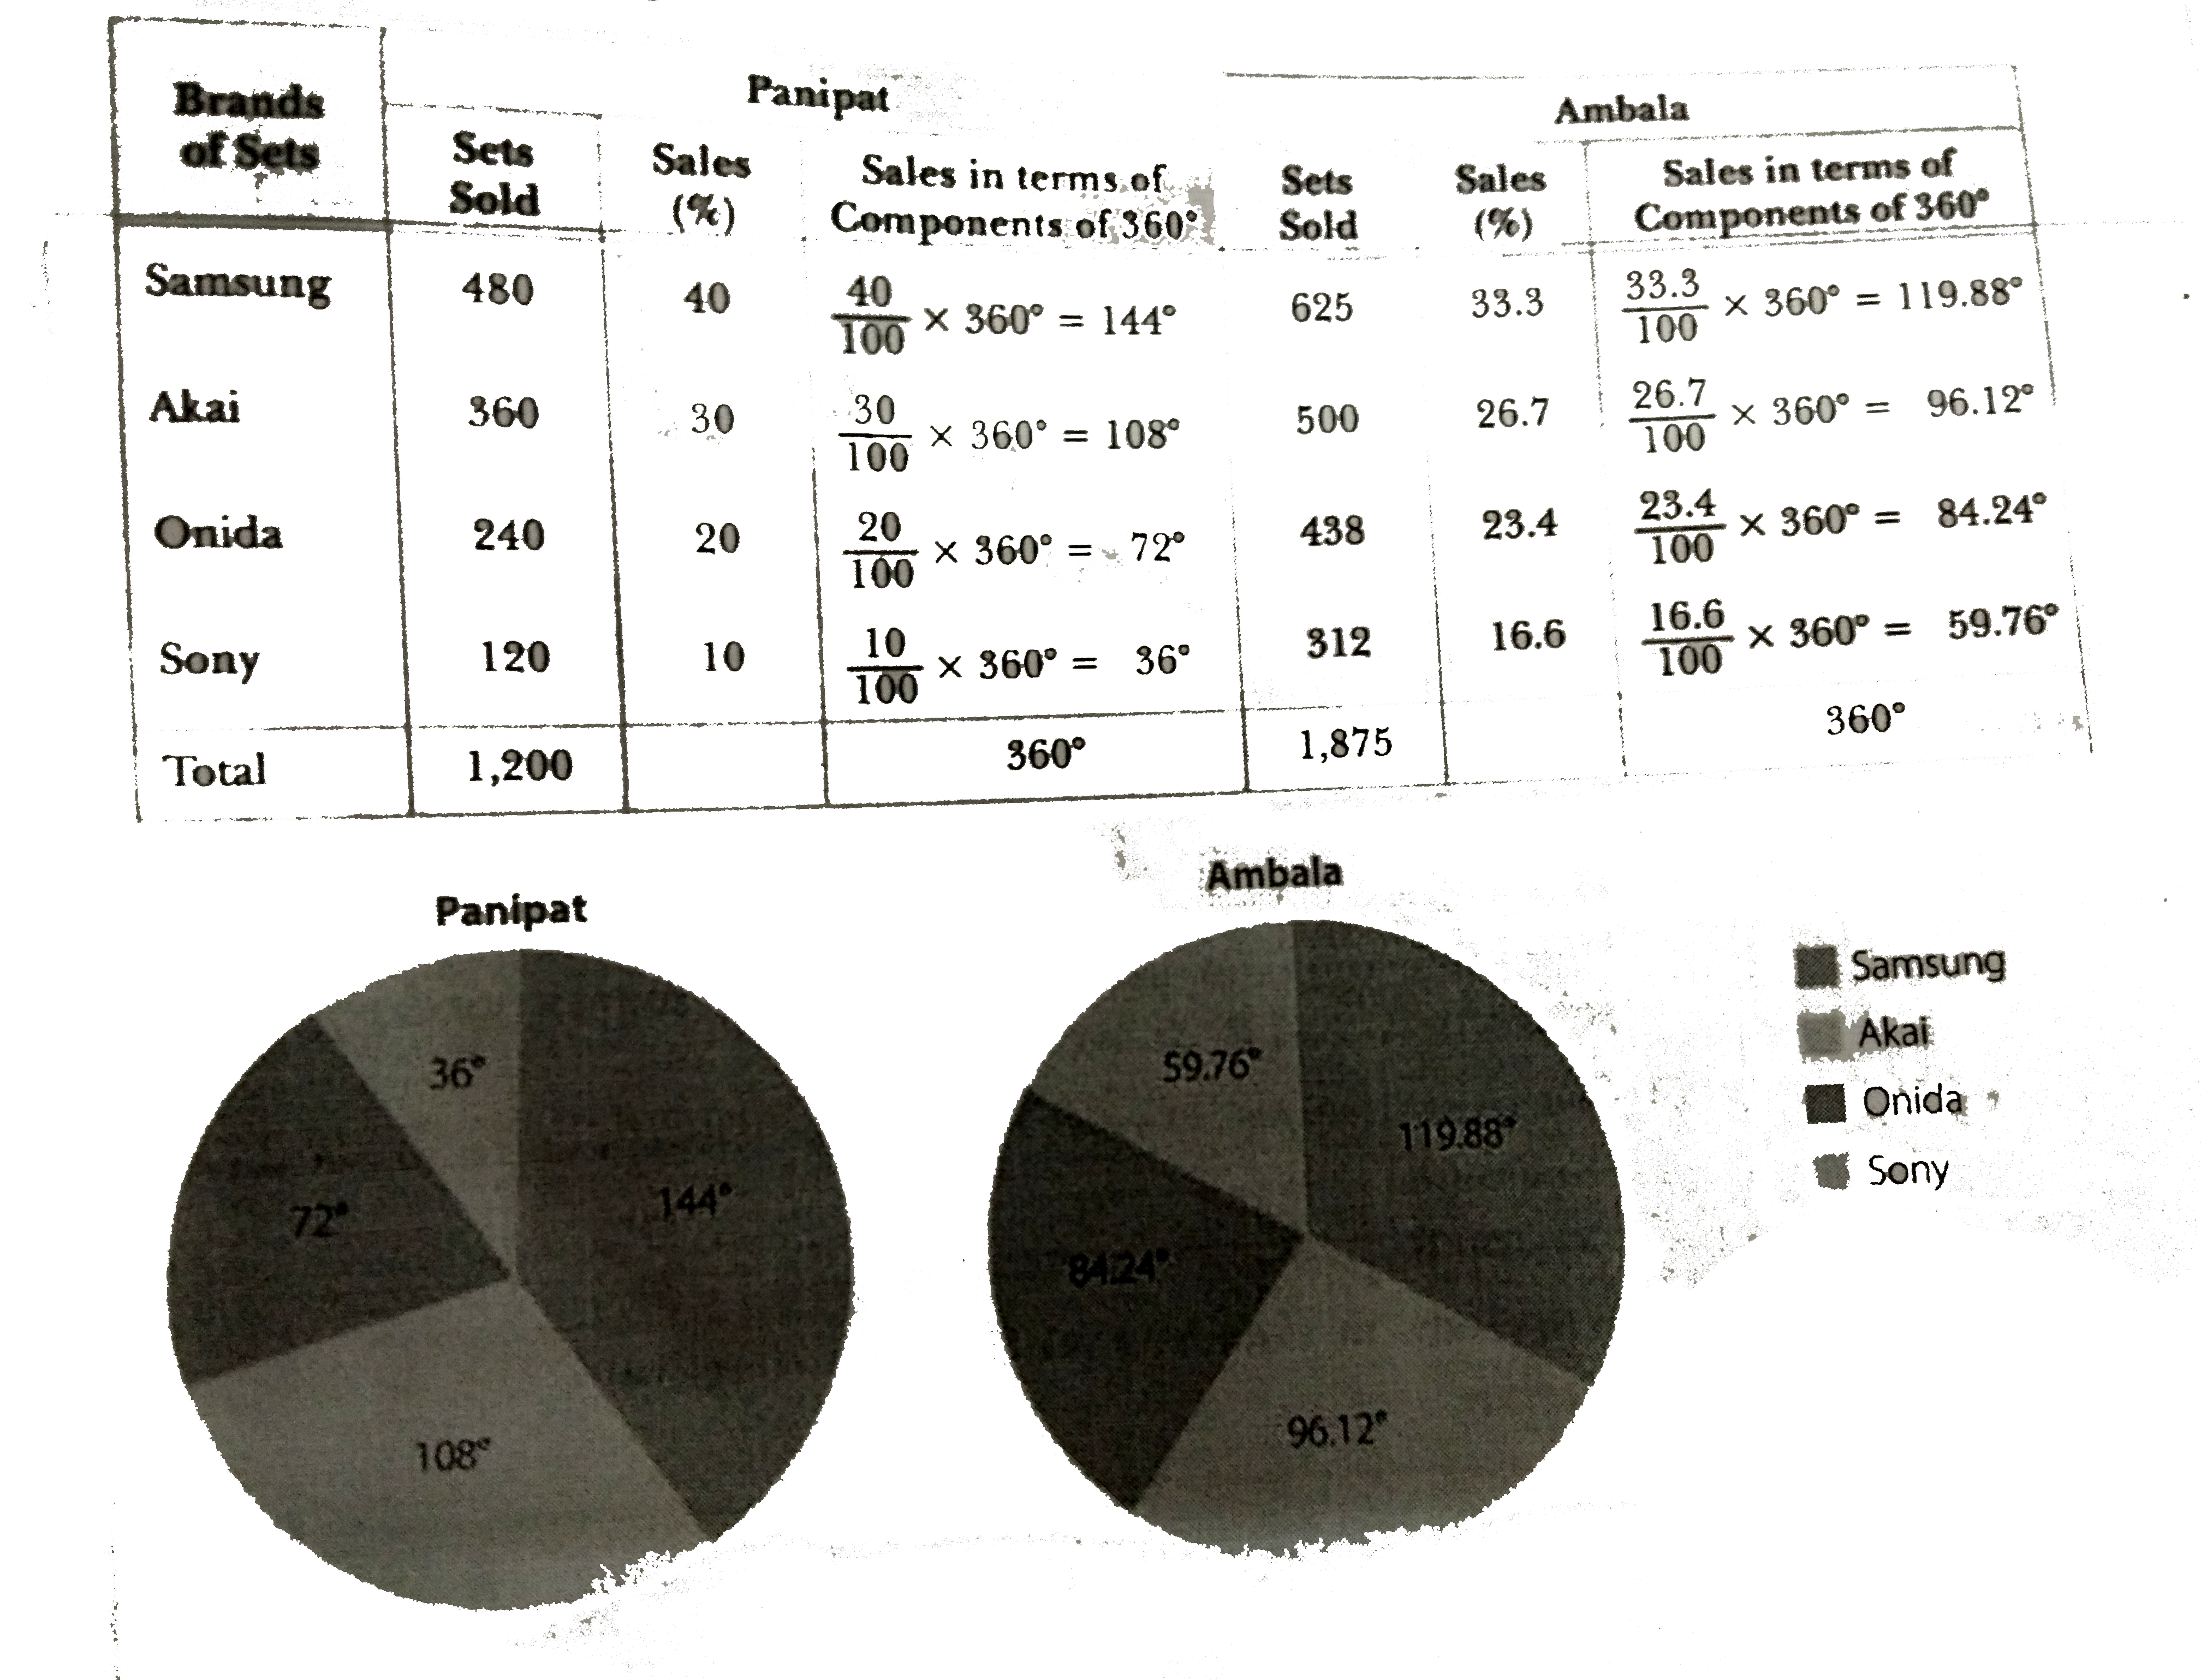
Following are the data about the market share of 4 brands of TV sets sold in Panipat and Ambala. Present the data by a pie diagram.

Total sets sold in Pnipat and Ambala are 1,200 and 1,875 respectively. Data are to represented by two circles whose redii are in the ratio of square roots of total TV sets sold in each city in The ratio of √1,200:√1,875 or 1.18 The calculations reagarding construction of pie diagram are as follows :

Similar Questions
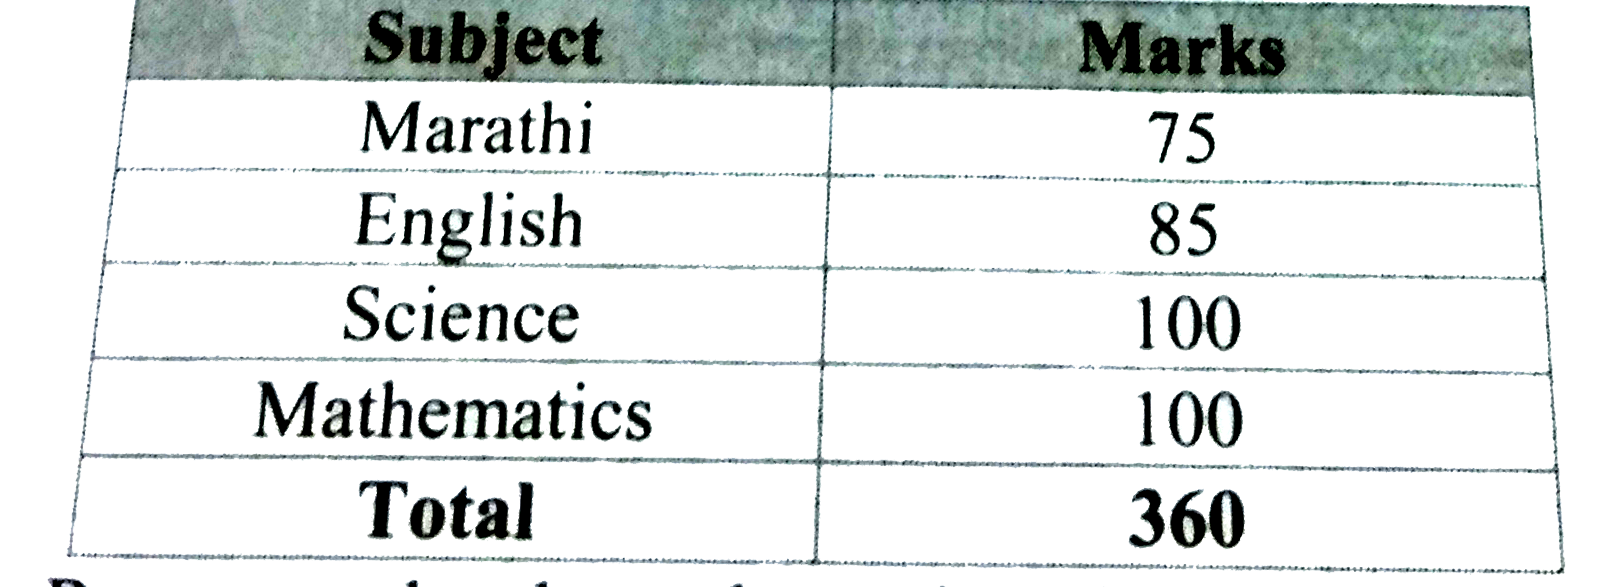
The marks obtained by a student in an examination are given below :

Represent the data using a pie diagram.
View SolutionThe marks obtained by a student in an examination are given below:

Represent the data using pie diagram
View SolutionThe marks obtained by a student in an examination are given below:

Represent the data using pie diagram.
View SolutionFollowing are the data about the number of men and women in different age groups in a society. Present the information in the form of a two-way table.

View SolutionThe following table gives the data on the marks obtained by two students 'A and B' in five subjects :

Represent the data by a multiple bar diagram.
View SolutionThe following table shows the percentage of buyers of four different brands of bathing soaps.

Represent the above data by a pie chart.
View SolutionThe marks obtained by a student in various subjects in an examination are given below.

Represent the data using pie diagram.
View SolutionReprent the following data by a percentage bar diagram :

View SolutionReprent the following data by a deviation bar diagram :

View SolutionThe marks obtained by a student in an examination are given below: The total marks out of 100 obtained in various subjects are as follows:

Represent the data using pie diagram.
View Solution
