Marks in Statistics of the students of Class XI are given below.
Find out arithmetic mean.
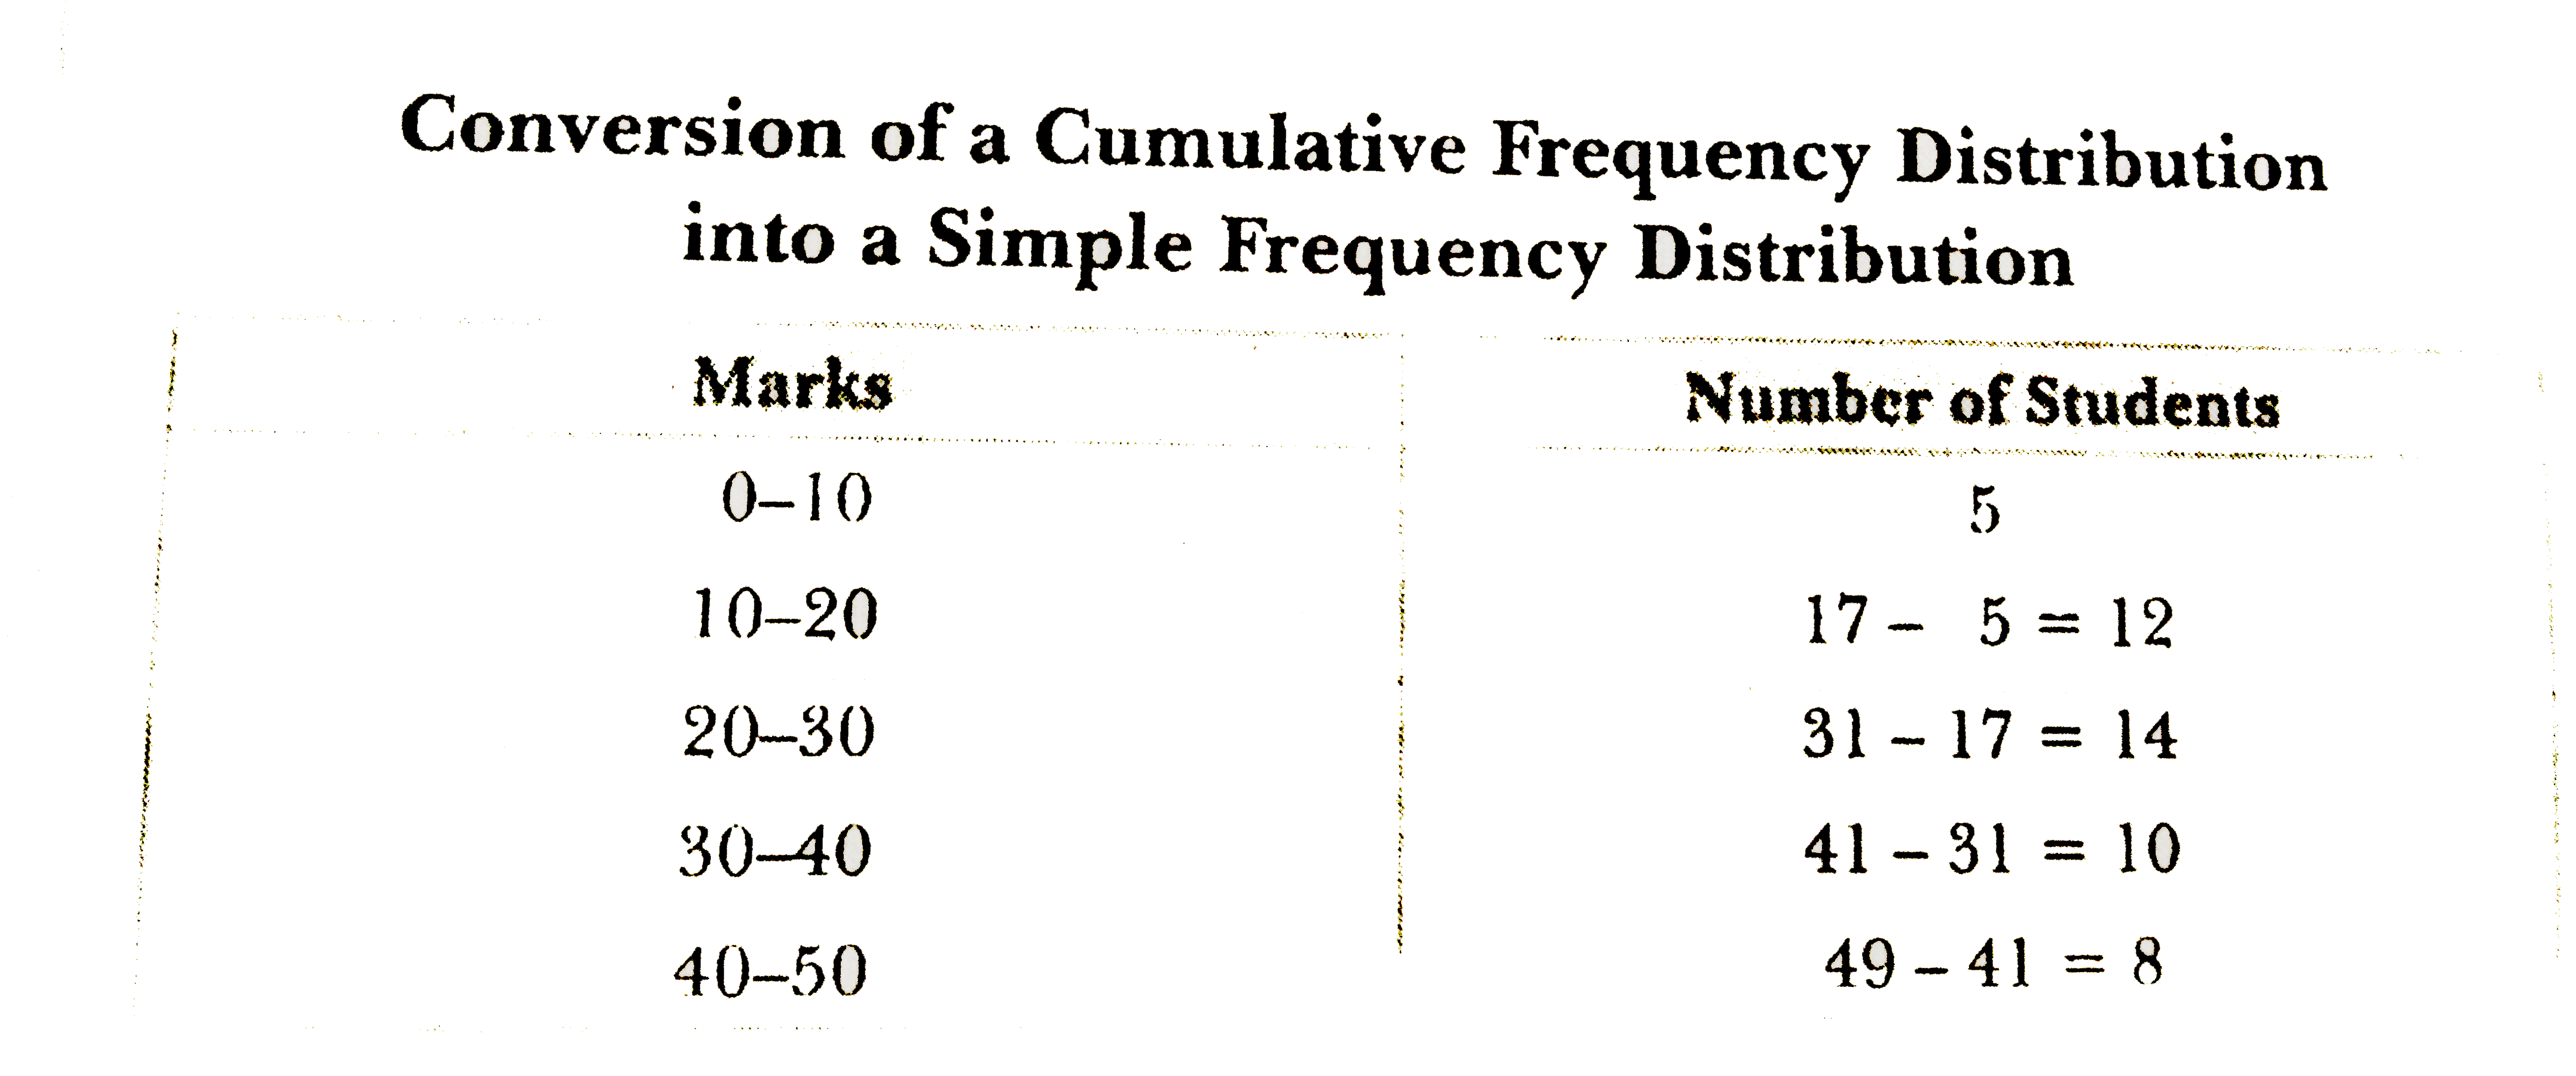
A Cumulative Frequency Distribution should first be converted into a Simple Frequency Distribution, as under:

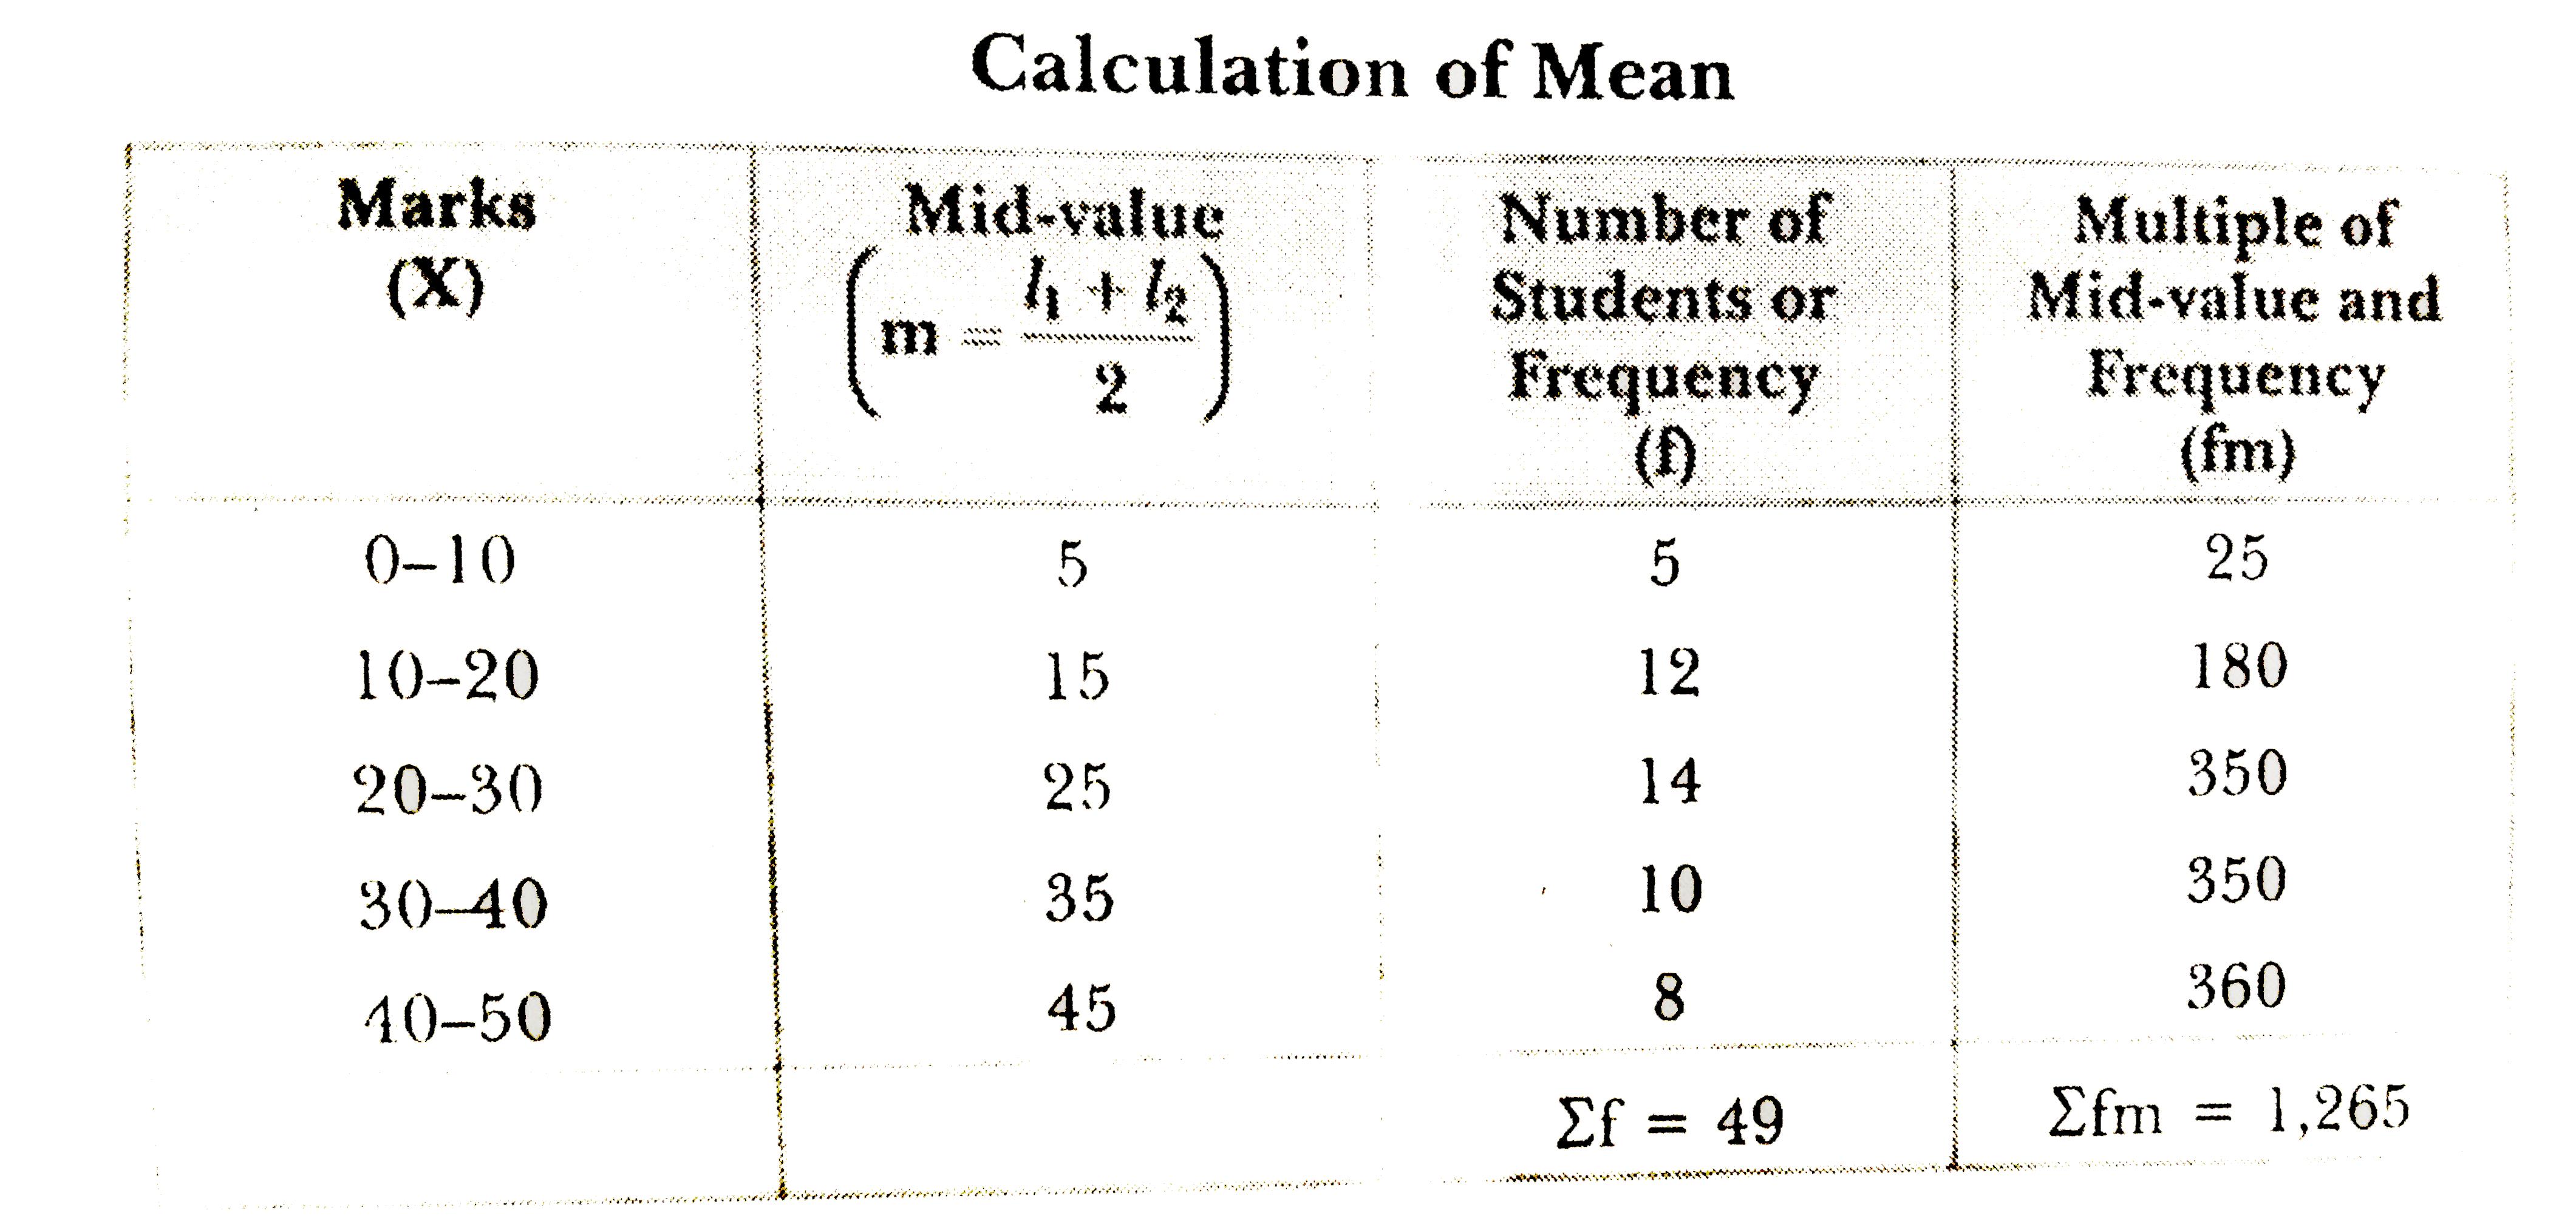
Now, mean value of the data is obtained using Direct Method as under:

Arithmetic Mean = 25.82 marks.
Topper's Solved these Questions
- MEASURES OF CENTRAL TENDENCY - ARITHMETIC MEANBook:TARUN JAIN & VK OHRIChapter:MEASURES OF CENTRAL TENDENCY - ARITHMETIC MEANExercise:5. NCERT Questions (With Hints to Answers)
Explore 12 Videos
- INDEX NUMBERSBook:TARUN JAIN & VK OHRIChapter:INDEX NUMBERSExercise:NCERT Questions (With Hints to Answers)
Explore 12 Videos
- MEASURES OF CENTRAL TENDENCY MEDIAN AND MODEBook:TARUN JAIN & VK OHRIChapter:MEASURES OF CENTRAL TENDENCY MEDIAN AND MODEExercise:NCERT Questions (With Hints to Answers)
Explore 5 Videos
Similar Questions
The following table shows marks in economics of the students of a class. Calculate arithmetic mean.
MarksNumber of StudentsMore than 0 30More than 2 28More than 4 24More than 6 18More than 8 10
View SolutionThe following table shows marks in economics of the students of a class. Calculate arithmetic mean.
MarksNumber of StudentsMore than 0 30More than 2 28More than 4 24More than 6 18More than 8 10
View Solution
Knowledge Check
The following table shows the number of marks secured by the students of a class in a 50 marks exam.
ScoreNumber of studentsLess than or equal to 10 marks 2More than 10 marks and less then or equal to 20 marks5More than 20 marks and less then or equal to 30 marks9More than 30 marks and less then or equal to 40 marks14More than 40 marks and less then or equal to 50 marks10
How many students secured less then or equal to 30 marks in that exam ?A9B14C23D16The number of all prime numbers less than 40 is ..
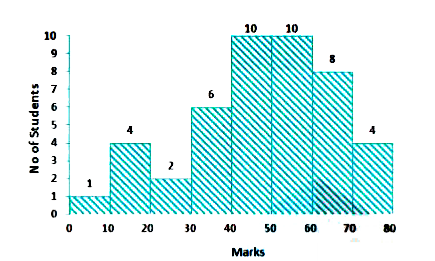
A15B18C17D12The histogram depicts the marks obtained by 45 students of a class. How many students obtained 50 or more marks and less than 70?
 A16B19C15D18
Calculate arithmetic mean , median and mode of the following series :
MarksNumber of StudentsLess than 10 12Less than 20 26Less than 30 40Less than 40 58Less than 50 80Less than 60 110Less than 70 138Less than 80 150
View SolutionCalculate mode from the following data :
Wages (Rs.)Number of WorkersLess than 10 15Less than 20 35Less than 30 60Less than 40 84Less than 50 96Less than 60 127Less than 70 198Less than 80 250
View SolutionMarks obtained by 90 students of class IX in a test are given below:

Out of these students, one is chosen at random. Find the probability that the chosen student obtains
less than 20% marks
View SolutionFind out the arithmetic mean from the following data:
Marks (less than) 51015202530Number of Students223102330546980
View SolutionFind out the arithmetic mean from the following data:
Marks (less than) 51015202530Number of Students223102330546980
View Solution