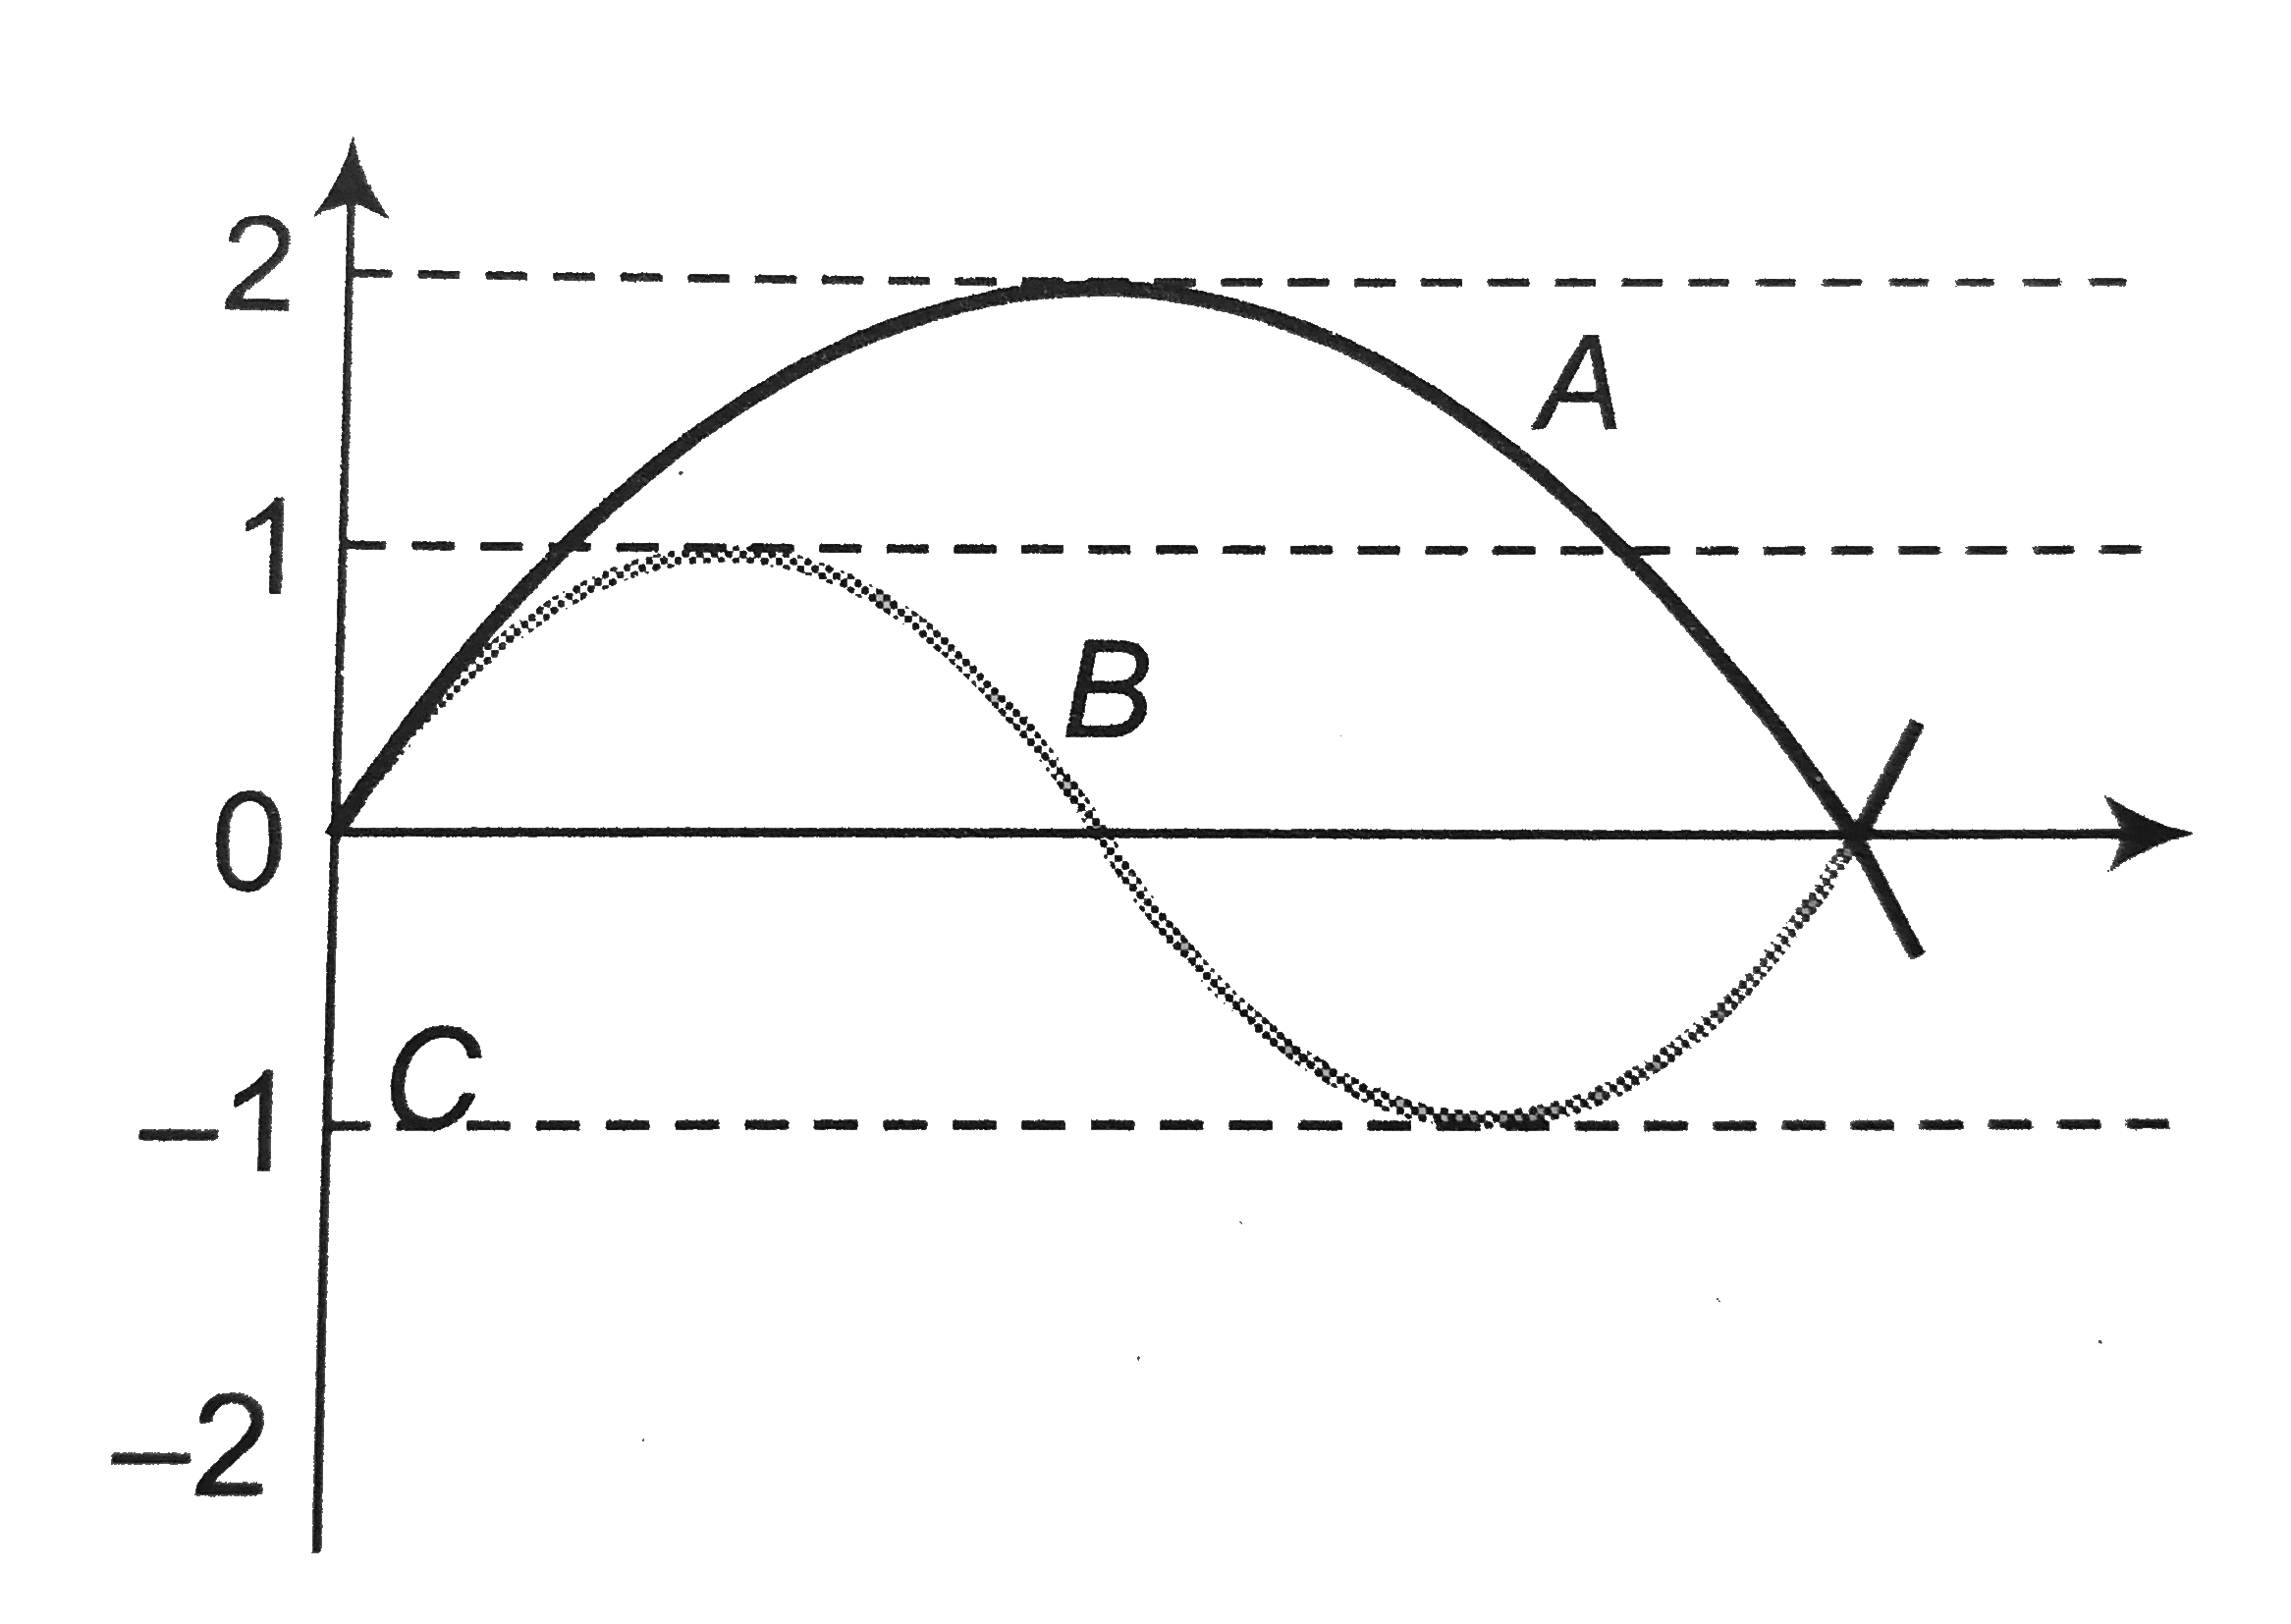
The displacement-time graph of two moving objects A and B are shown in the figure given below. Which of the following is incorrect?
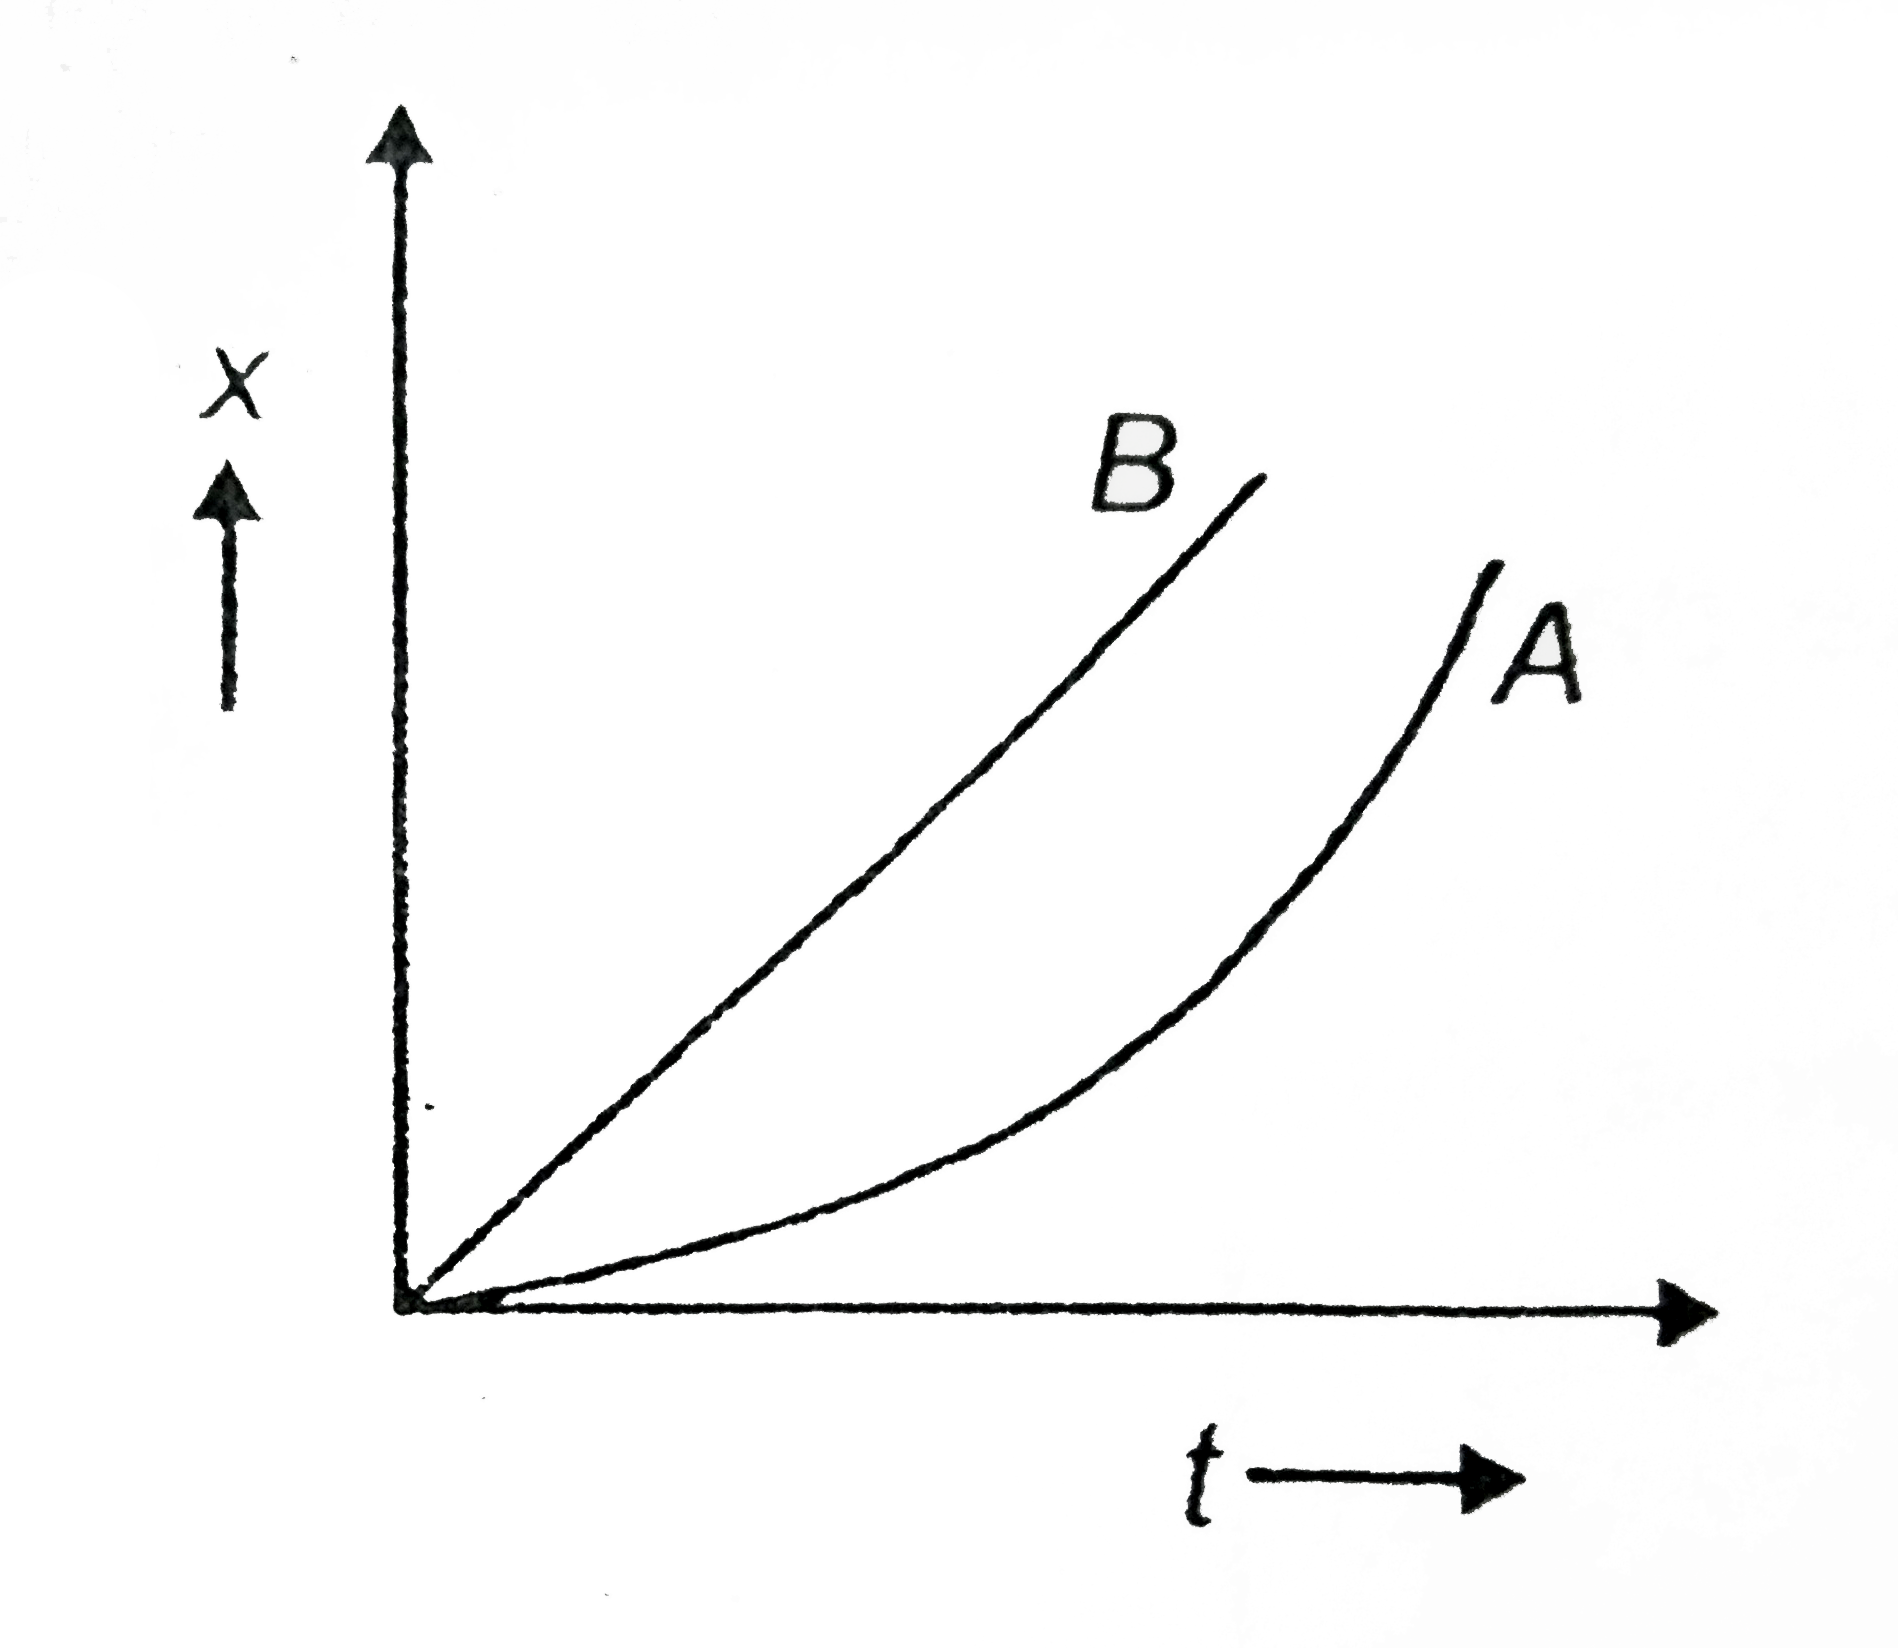
B is moving with constant velocity
A is moving with increasing speed
B is moving with non - zero constant acceleration
Acceleration of A may be constant
The correct Answer is:C
Step by step video, text & image solution for The displacement-time graph of two moving objects A and B are shown in the figure given below. Which of the following is incorrect? by Physics experts to help you in doubts & scoring excellent marks in Class 12 exams.
Updated on:21/07/2023Topper's Solved these Questions
- MOTION IN A STRAIGHT LINEBook:AAKASH INSTITUTEChapter:MOTION IN A STRAIGHT LINEExercise:ASSIGNMENT (SECTION - A)
Explore 60 Videos
- MOTION IN A STRAIGHT LINEBook:AAKASH INSTITUTEChapter:MOTION IN A STRAIGHT LINEExercise:ASSIGNMENT (SECTION - B)
Explore 33 Videos
- MOTION IN A STRAIGHT LINEBook:AAKASH INSTITUTEChapter:MOTION IN A STRAIGHT LINEExercise:TRY YOURSELF
Explore 40 Videos
- MOTION IN A PLANEBook:AAKASH INSTITUTEChapter:MOTION IN A PLANEExercise:Assignement section -J (Aakash Challengers Questions)
Explore 4 Videos
- MOTION IN STRAIGHT LINEBook:AAKASH INSTITUTEChapter:MOTION IN STRAIGHT LINEExercise:Assignment (SECTION - J)
Explore 2 Videos
Similar Questions
The displacement-time graph for a particle executing SHM is as shown in figure.
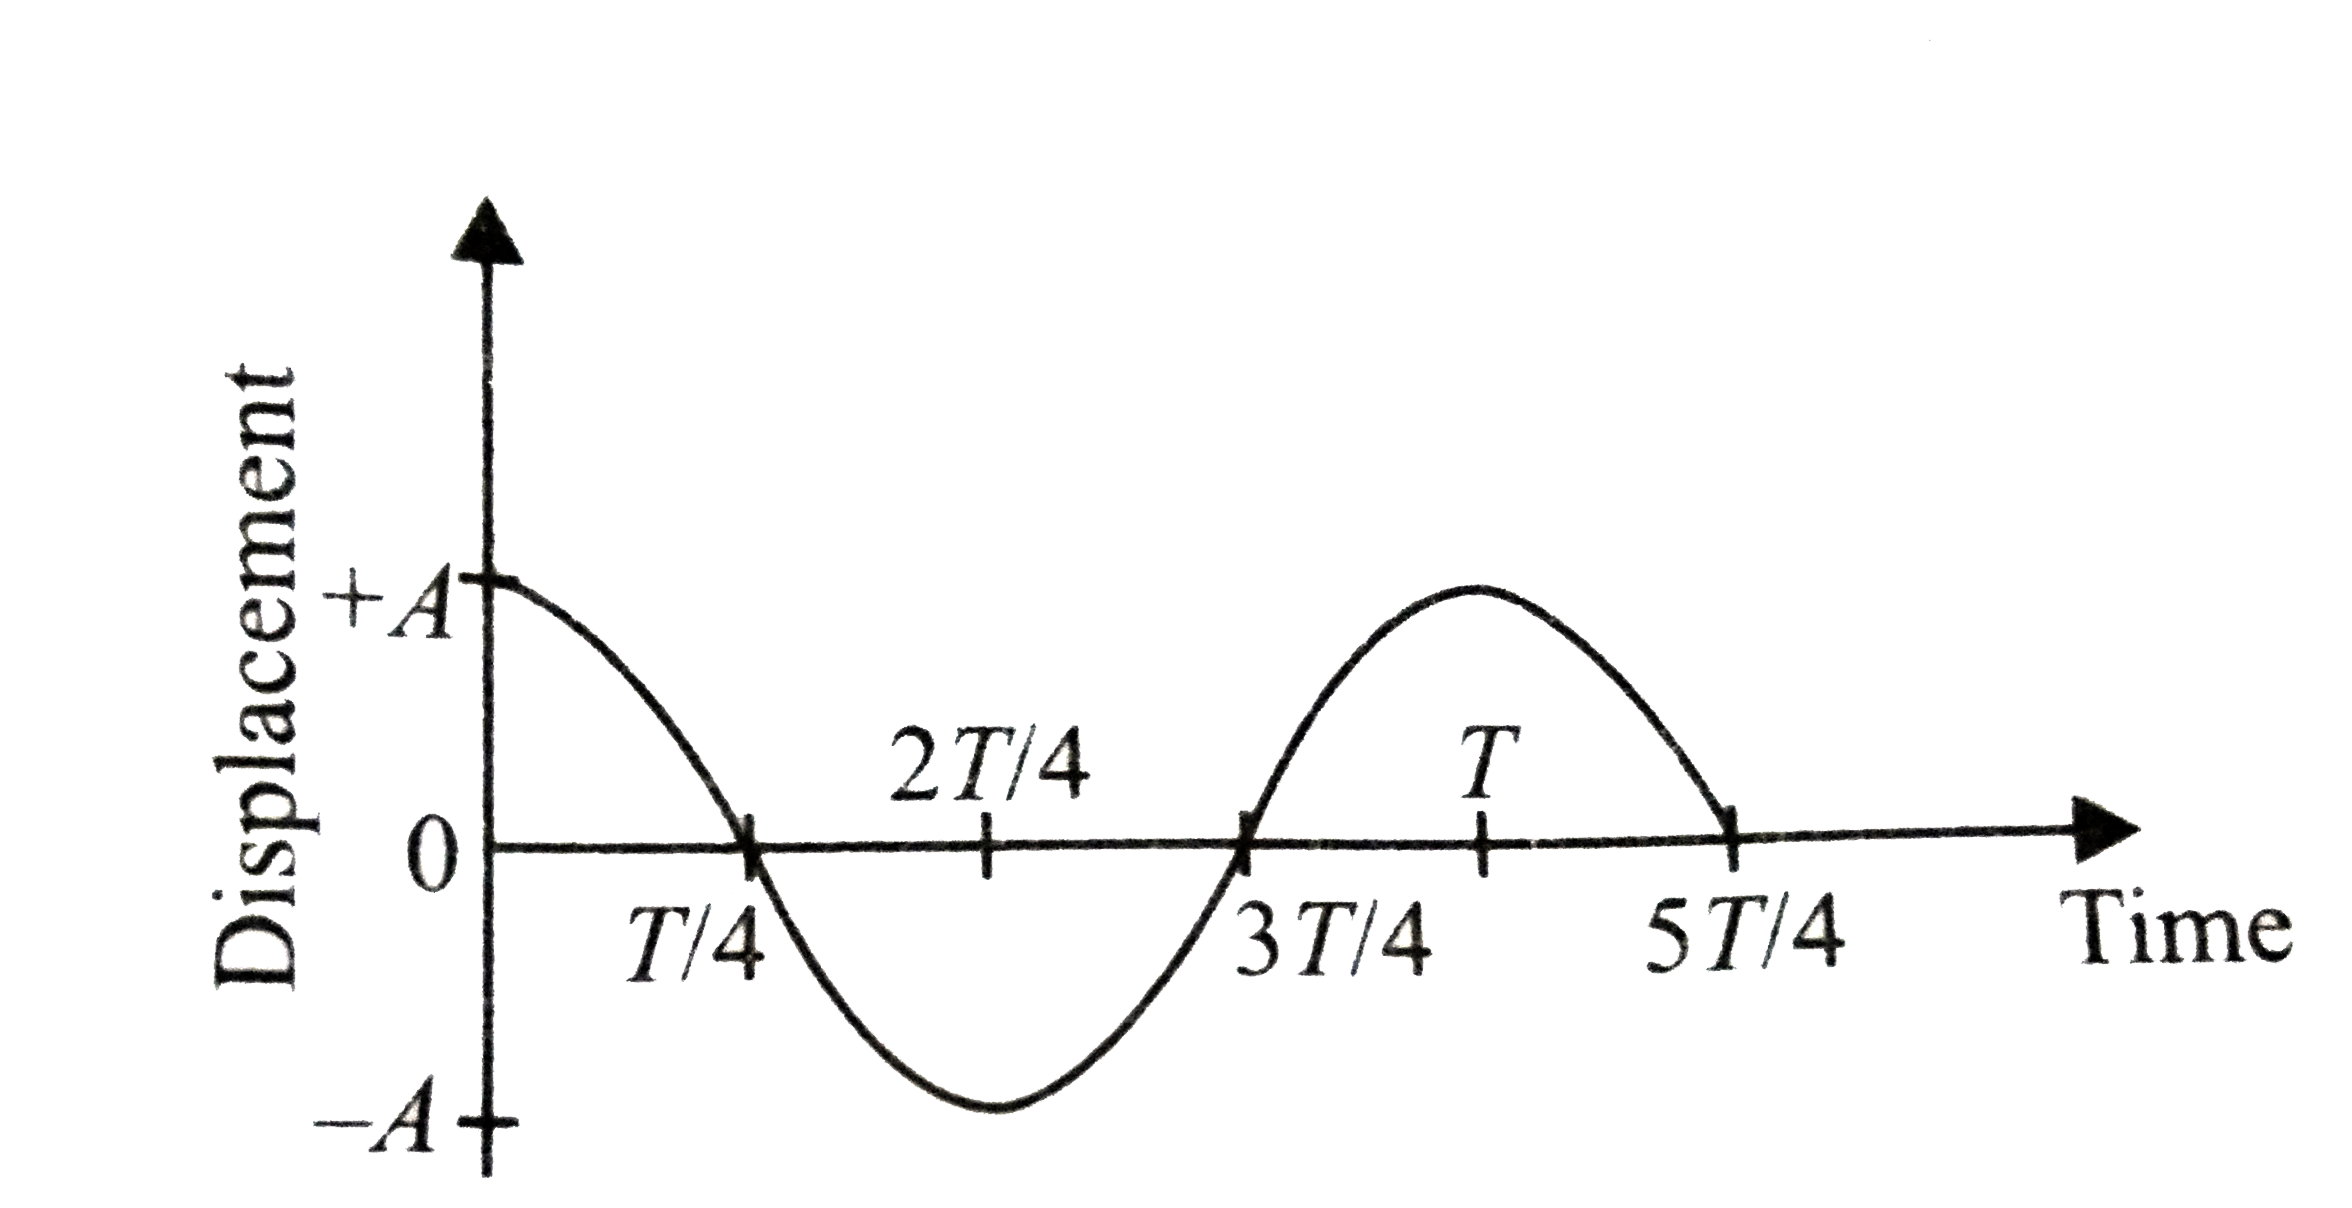
Which of the following statements is correct?
View SolutionThe displacement-time graph of a particle executing simple harmonic motion is shown in the figure
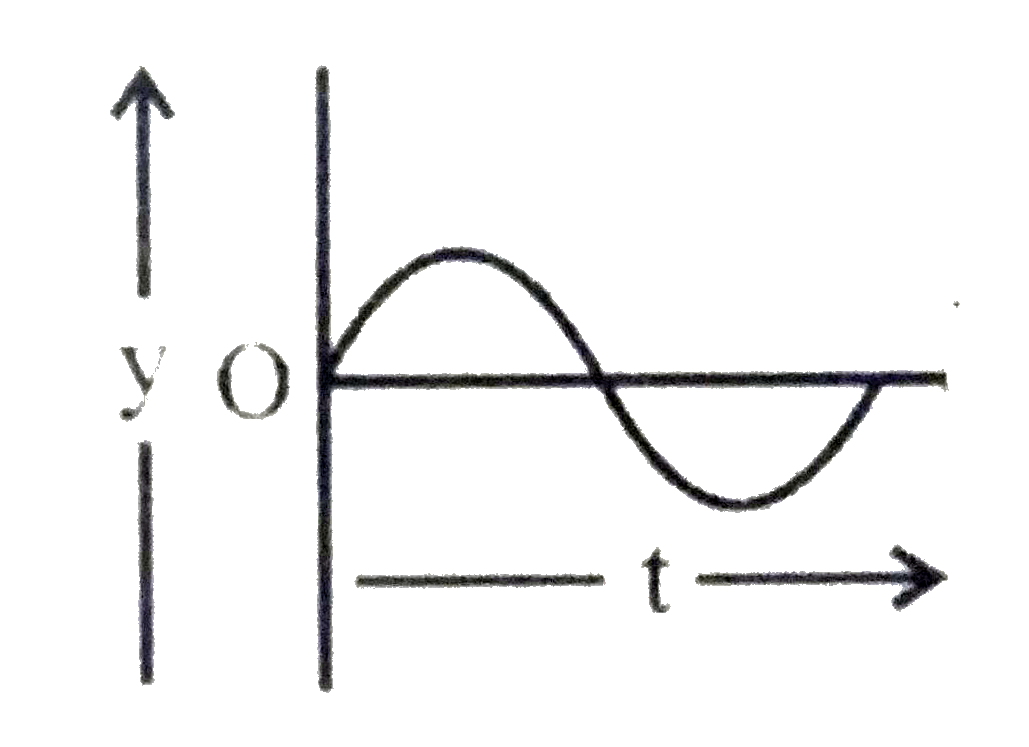
Which one of the following graphs is the correct forcetime graph for the motion of the particle ?
View Solution
Knowledge Check
The distance-time graph of a moving vehicle is as shown in the figure.
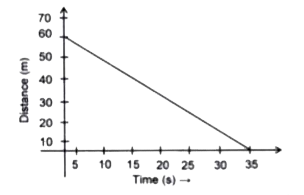 AThe speed of the vehicle is increasing with time.BThe speed of the vehicle is decreasing with time.CThe final speed of the vehicle is zero.DGraph is not possible.
The displacement time graph for two sound waves A and B are shown in the figure. Then the ratio of their intensities IA/IB is equal toA1:4B1:16C1:2D1:1The displacement-time graph of a particle executing SHM is shown in figure. Which of the following statement is/are true ?
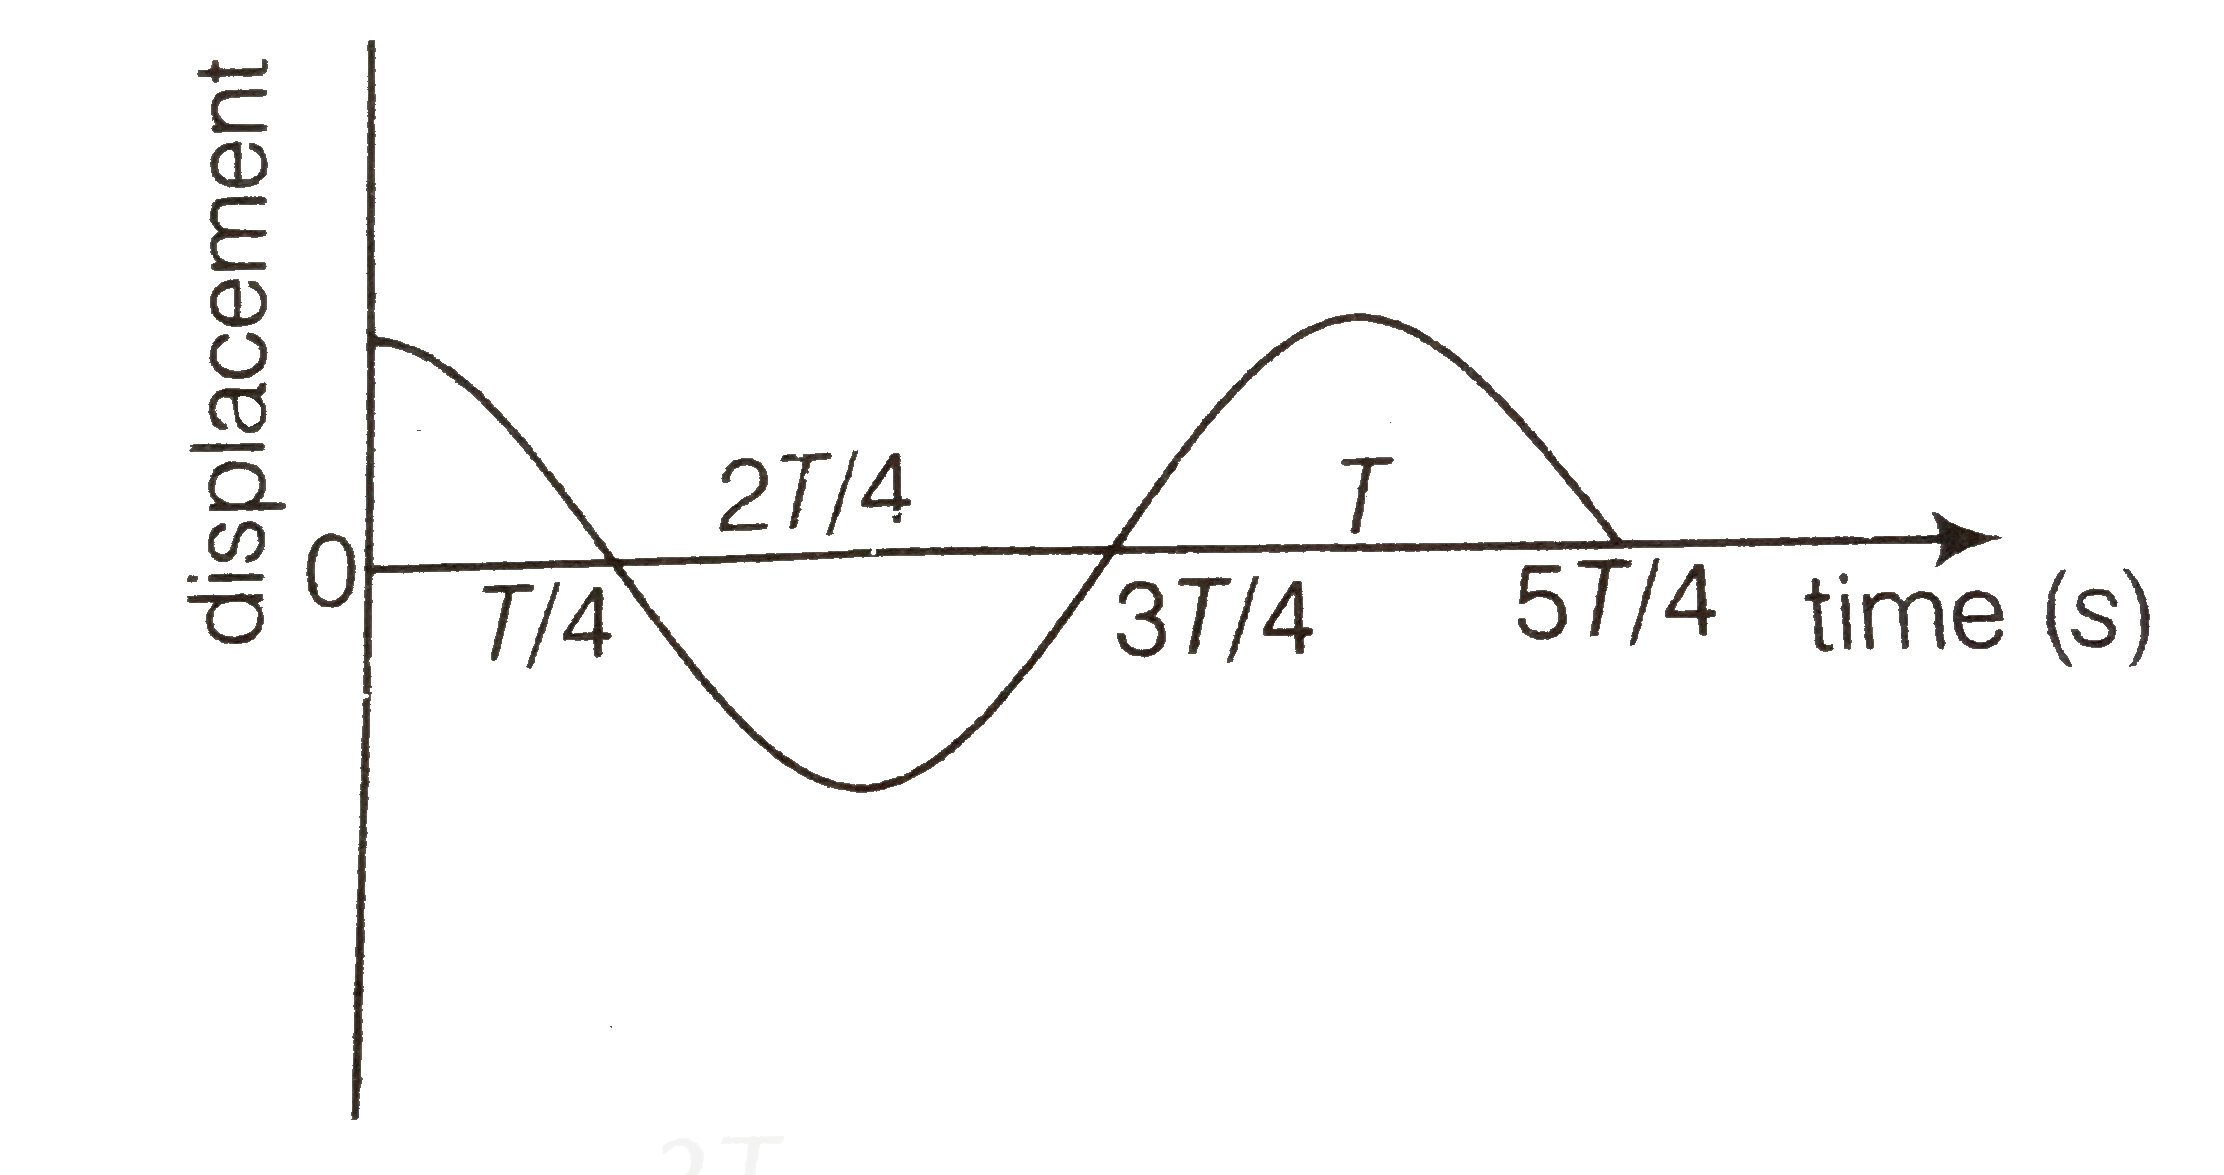 AThe focrce is zero at t=3T4BThe acceleration is maximum at t=4T4CThe velocity is maximum at t=T4DThe PE is equal to KE of oscillation at t=T2
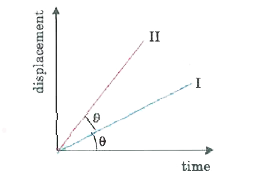
From the given displacement - time graph of two cars moving on a straight road , which of the following is moving with greater velocity ?
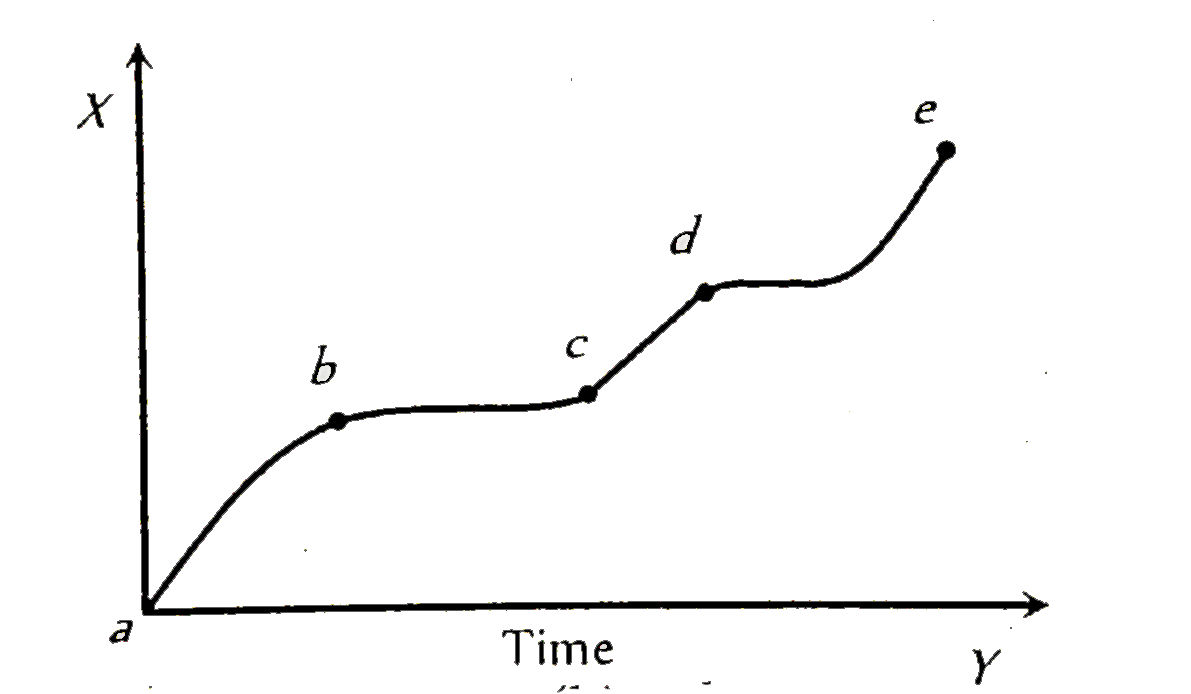
View SolutionThe displacement versus time graph for a body moving in a straight line is shown in figure. Which of the following regions represents the motion when no force is acting on the body
View SolutionThe displacement -time graph of a particle executing SHM is shown in figure. Which of the following statements is/are true ?
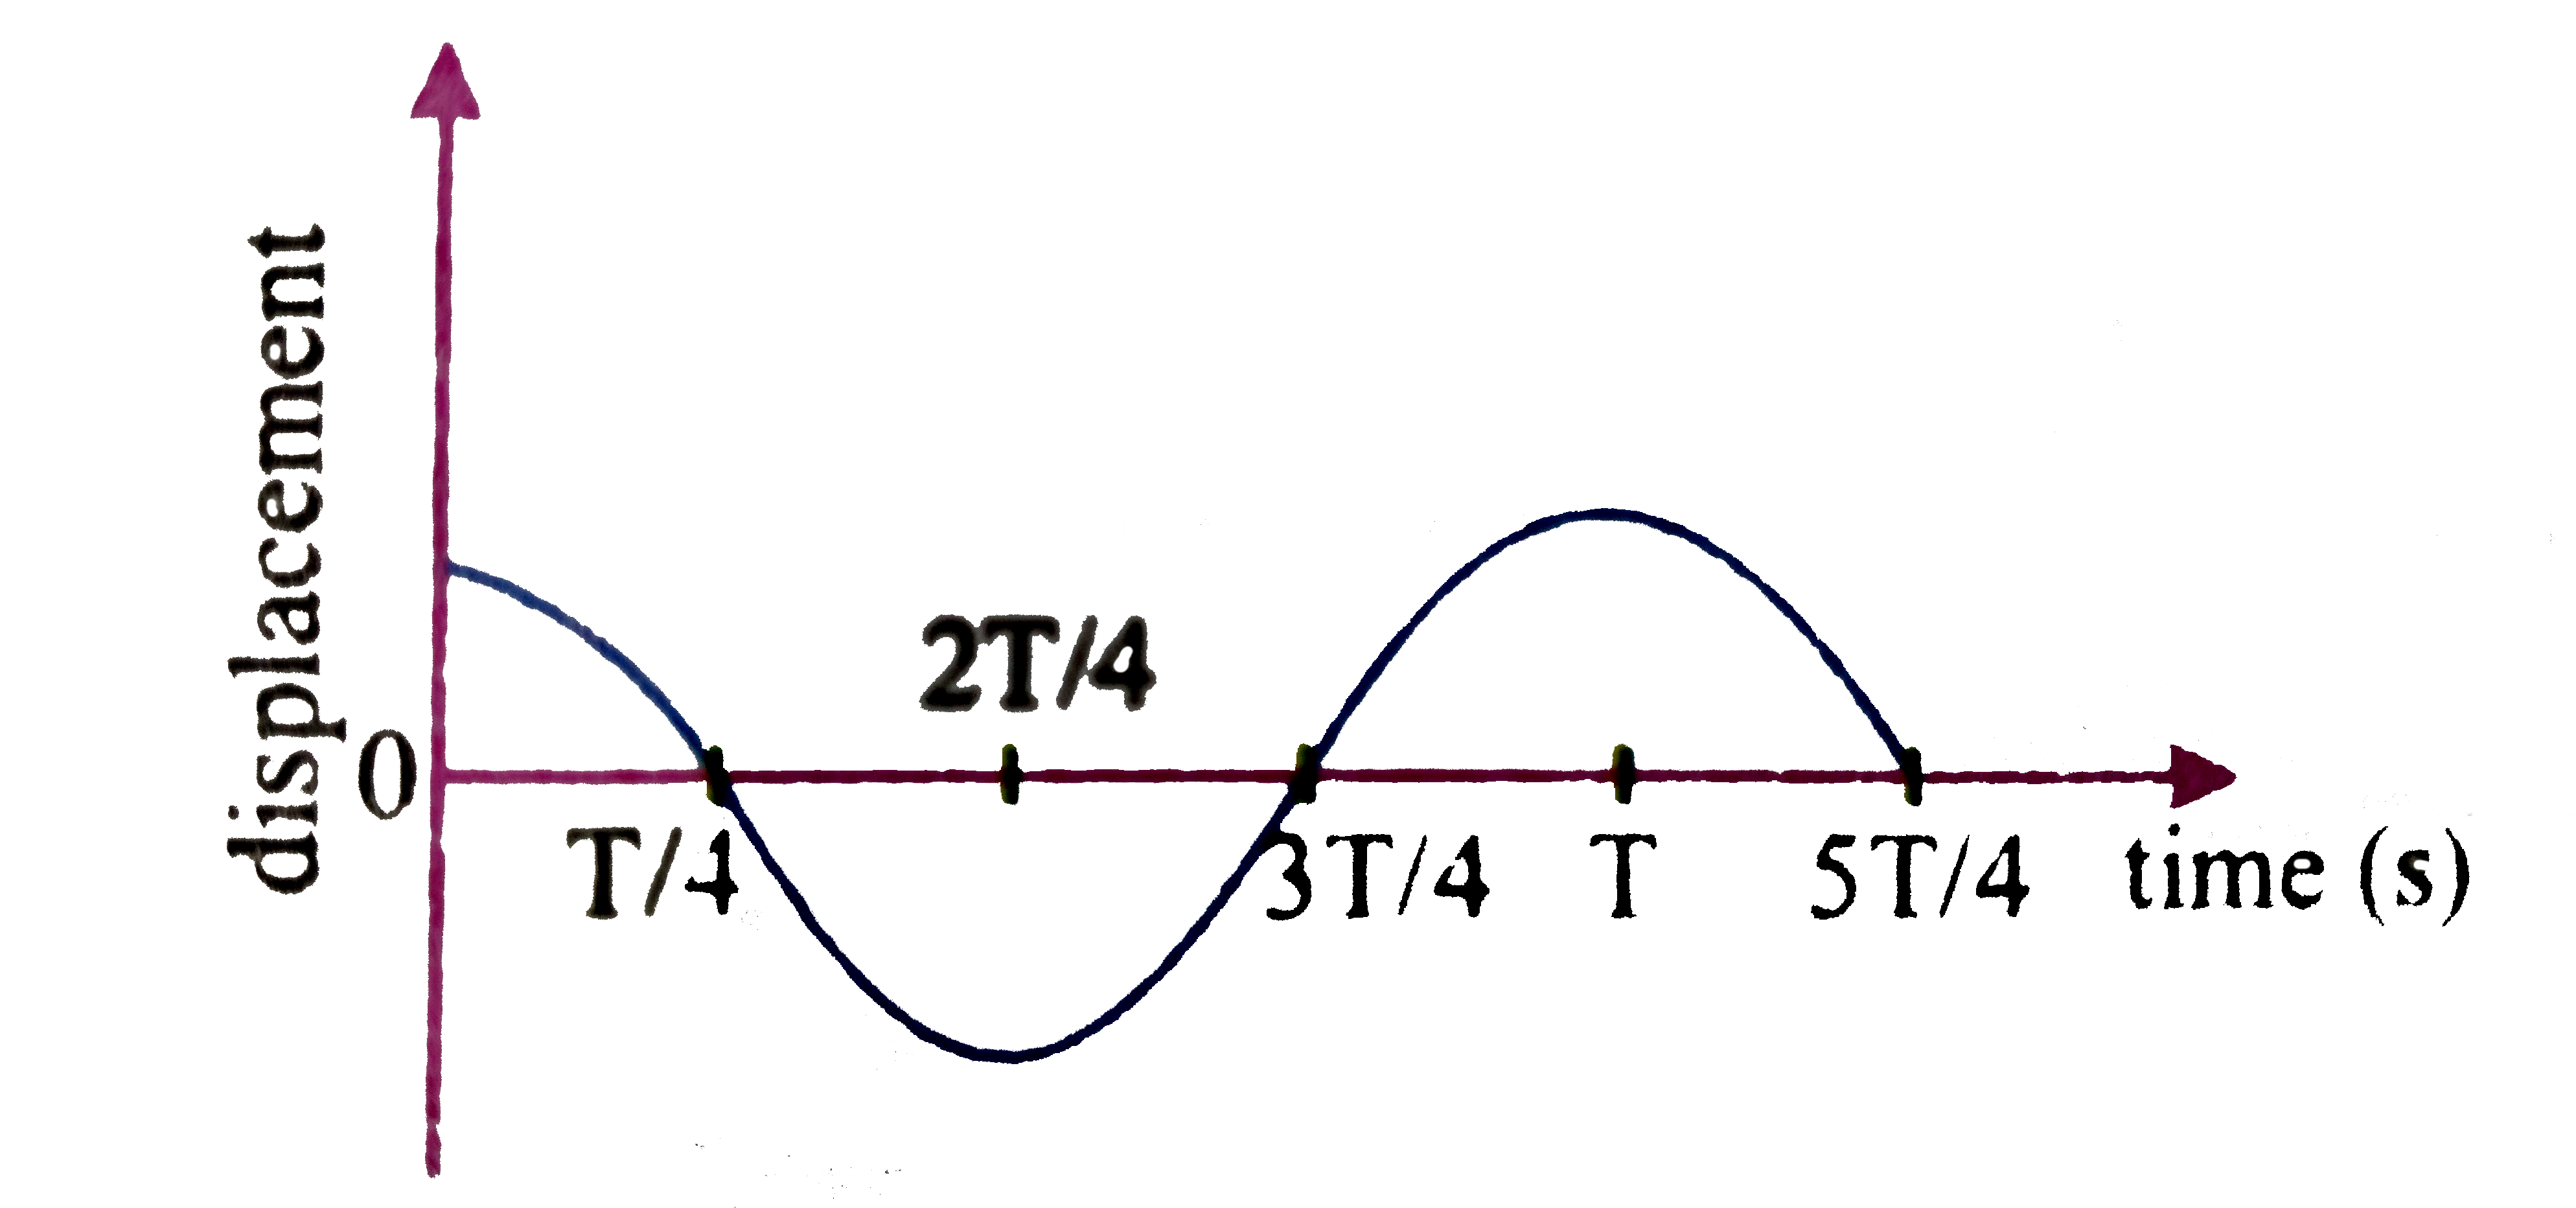
View SolutionDisplacement time graph of a particle moving in a straight line is a shown in figure.

View SolutionThe displacement time graph of a particle executing S.H.M. is shown in figure. Which of the following statement is / are true ?
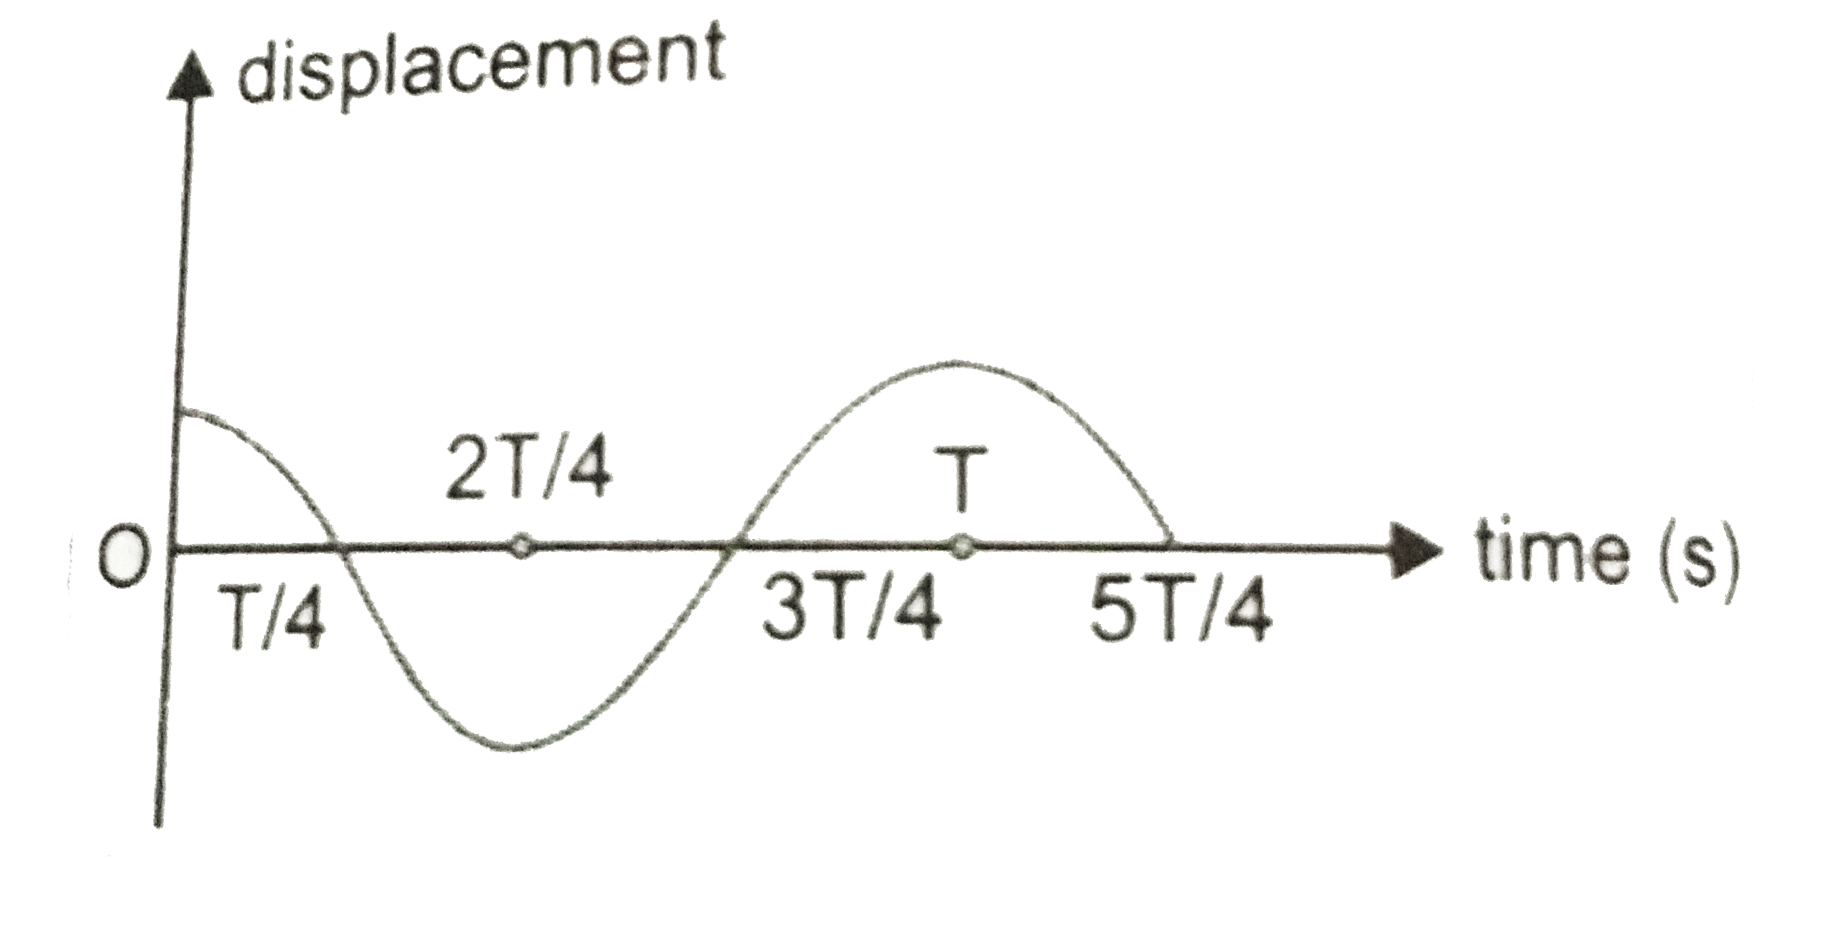
View Solution