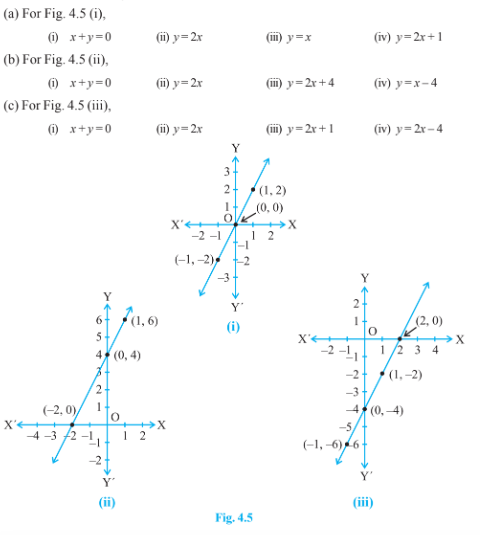
For each of the graphs given in Fig. 4.5 select the equation whose graph it is from the choices given below:
Video Solution
Text Solution
(a) In Fig. 4.5 (i), the points on the line are (–1,–2),(0,0),(1,2). By inspection, y=2x is the equation corresponding to this graph. You can find that the y-coordinate in each case is double that of the x-coordinate.
(b) In Fig. 4.5 (ii), the points on the line are (–2,0),(0,4),(1,6). You know that the coordinates of the points of the graph (line) satisfy the equation y=2x+4. So,y=2x+4 is the equation corresponding to the graph in Fig. 4.5 (ii).
(c) In Fig. 4.5 (iii), the points on the line are (–1,–6),(0,–4),(1,–2),(2,0). By inspection, you can see that y=2x–4 is the equation corresponding to the given graph (line)
|
Topper's Solved these Questions
- LINEAR EQUATIONS IN TWO VARIABLESBOOK - NCERTCHAPTER - LINEAR EQUATIONS IN TWO VARIABLESEXERCISE - EXERCISE 4.4
2 Videos
- LINEAR EQUATIONS IN TWO VARIABLESBOOK - NCERTCHAPTER - LINEAR EQUATIONS IN TWO VARIABLESEXERCISE - EXERCISE 4.2
4 Videos
- INTRODUCTION TO EUCLIDS GEOMETRYBOOK - NCERTCHAPTER - INTRODUCTION TO EUCLIDS GEOMETRYEXERCISE - Solved Examples
3 Videos
- LINES AND ANGLESBOOK - NCERTCHAPTER - LINES AND ANGLESEXERCISE - SOLVED EXAMPLES
8 Videos
Similar Questions
Knowledge Check
Match the expression given in the column-I with the graphs or statement given in the column-II and select the correct option from the codes given below
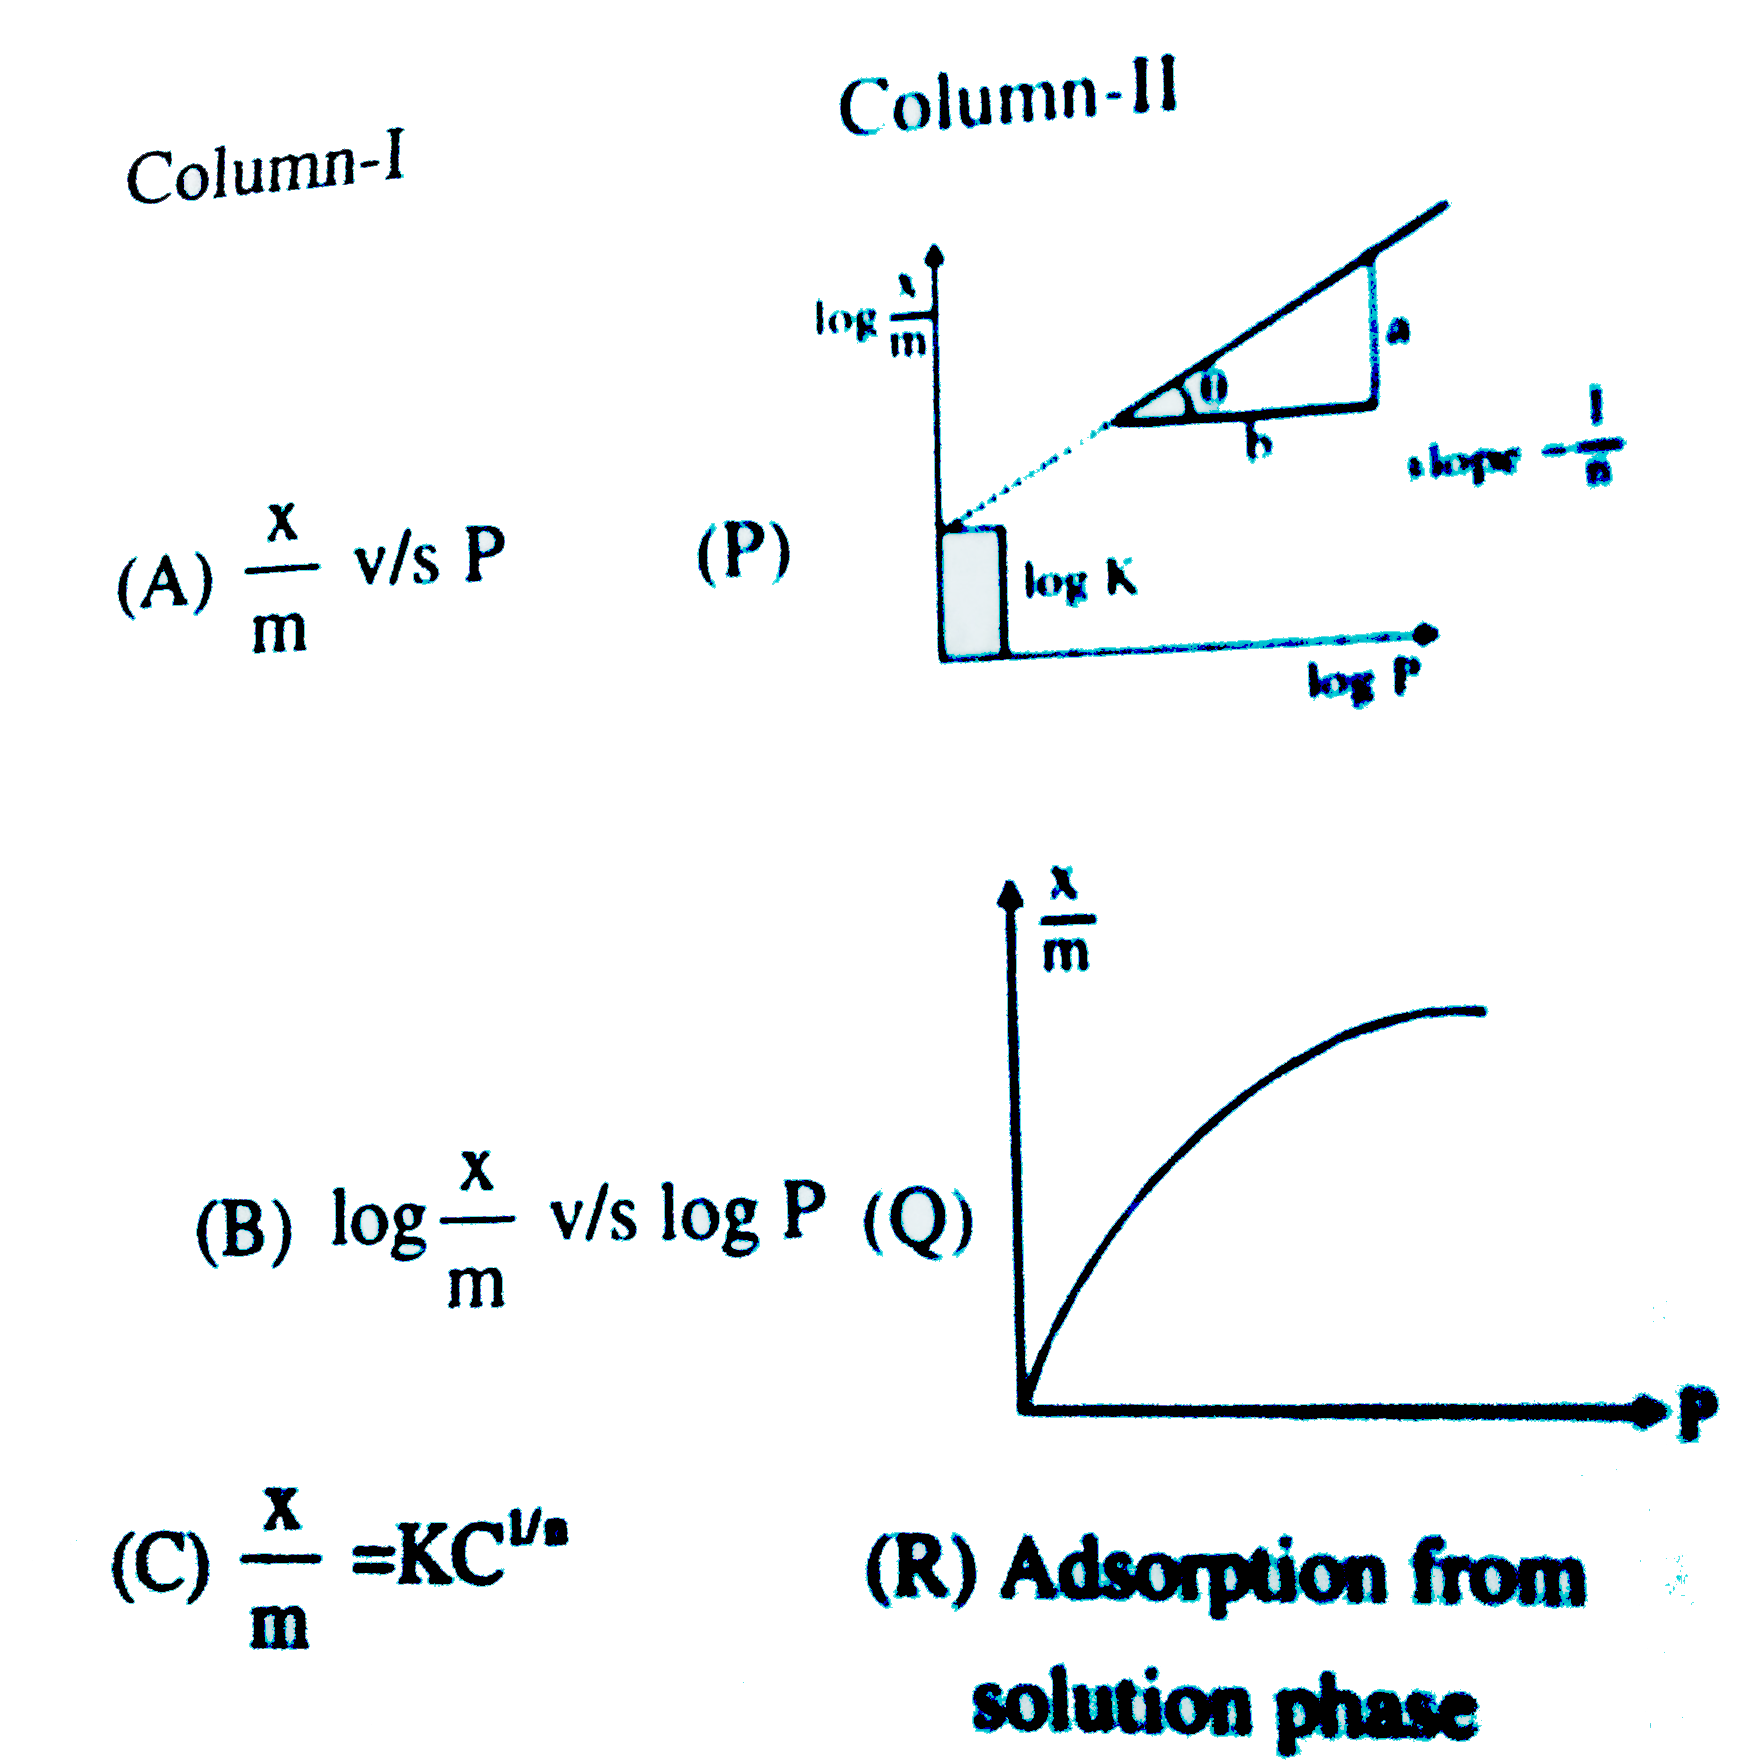 AABCPQRBABCQPRCABCRPQDABCRQP
The equation of the graph given below is
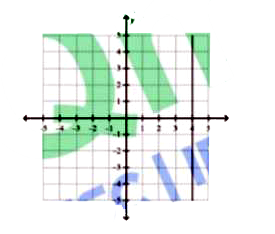 AY=4BX=4CX=−4DY=0
Study the information given in each of these question to answer the questions
Study the graph and answer the question given below-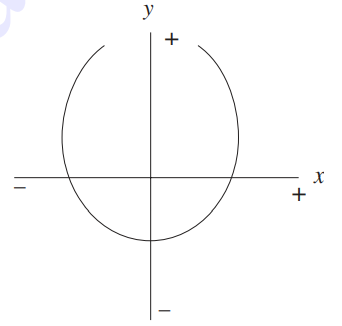
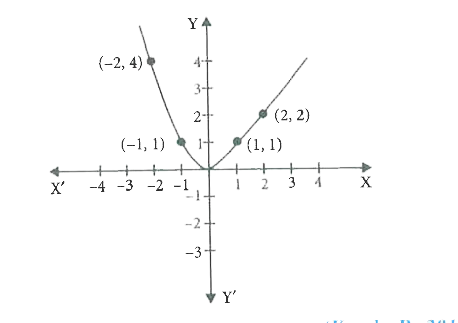
Which of the following is true about the value of x and y in the graph ?AWhen x is negative, y is also negativeBWhen x is positive, y is also negativeCFor each value of y, there are four corresponding values of xDNone of these
For the graphs given below, write down their x−y equations

View SolutionThe graph given below represents the linear equation x=3.
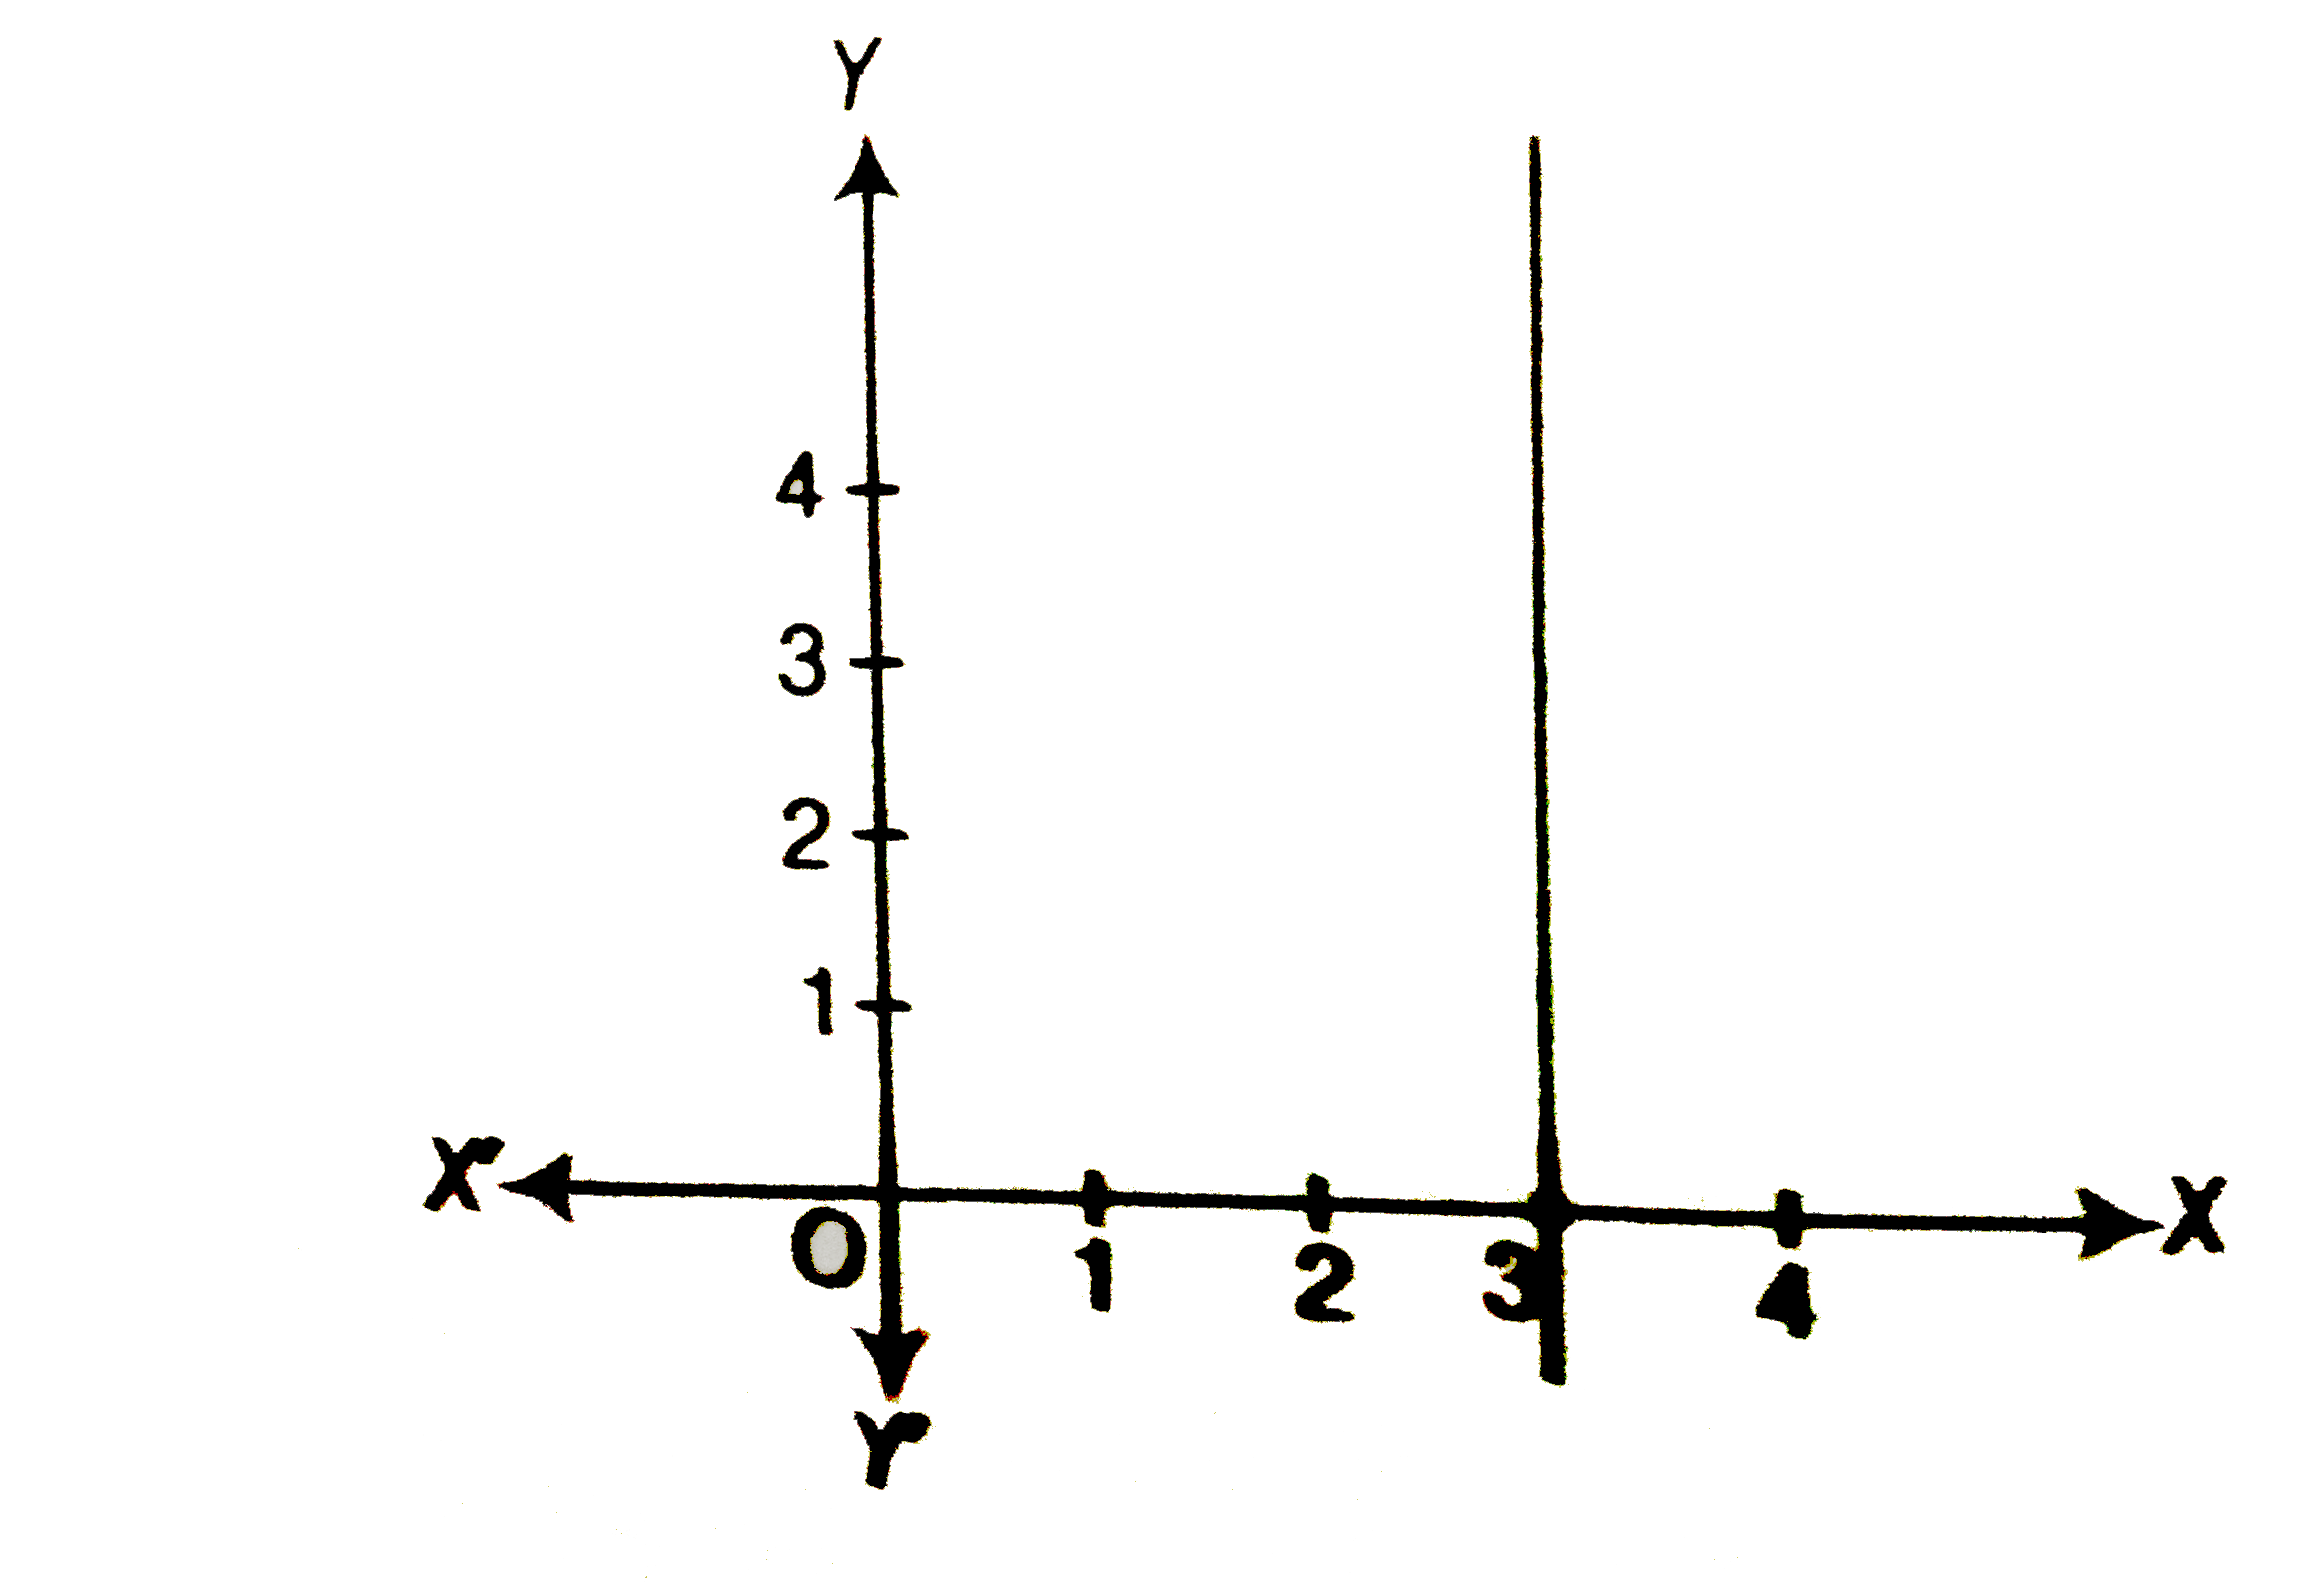
View SolutionThe graph of f is given.
State the equations of all the asymptotes.

View SolutionWrite the coordinates of all the points in the graph given below:
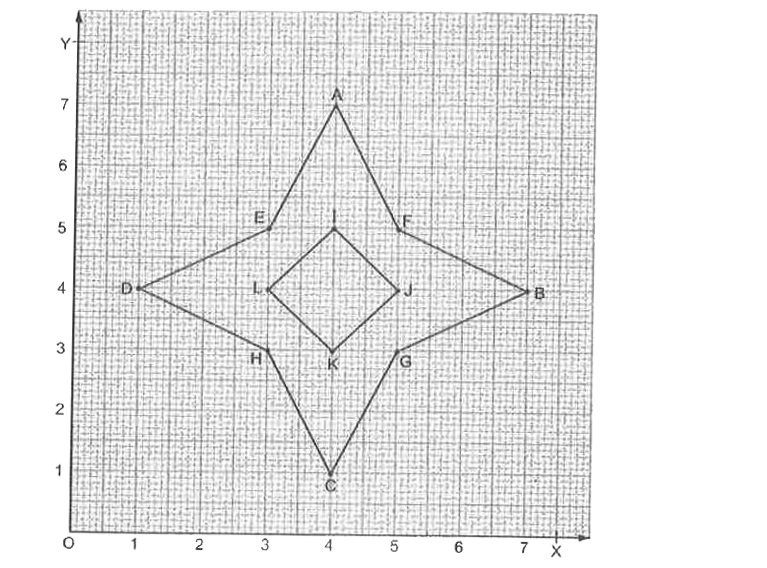
View SolutionObserve the given graph carefully and complete the table given below.
View Solution
