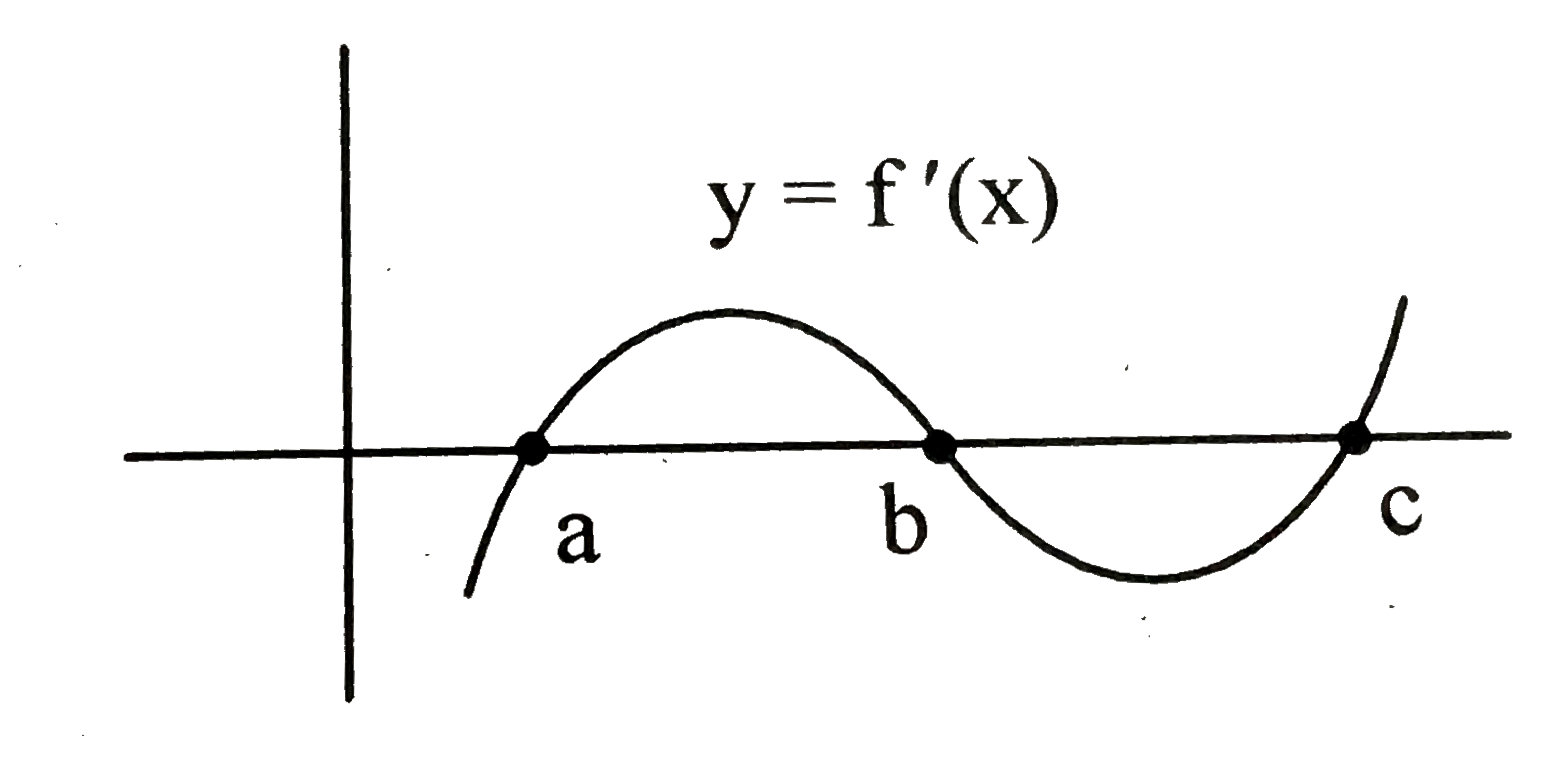
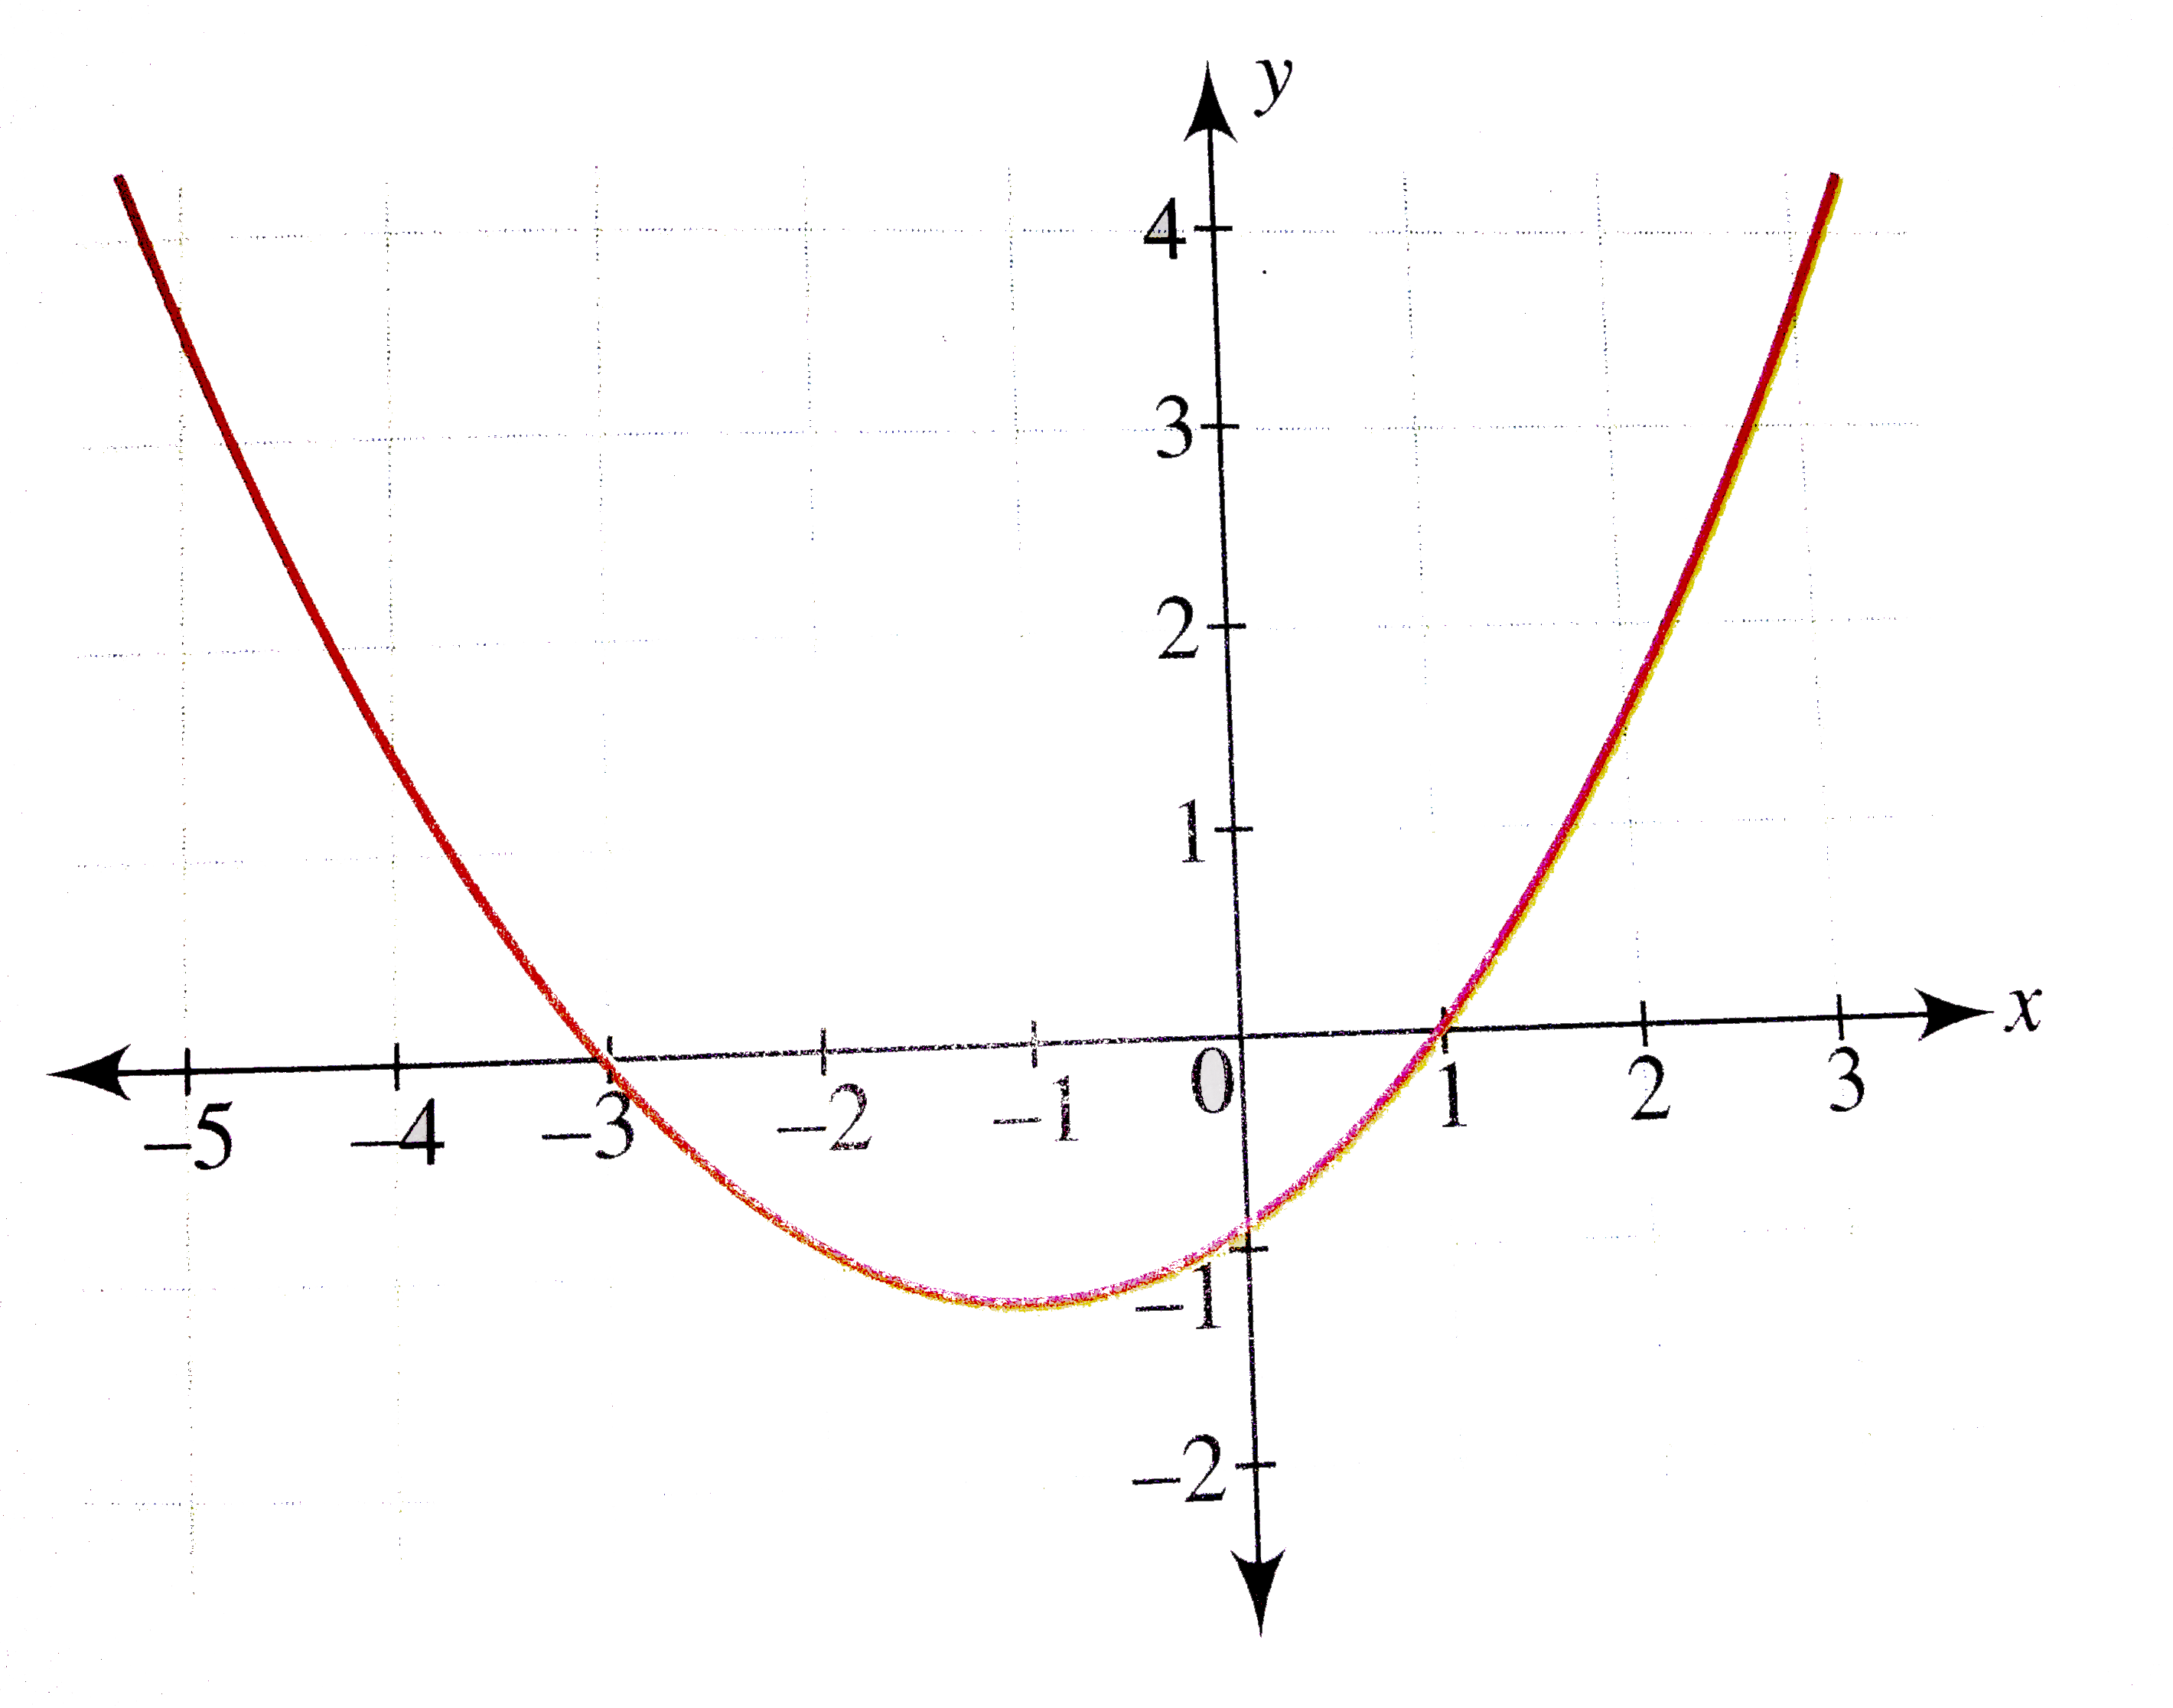
The figure shown below is the graph of the derivative of some function y=f'(x)'.
Then
f has local minima at x=a,b and a local maximum at x=c
f has local minima at x=b,c and a local maximum at x=a
f has local minima at x=c,a and a local maximum at x=b
the given figure is insufficient to conclude any thing about the local minima and local maxima of f
The correct Answer is:C
f'(a)=f'(b)=f'(c)=0
f'(a−)<0f'(a+)>0f'(c')<0f'(c+)>0]minima at a & c'
f'(b−)>0f'(b+)<0]max. at b.
Topper's Solved these Questions
Similar Questions
Knowledge Check
The figure illustrates the graph of the function y=f(x) defined in [-3, 2].
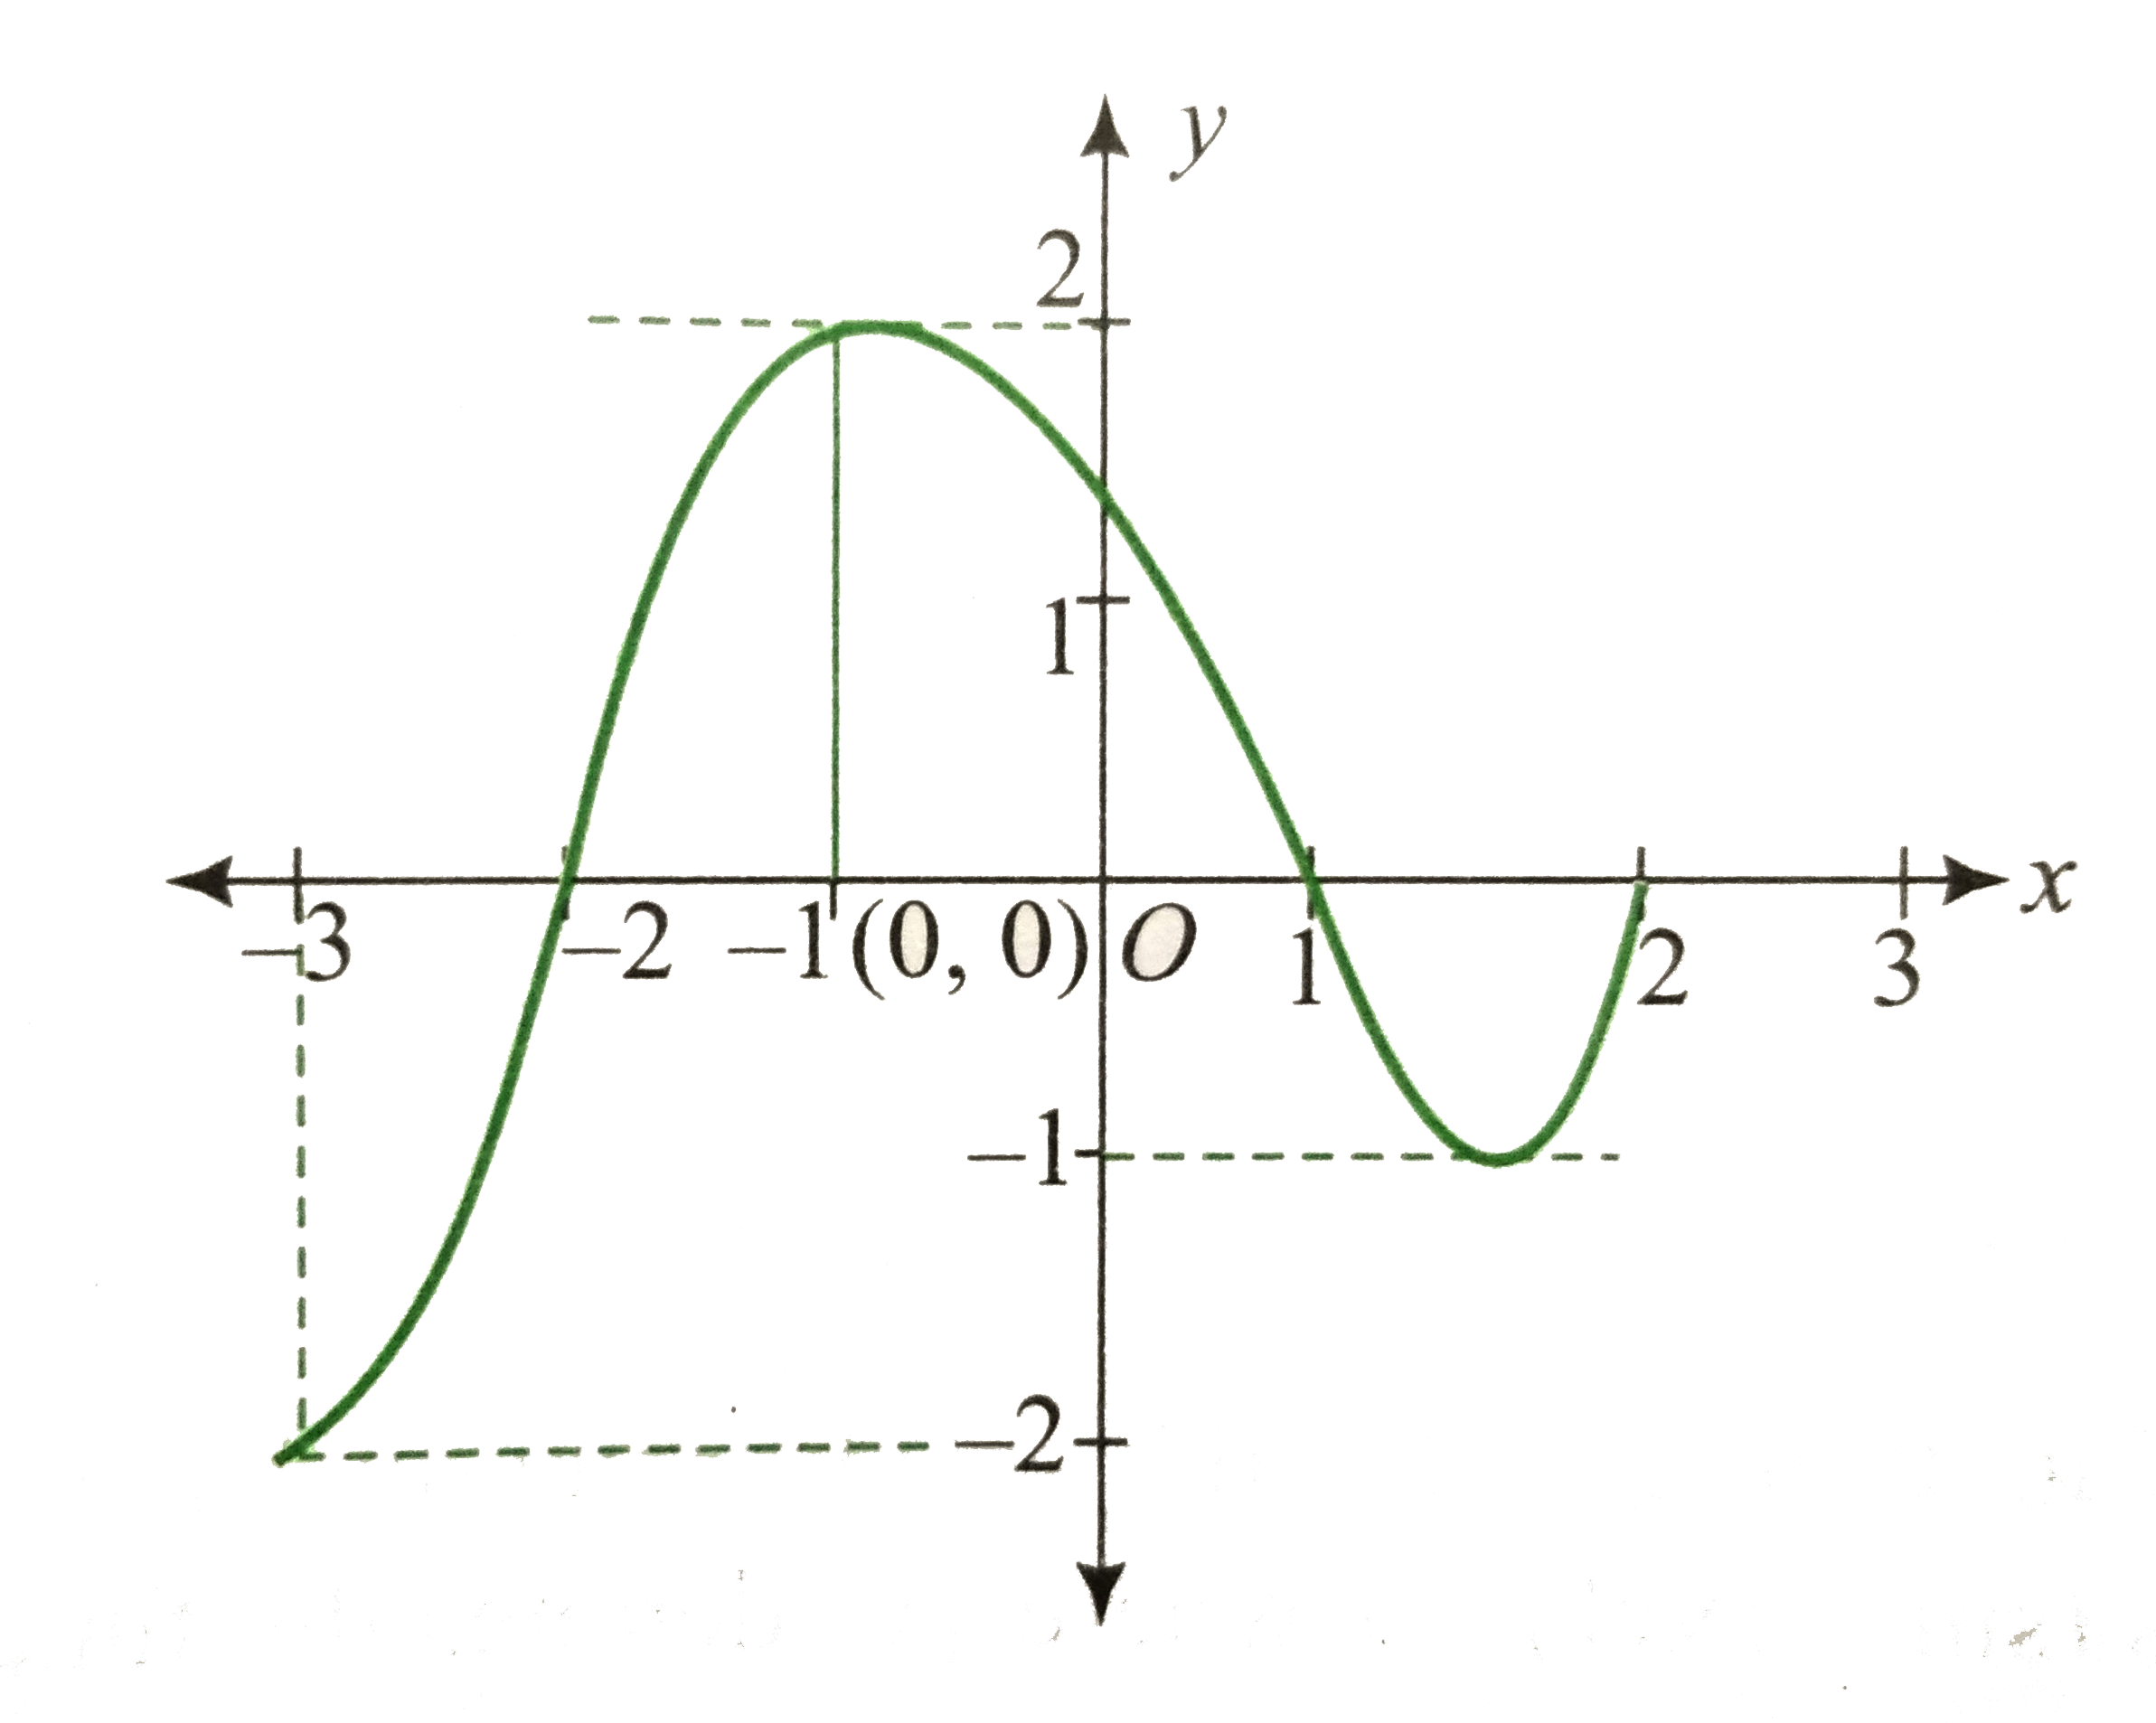
Identify the correct statement(s)?ARange of y=f(−|x|) is [−2,2]BDomain of y=f(|x|) is [−2,2]CDomain of y=f|x|+1) is [−1,1]DRange of y=f(|x|+1) is [−1,0]The graph of the function y=f(x) is symmetrical about the line x=2, then :
Af(x+2)=f(x−2)Bf(2+x)=f(2−x)Cf(x)=f(−x)Dnone of these
Given the graph of the function y=f(x), draw the graph of y=sgn(x).
View SolutionSuppose the function f(x)-f(2x) has the derivative 5 at x =1 and derivative 7 at x = 2. The derivative of the function f(x)-f(4x) at x = 1, has the value equal to
View SolutionConsider the following function f, whose graph is given below.
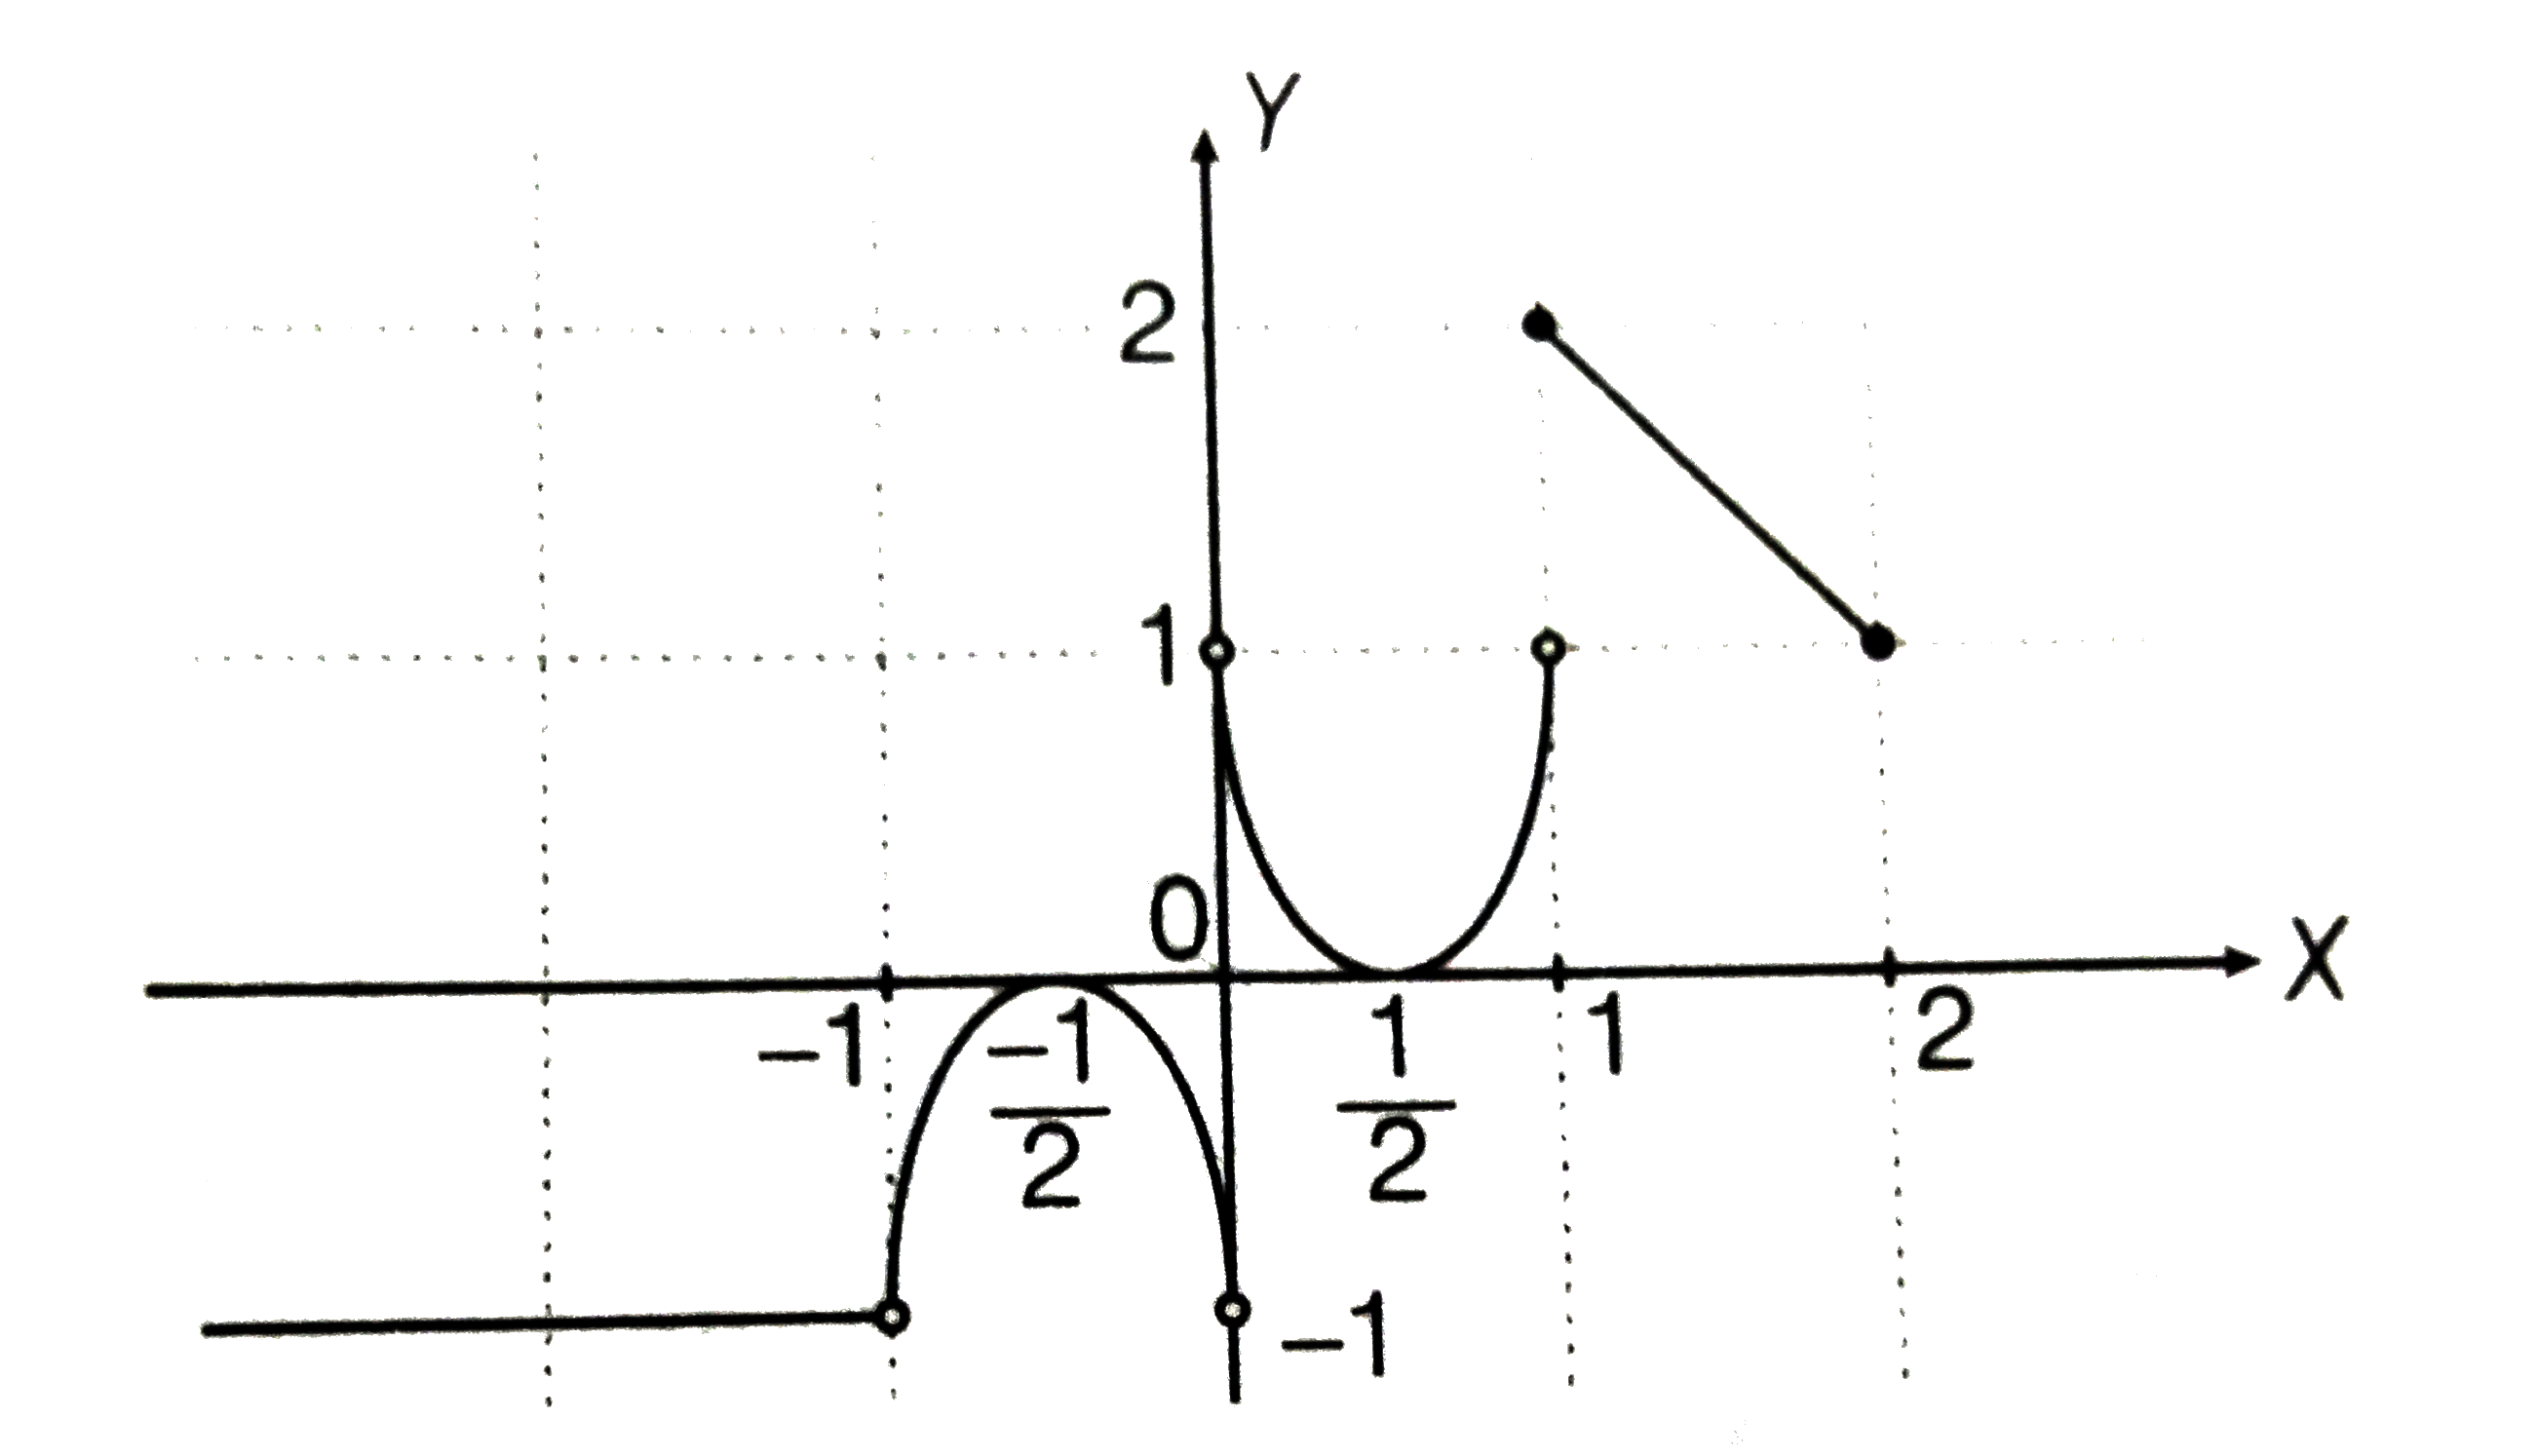
Draw the graph of the following functions.
(i) |f(x)|
(ii) f(|x|)
(iii) |f(|x|)−1|
View SolutionThe graph of the function y=f(x). Then which of the following could represent the graph of the function y=|f(x)|
View SolutionThe graph of the derivative f' of a continuous function f is shown with f(0)=0, then for f(x) find (i) Intervals of monotonicity (ii) Intervals of concavity
View SolutionThe graph of the derivative f of a continuous function f is shown with f(0)=0

If f(x) has local minima at x=x1 and x=x2,f has inflection point at x=k, number of critical points of y=f(x) is w then x1+x2−k−w is...........
View Solution


