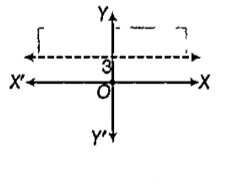
The graph of y = a is
the x-axis
the y-axis
a line parallel to the y-axis
a line parallel to the x-axis
The correct Answer is:D
To solve the question "The graph of y = a is", we will follow these steps:
Step 1: Understand the equation y = a
The equation y = a represents a horizontal line on the coordinate plane where the value of y is constant. Here, 'a' is a specific value that y takes.
Hint: Remember that in the equation y = a, 'a' can be any real number.
Step 2: Identify the axes
In the coordinate plane, we have two axes: the x-axis (horizontal) and the y-axis (vertical).
Hint: The x-axis represents all possible values of x, while the y-axis represents all possible values of y.
Step 3: Draw the axes
Draw the x-axis and the y-axis on a graph. Label the axes appropriately.
Hint: Make sure to mark equal intervals on both axes for accurate representation.
Step 4: Plot the line y = a
Since y = a is a horizontal line, you will plot a straight line that runs parallel to the x-axis at the height 'a' on the y-axis. For example, if a = 3, you would draw a line that crosses the y-axis at the point (0, 3).
Hint: The line will not change as you move along the x-axis; it will always stay at the same height 'a'.
Step 5: Label the graph
Label the line as y = a to indicate that it represents the equation you started with.
Hint: Clear labeling helps in understanding the graph better.
Final Solution:
The graph of y = a is a horizontal line that runs parallel to the x-axis at the height 'a' on the y-axis.
---
The equation y = a represents a horizontal line on the coordinate plane where the value of y is constant. Here, 'a' is a specific value that y takes.
In the coordinate plane, we have two axes: the x-axis (horizontal) and the y-axis (vertical).
Draw the x-axis and the y-axis on a graph. Label the axes appropriately.
Since y = a is a horizontal line, you will plot a straight line that runs parallel to the x-axis at the height 'a' on the y-axis. For example, if a = 3, you would draw a line that crosses the y-axis at the point (0, 3).
Label the line as y = a to indicate that it represents the equation you started with.
The graph of y = a is a horizontal line that runs parallel to the x-axis at the height 'a' on the y-axis.
Topper's Solved these Questions
- INTRODUCTION TO COORDINATE GEOMETRYBOOK - RS AGGARWALCHAPTER - INTRODUCTION TO COORDINATE GEOMETRYEXERCISE - EXERCISE A
13 Videos
- FACTORISATION BOOK - RS AGGARWALCHAPTER - FACTORISATION EXERCISE - EXERCISE 7E
20 Videos
- LINE GRAPHS AND LINEAR GRAPHSBOOK - RS AGGARWALCHAPTER - LINE GRAPHS AND LINEAR GRAPHSEXERCISE - Exercise 23
25 Videos
Similar Questions
Knowledge Check
The graph of y=5 is a line
Amaking an intercept 5 on the x−axisBmaking an intercept 5 on the y− axisCparallel to the x−axis at a distance of 5 units from the originDparallel to the y−axis at a distance fo 5 units from the originThe graph of y=6 is a line
Aparallel to X-axis at a distance 6 units from the originBparallel to Y-axis at a distance 6 units from the originCmaking an intercept 6 on the X-axisDmaking an intercept 6 on both axesThe graph of y<3 is
A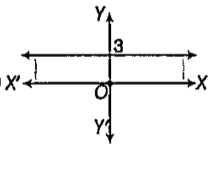 B
B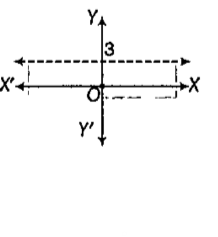 C
C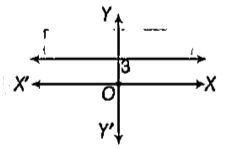 D
D