Which graph represents the uniform acceleration
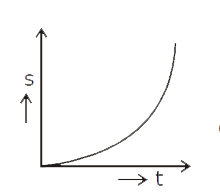
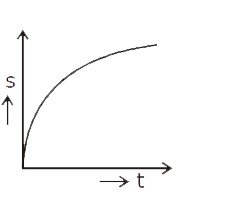
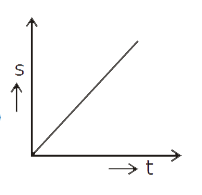
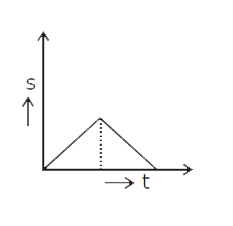
The correct Answer is:A
Step by step video, text & image solution for Which graph represents the uniform acceleration by Physics experts to help you in doubts & scoring excellent marks in Class 12 exams.
Updated on:21/07/2023Topper's Solved these Questions
- ONE DIMENSION MOTIONBook:MOTIONChapter:ONE DIMENSION MOTIONExercise:EXERCSE -2 (A : Distance, Displacement, Velocity and Acceleration, Equation of Motion)
Explore 16 Videos
- ONE DIMENSION MOTIONBook:MOTIONChapter:ONE DIMENSION MOTIONExercise:EXERCSE -2 (Section - B : Motion under Gravity)
Explore 8 Videos
- ONE DIMENSION MOTIONBook:MOTIONChapter:ONE DIMENSION MOTIONExercise:EXERCSE -1 (Section - E : River Boat Problems )
Explore 1 Video
- NLM & FRICTIONBook:MOTIONChapter:NLM & FRICTIONExercise:EXERCISE-4 ( LEVEL-II)
Explore 15 Videos
- OPTICSBook:MOTIONChapter:OPTICSExercise:Exercise
Explore 45 Videos
Similar Questions
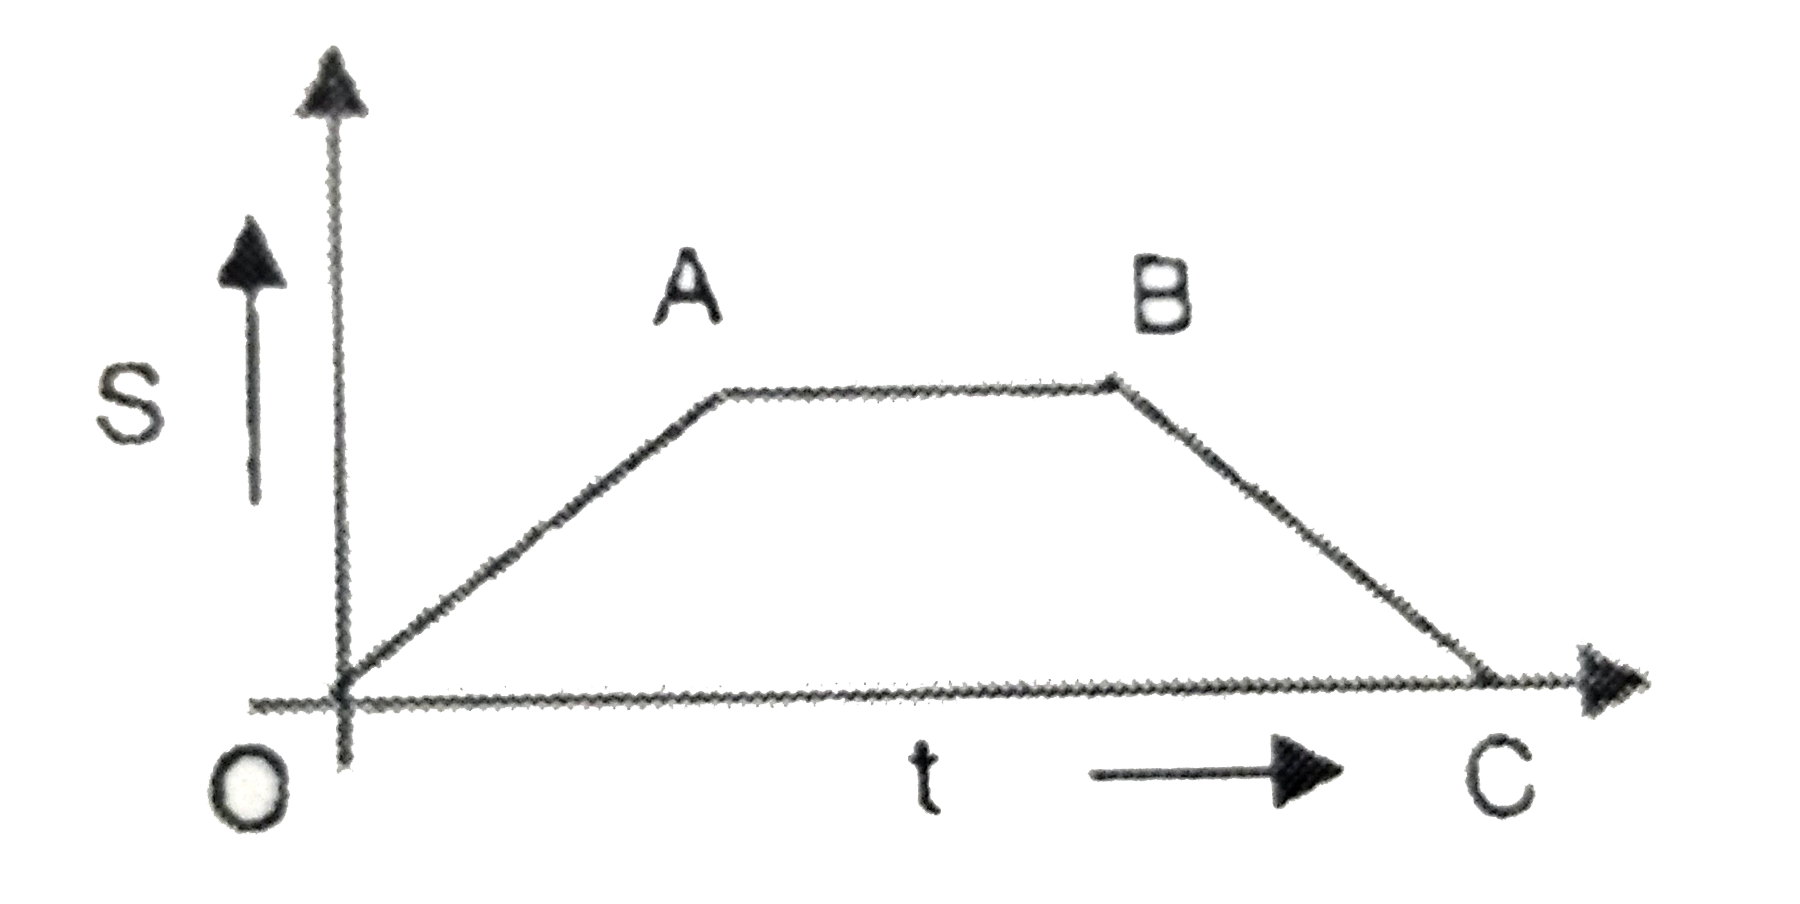
The displacement-time graph of a body is shown in the figure below. The part of the graph that represents the uniform motion of the body is _________
View SolutionGraphs are very useful to represent a physical situation. Various quantities can be easily represented on graphs and other quantites can be determined from the graph. For example the slope of velocity-time graph represents instantaneous acceleration. For a motion with constant acceleration slope of velocity-time graph is constant. If acceleration is changing with time, slope with change and thus velocity-time graph will be a non-linear curve. Further the area of velocity-time graph gives displacement.
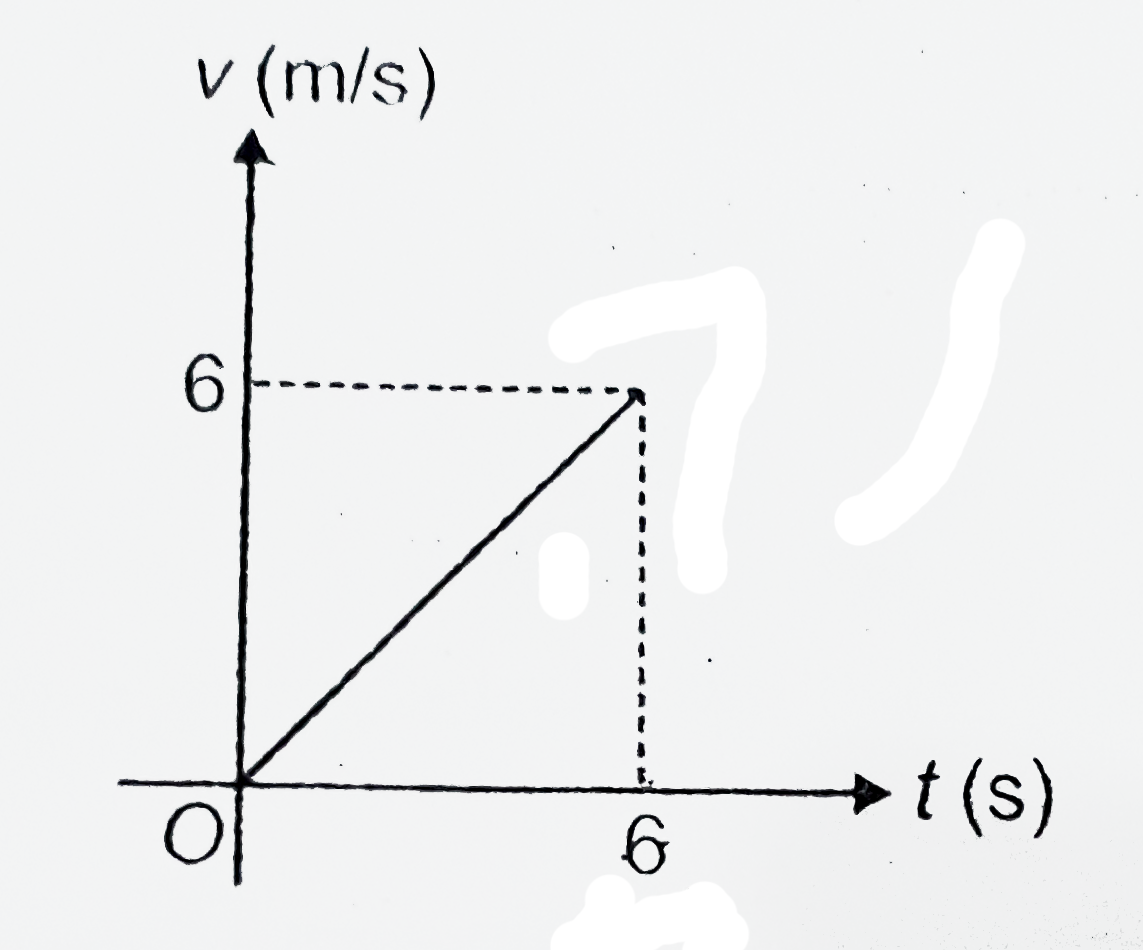
For the given velocity-time graph the fisplacement of the object vetween t = 2 s to t = 4 s is
View Solution
Knowledge Check
Which graph represents positive acceleration ?
A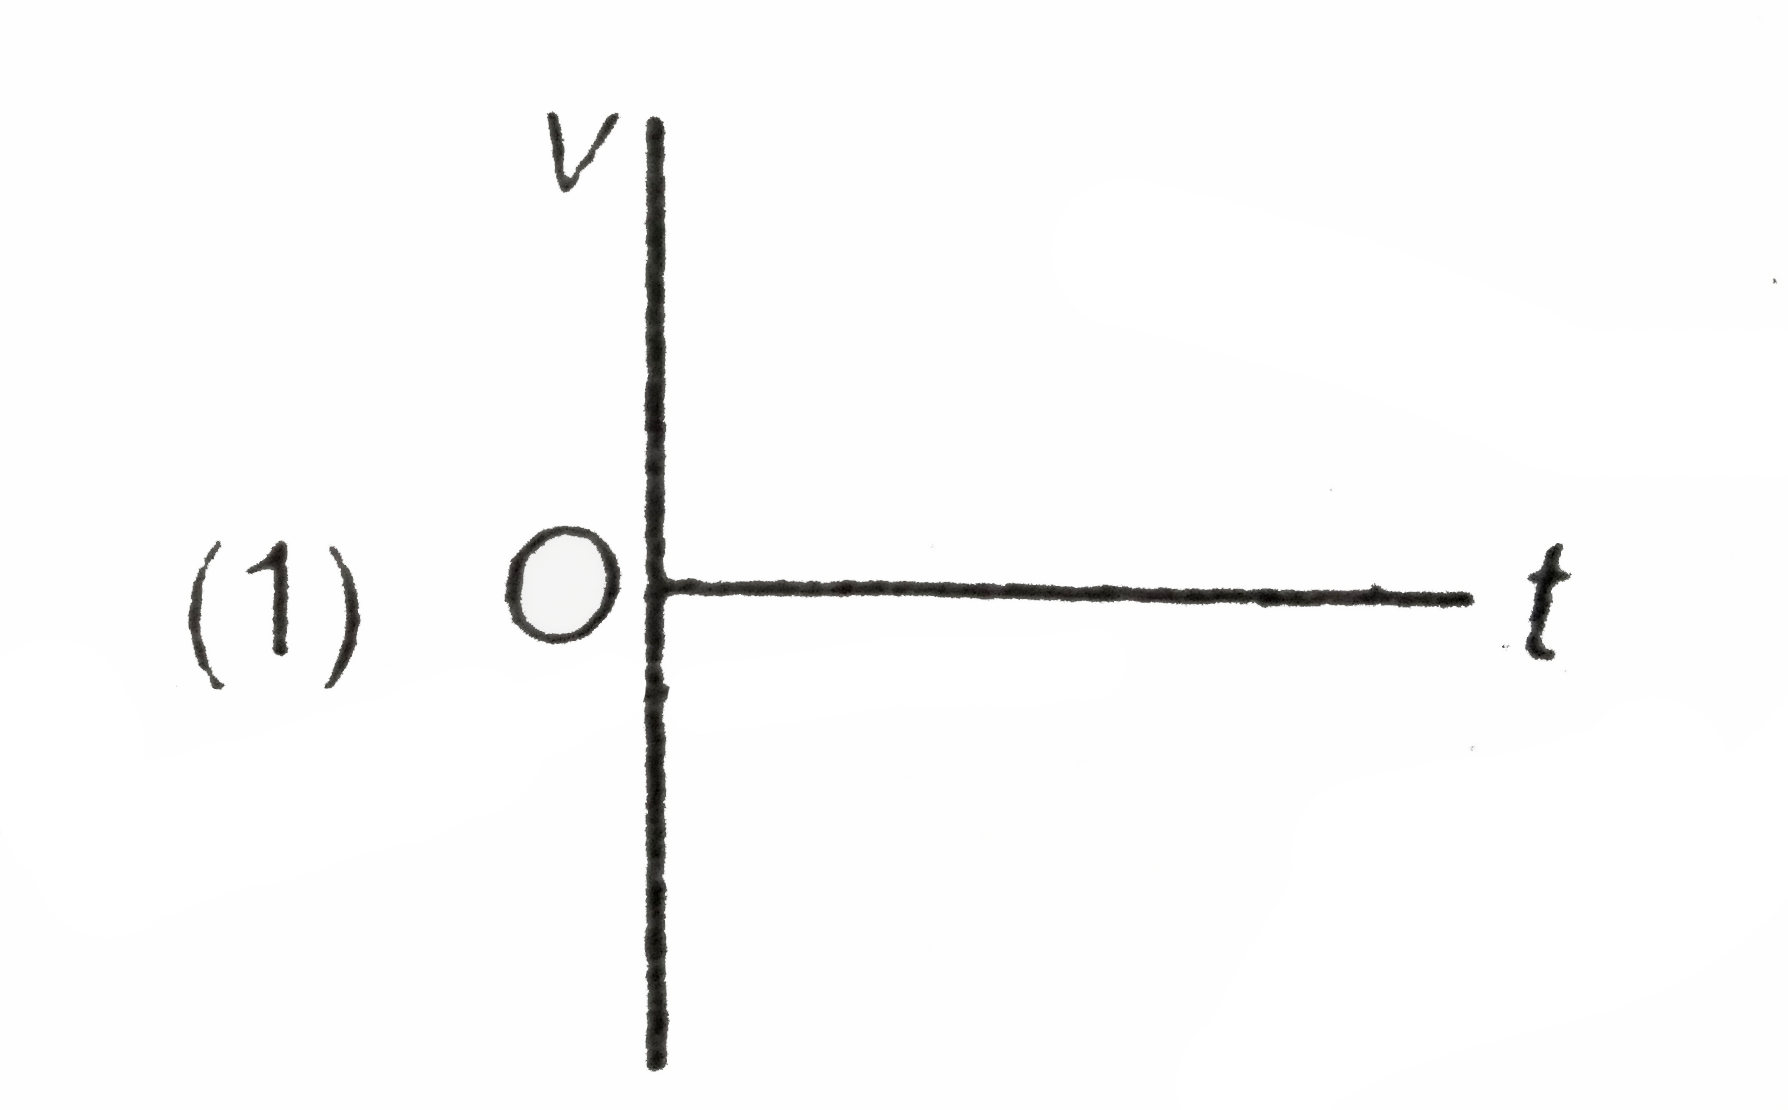 B
B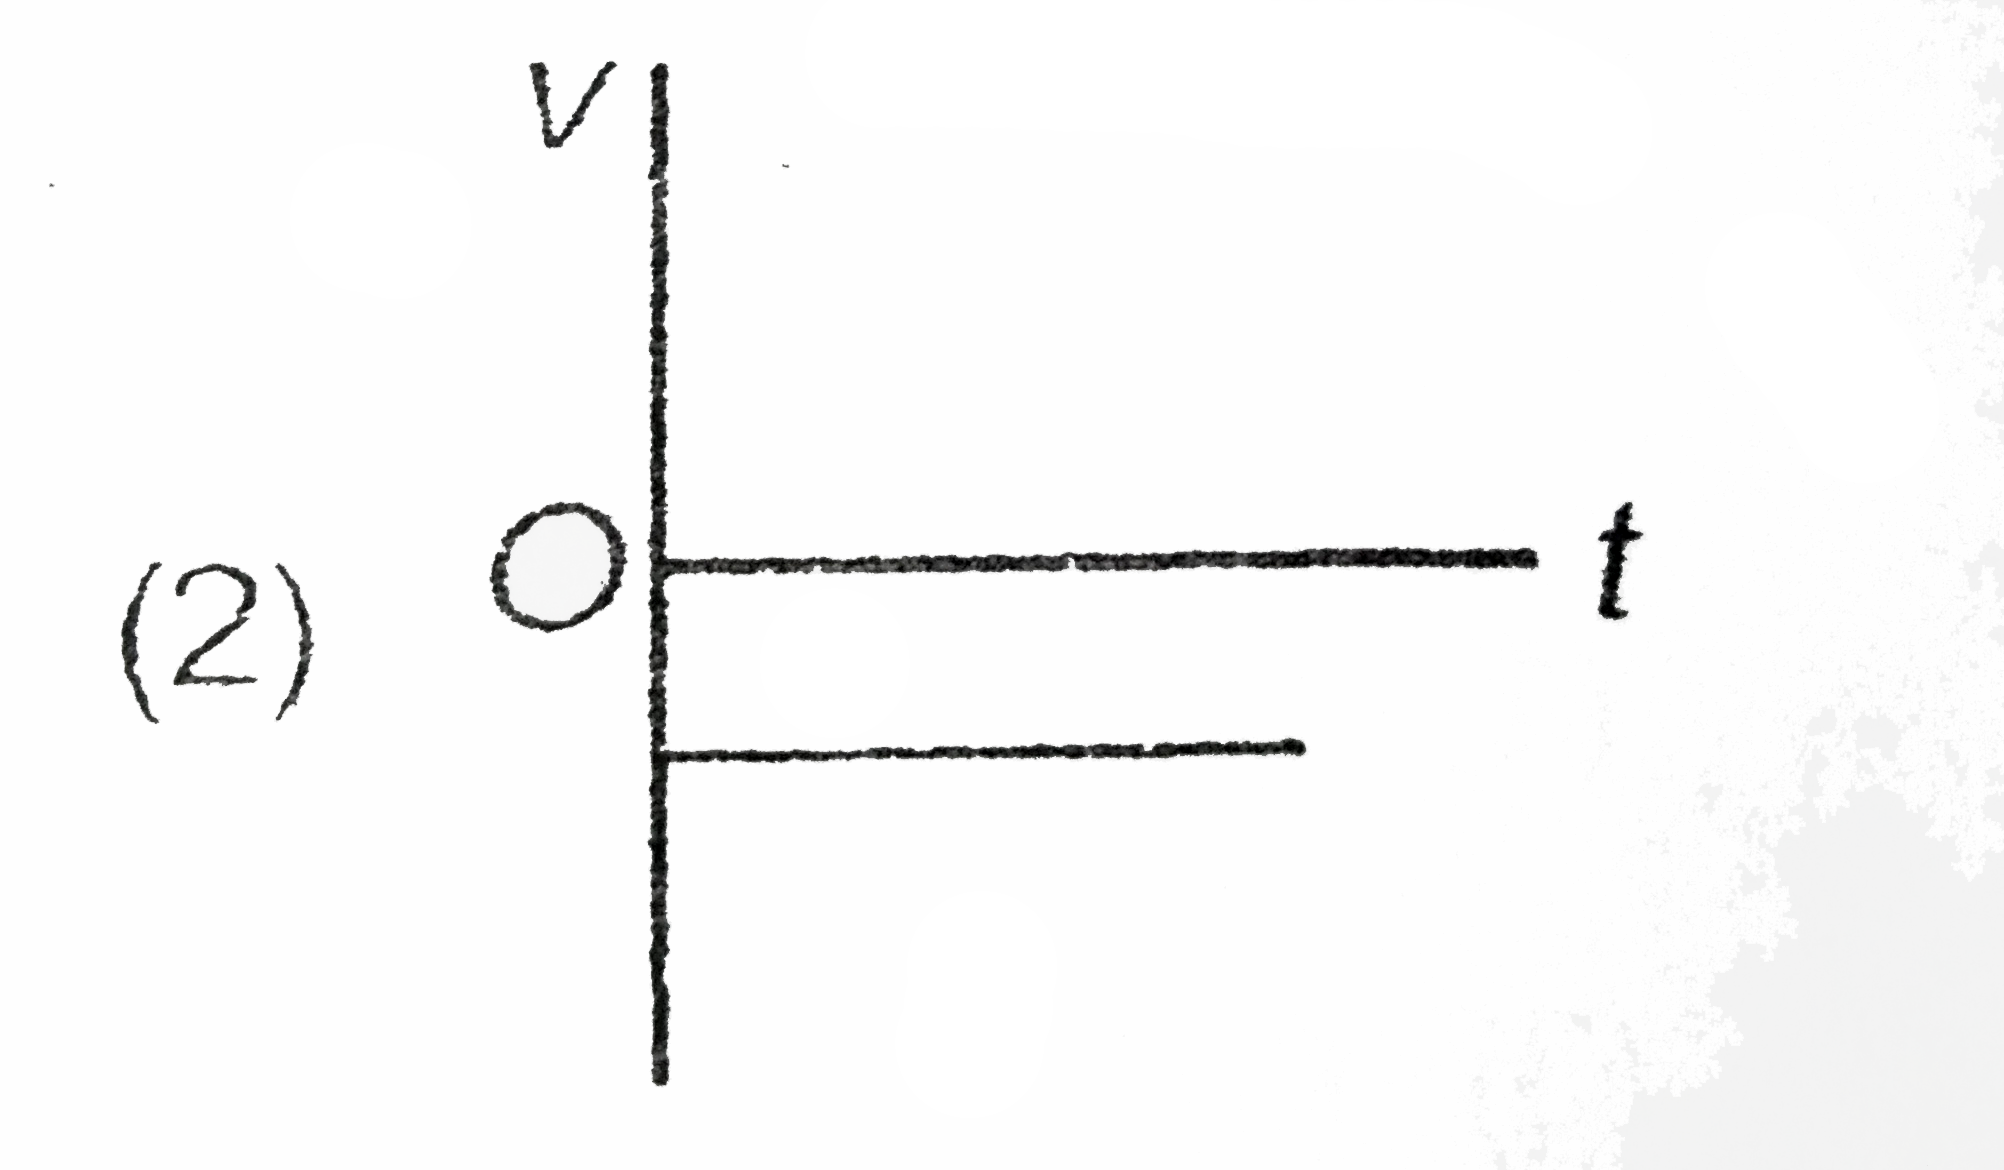 C
C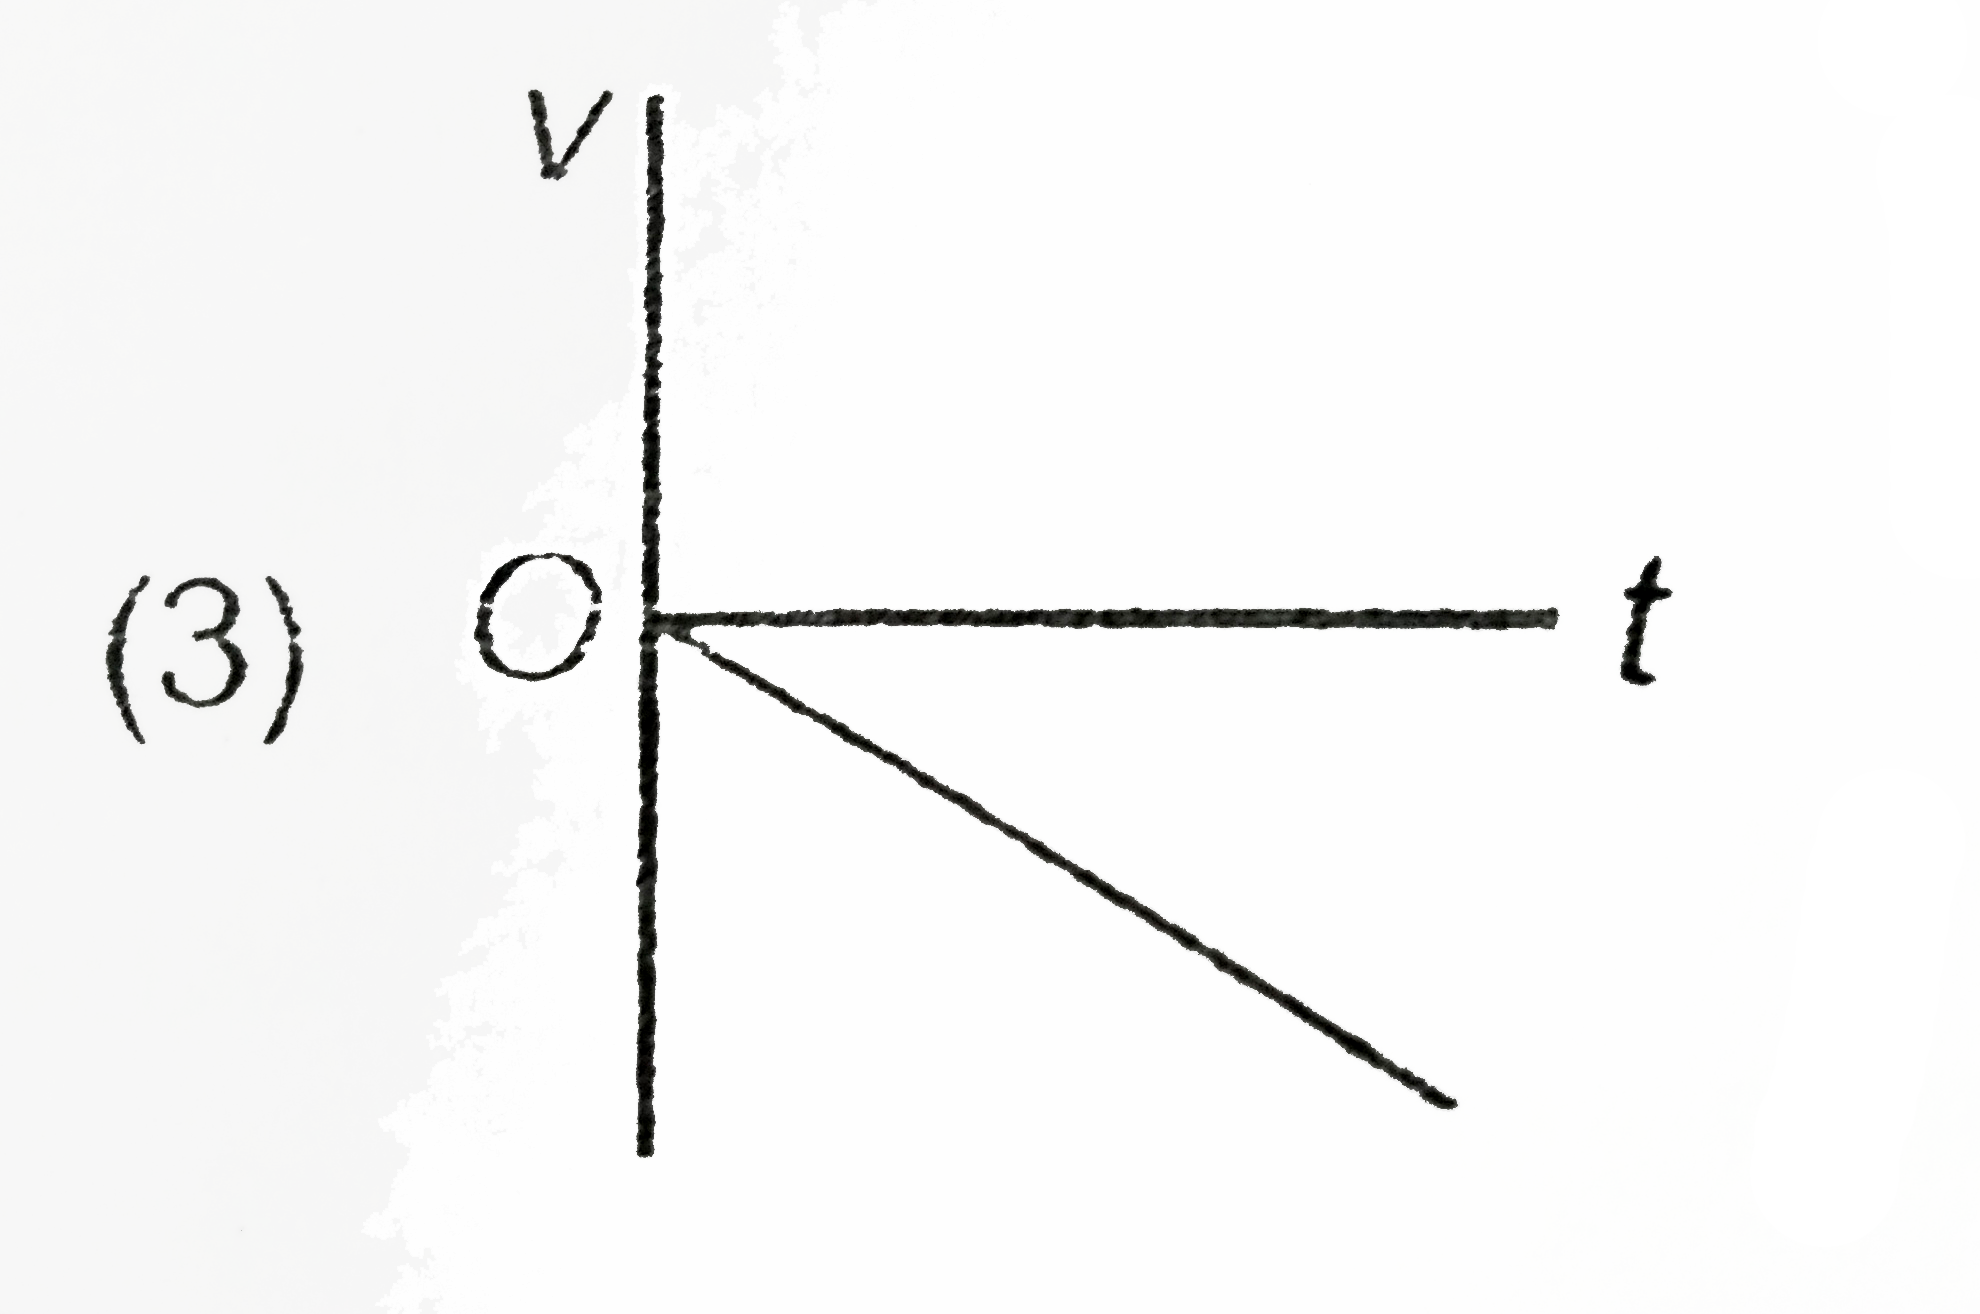 D
D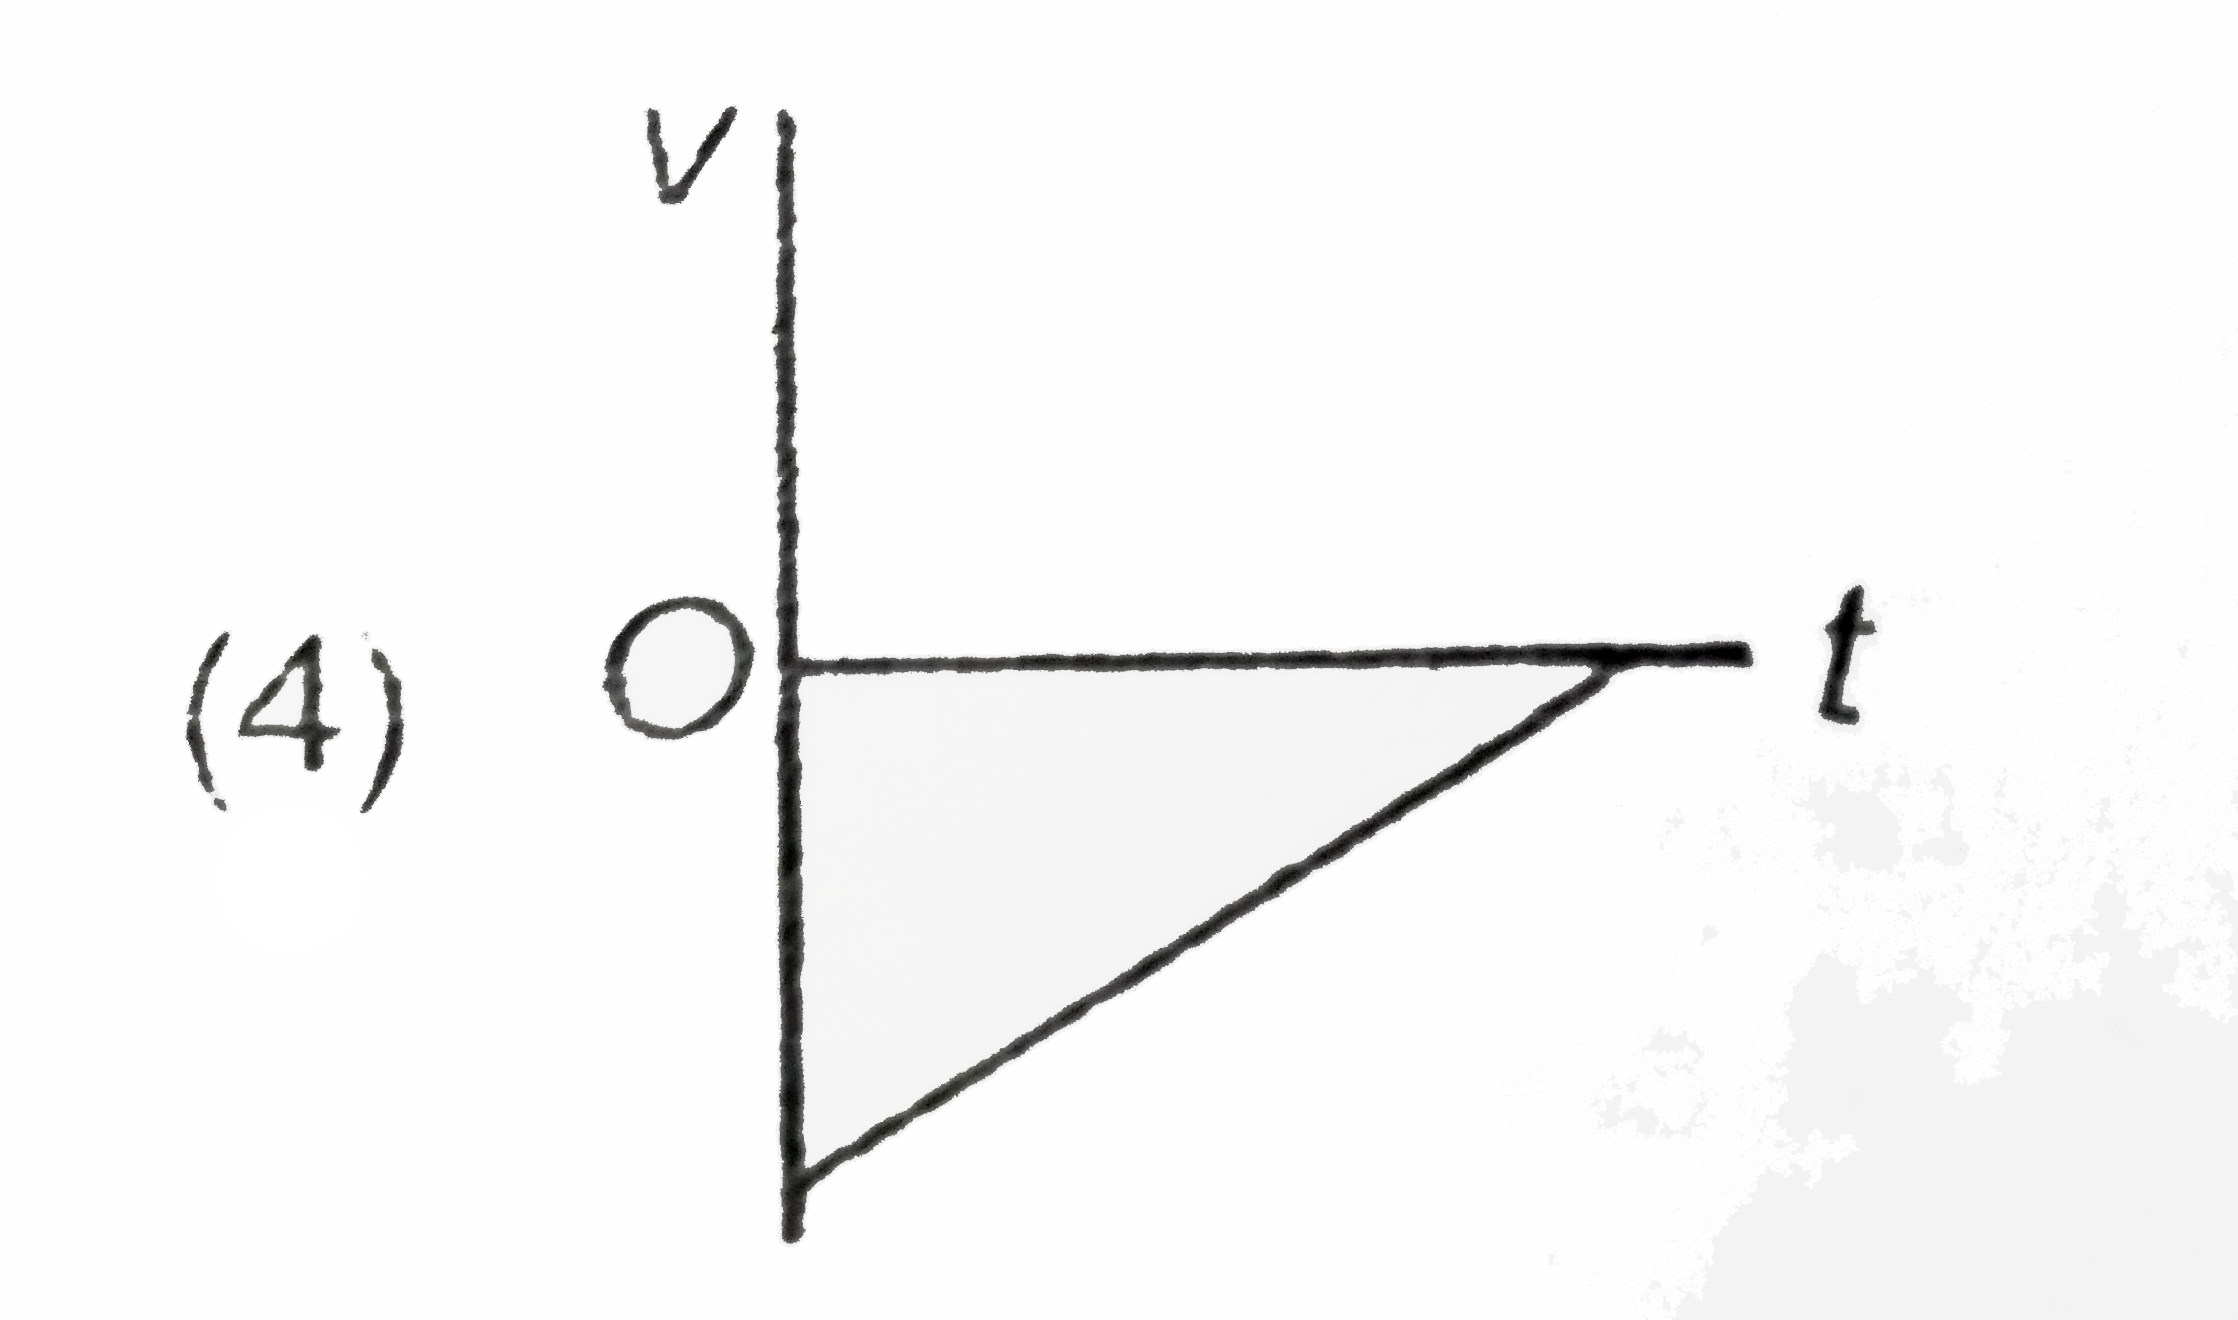
Which of the following graphs represent a uniformaly accelerated motion ?
A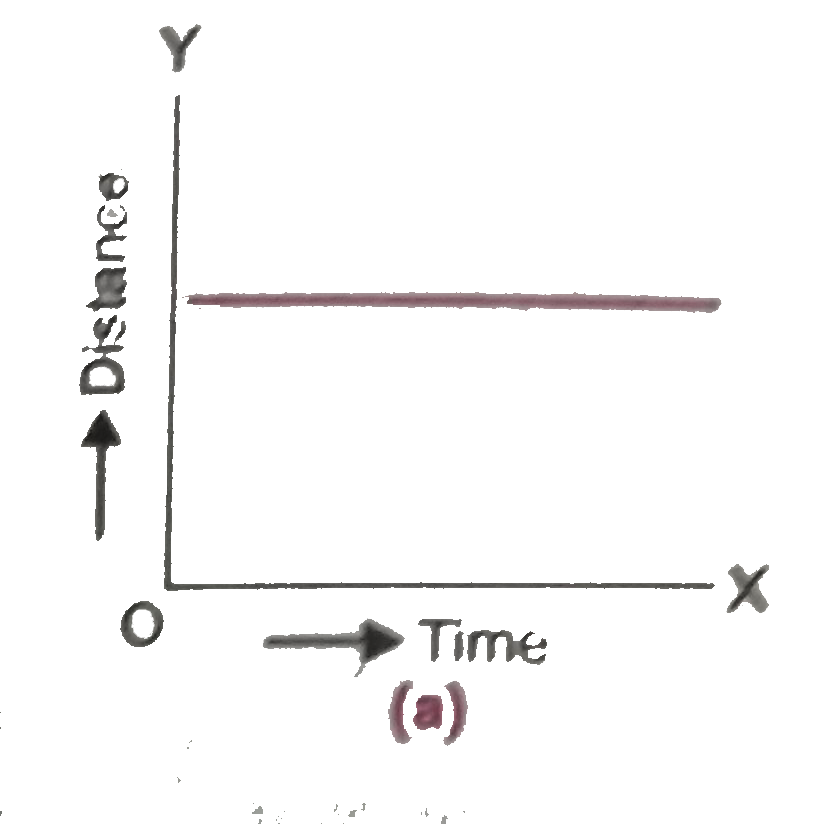 B
B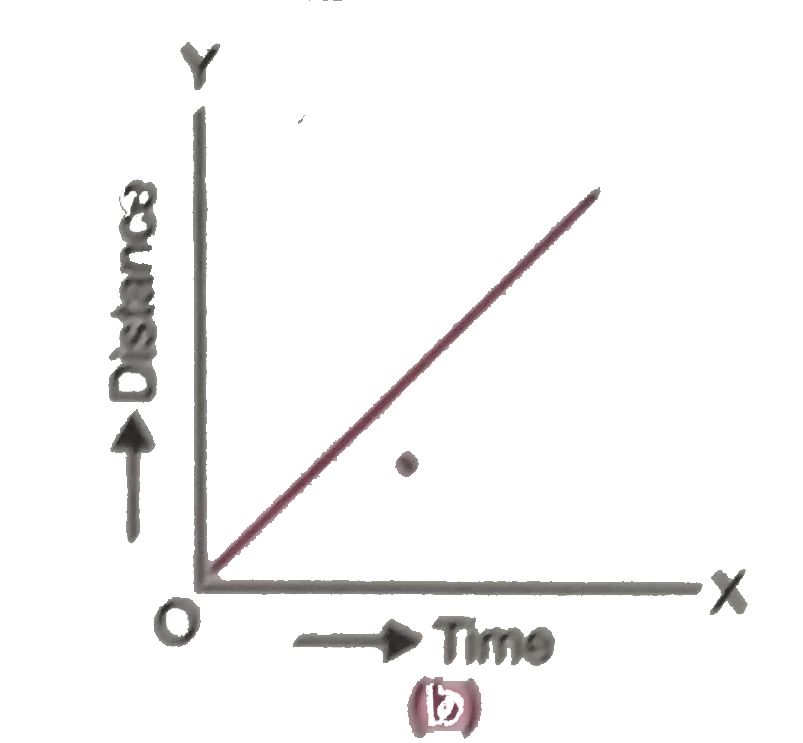 C
C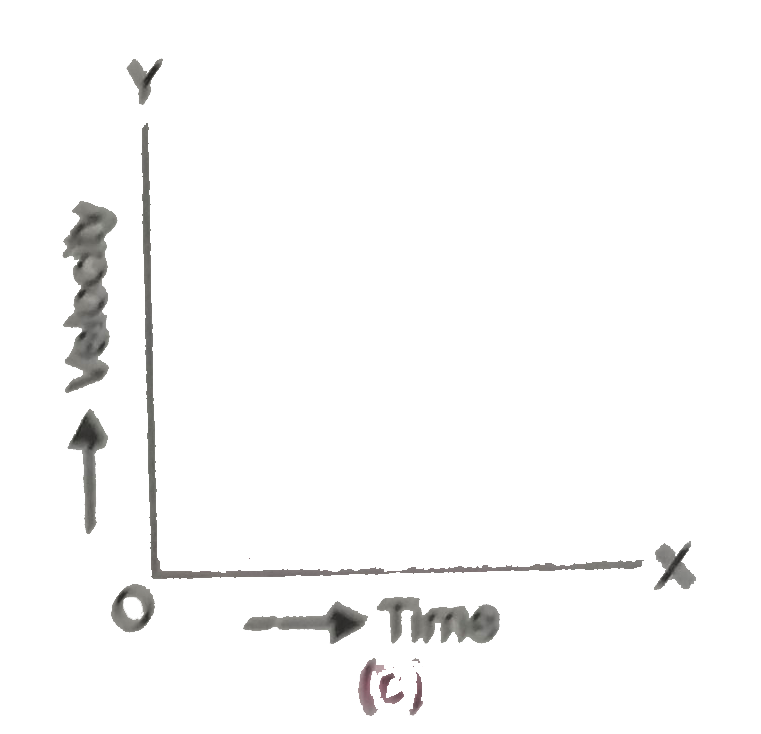 D
D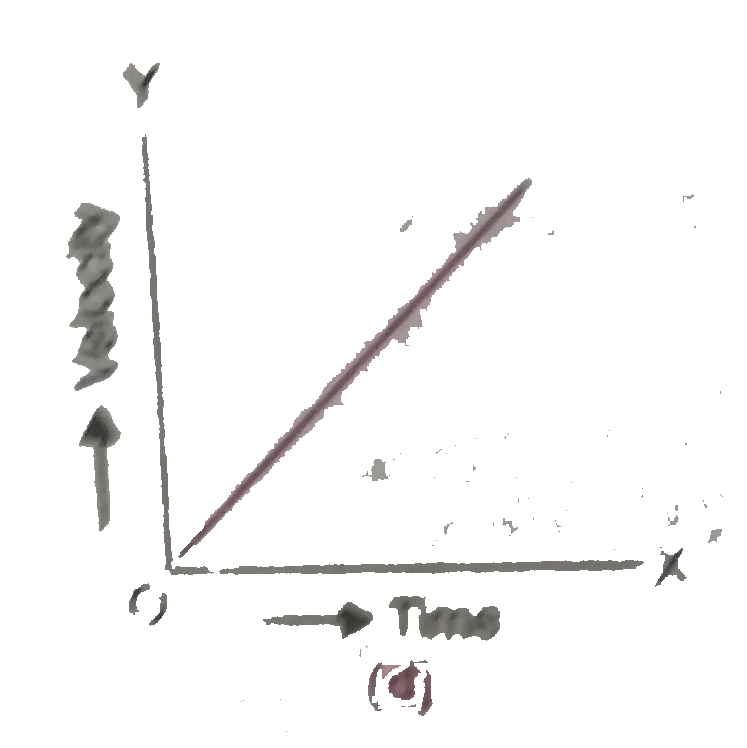
The graph below shws the velocity versus time graph for a body
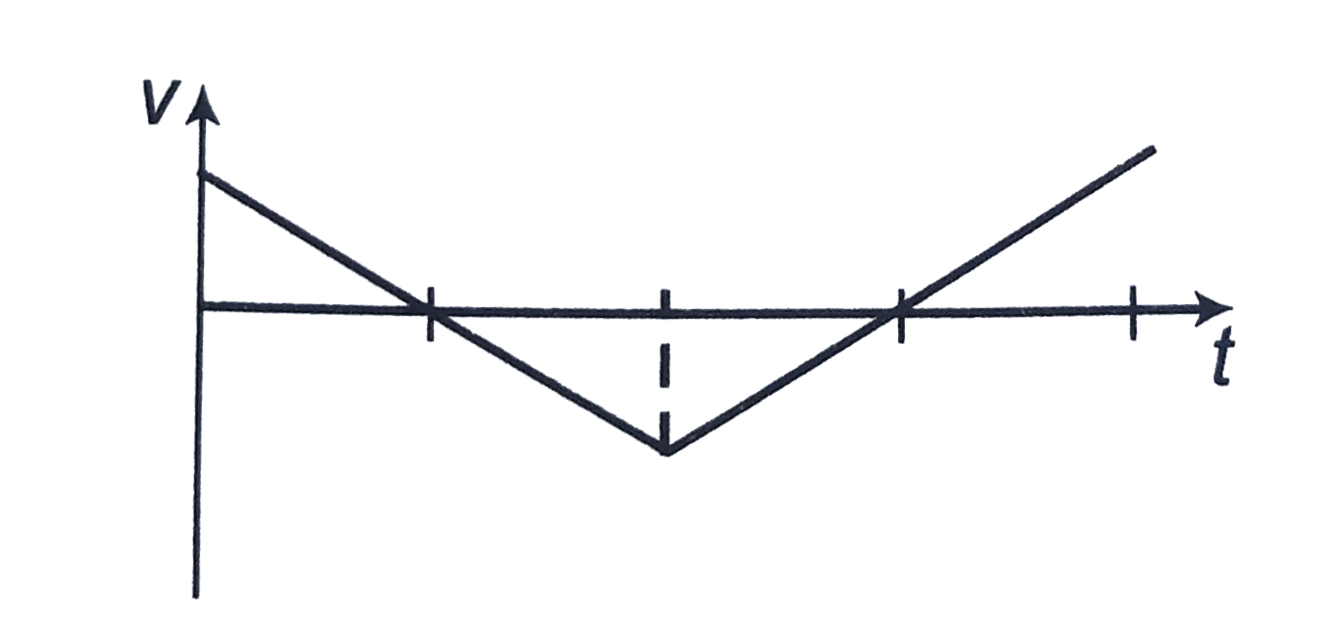
Which of the following graph represents the corresponding acceleration v//s time graph?A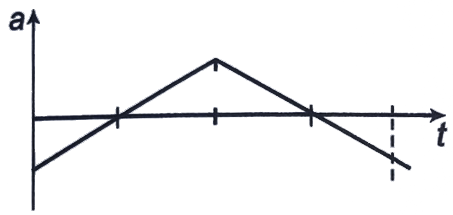 B
B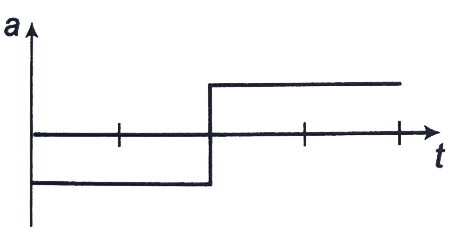 C
C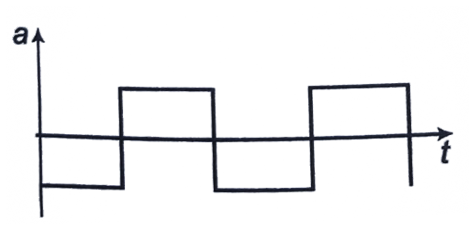 D
D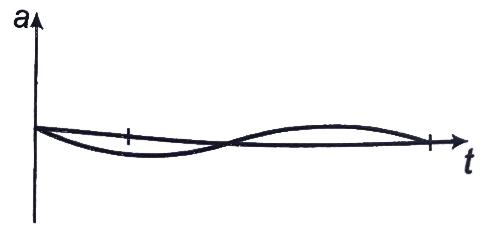
Speed - time graph for a car is show in the fig 1.13:Which part of the graph represents uniform motion of the car ?
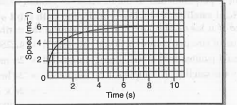
View SolutionWhich of the following graph represents uniform motion
View SolutionGraphs are very useful to represent a physical situation. Various quantities can be easily represented on graphs and other quantites can be determined from the graph. For example the slope of velocity-time graph represents instantaneous acceleration. For a motion with constant acceleration slope of velocity-time graph is constant. If acceleration is changing with time, slope with change and thus velocity-time graph will be a non-linear curve. Further the area of velocity-time graph gives displacement.
The average velocity of the car for the entire trip is
View SolutionGraphs are very useful to represent a physical situation. Various quantities can be easily represented on graphs and other quantites can be determined from the graph. For example the slope of velocity-time graph represents instantaneous acceleration. For a motion with constant acceleration slope of velocity-time graph is constant. If acceleration is changing with time, slope with change and thus velocity-time graph will be a non-linear curve. Further the area of velocity-time graph gives displacement.
The correct relation between v0,a1,a2andt0 is
View SolutionWhich of the following velocity-time graphs (v−tgraph) represent uniform motion
View Solution

