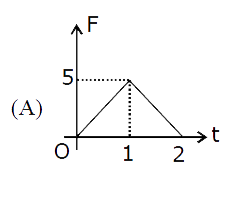
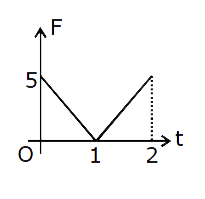
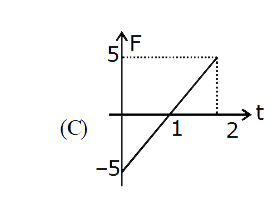
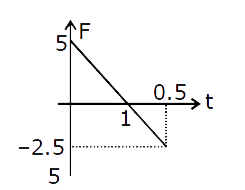
In which of the following graphs, the total change in momentum is zero ?
The correct Answer is:C
To determine in which of the given graphs the total change in momentum is zero, we can follow these steps:
Step 1: Understand the relationship between force and momentum
The change in momentum (Δp) is related to the force (F) applied over time (t) by the equation:
F=dpdt
This means that the force is equal to the rate of change of momentum with respect to time.
Step 2: Integrate the force over time
To find the total change in momentum, we need to integrate the force with respect to time:
Δp=∫Fdt
The result of this integration gives us the area under the force-time graph.
Step 3: Analyze the area under the graph
- If the area under the force-time graph is positive, it indicates a positive change in momentum.
- If the area is negative, it indicates a negative change in momentum.
- If the total area (considering positive and negative areas) is zero, then the total change in momentum is also zero.
Step 4: Evaluate the given graphs
We need to look at each graph and calculate the areas:
1. Graph A: If the area is entirely above the x-axis, the total change in momentum is positive.
2. Graph B: If the area is also entirely above the x-axis, the total change in momentum is positive.
3. Graph C: If there are equal areas above and below the x-axis, the total area sums to zero, indicating that the total change in momentum is zero.
4. Graph D: If the area is entirely below the x-axis, the total change in momentum is negative.
Step 5: Conclusion
From the analysis, the graph where the total change in momentum is zero is Graph C, as it has equal positive and negative areas that cancel each other out.
Final Answer
The total change in momentum is zero in Graph C.
---
The change in momentum (Δp) is related to the force (F) applied over time (t) by the equation:
F=dpdt
This means that the force is equal to the rate of change of momentum with respect to time.
To find the total change in momentum, we need to integrate the force with respect to time:
Δp=∫Fdt
The result of this integration gives us the area under the force-time graph.
- If the area under the force-time graph is positive, it indicates a positive change in momentum.
- If the area is negative, it indicates a negative change in momentum.
- If the total area (considering positive and negative areas) is zero, then the total change in momentum is also zero.
We need to look at each graph and calculate the areas:
1. Graph A: If the area is entirely above the x-axis, the total change in momentum is positive.
2. Graph B: If the area is also entirely above the x-axis, the total change in momentum is positive.
3. Graph C: If there are equal areas above and below the x-axis, the total area sums to zero, indicating that the total change in momentum is zero.
4. Graph D: If the area is entirely below the x-axis, the total change in momentum is negative.
From the analysis, the graph where the total change in momentum is zero is Graph C, as it has equal positive and negative areas that cancel each other out.
The total change in momentum is zero in Graph C.
Topper's Solved these Questions
- NEWTON'S LAWS OF MOTION & FRICTION BOOK - MOTIONCHAPTER - NEWTON'S LAWS OF MOTION & FRICTION EXERCISE - Exercise - 1 SECTION-B :- Pulley Block System
12 Videos
- NEWTON'S LAWS OF MOTION & FRICTION BOOK - MOTIONCHAPTER - NEWTON'S LAWS OF MOTION & FRICTION EXERCISE - Exercise - 1 SECTION-C :- Pseudo force, Weighing Machine
11 Videos
- NEWTON'S LAWS OF MOTION & FRICTION BOOK - MOTIONCHAPTER - NEWTON'S LAWS OF MOTION & FRICTION EXERCISE - Questions For Practice
25 Videos
- MODERN PHYSICS -1BOOK - MOTIONCHAPTER - MODERN PHYSICS -1EXERCISE - EXERCISE-4 ( LEVEL- II)
39 Videos
- NLM & FRICTIONBOOK - MOTIONCHAPTER - NLM & FRICTIONEXERCISE - EXERCISE-4 ( LEVEL-II)
15 Videos
Similar Questions
Knowledge Check
Study the following graph carefully and answer the given questions :-
The following graph shows the % profit of two companies over the years :-
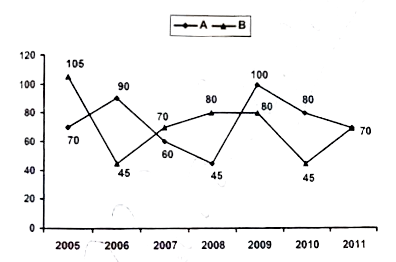
In which of the following years was the total income more than double the total expenditure in that year for company A ?A2010B2009C2006Dnone of theseWhich of the following graphs best depicts the changes in one cycle of PCR ?
A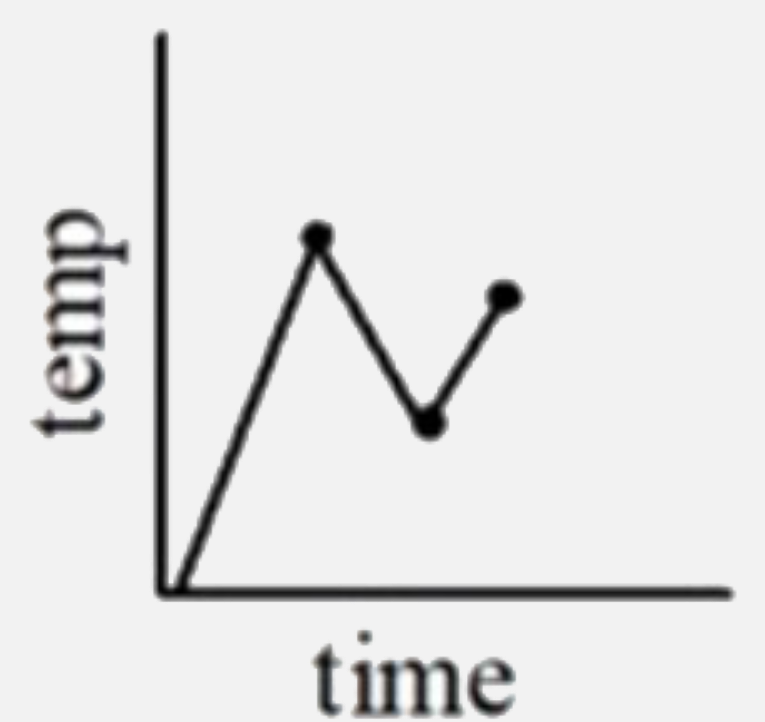 B
B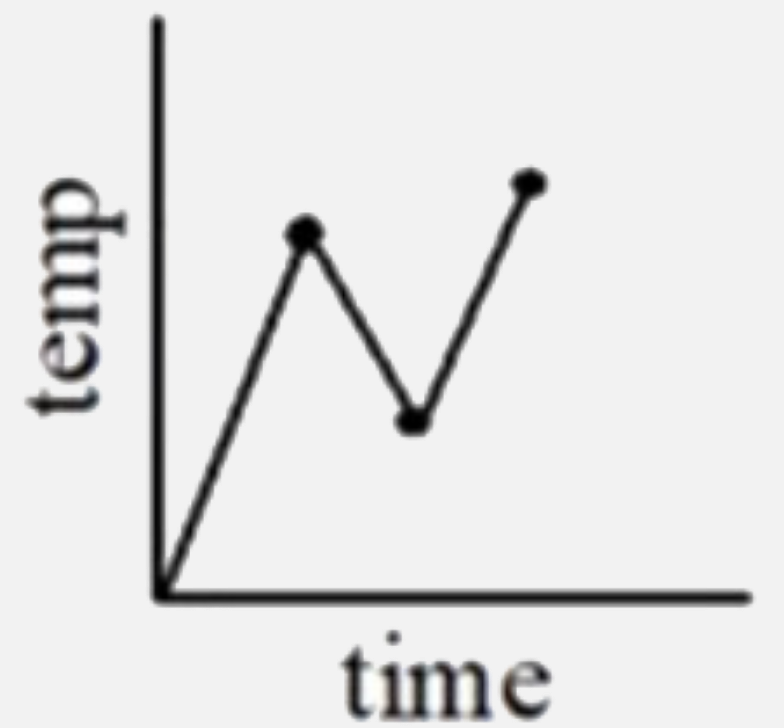 C
C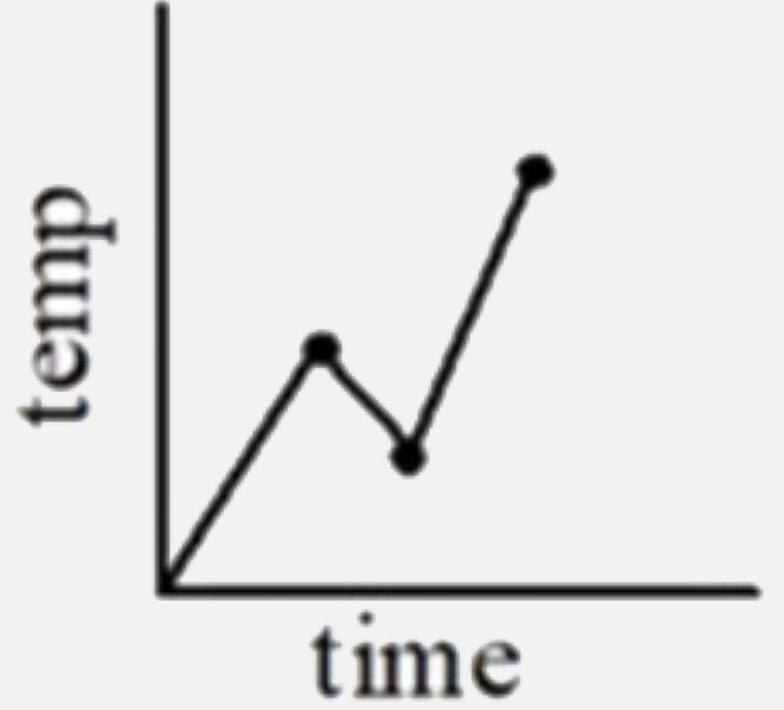 D
D
For which among the following reactions, change in entropy is less than zero?
ASublimation of IodineBDissociation of HydrogenCFormation of HydrogenDThermal decomposition of Calcium Carbonate
For which of the following processes is the entropy change zero,
View SolutionWhich of the following graphs is the characteristic of a zero order reaction ?
View SolutionWhich of the following graphs is not for zero order reaction?
View SolutionWhich of the following graph represent the variation of particle momentum and associated de Broglie wavelength?
View SolutionA ball is thrown up at an angle with the horizontal. Then the total change of momentum by the instant it returns to ground is
View Solution
