In a diagnostic test in mathematics given to students, the following marks (out of 100) are recorded 46,52,48,11,41,62,54,53,96,40,98 and 44.
Which average will be a good representative of the above data and why?
Median will be a good representative of the data, because
i) each value occurs once.
ii) the data is influenced by extreme values.
Topper's Solved these Questions
- STATISTICS AND PROBABILITYBook:NCERT EXEMPLARChapter:STATISTICS AND PROBABILITYExercise:LONG ANSWER TYPE QUESTIONS
Explore 5 Videos
- QUADRILATERALS Book:NCERT EXEMPLARChapter:QUADRILATERALS Exercise:Quadrilaterals
Explore 56 Videos
- TRIANGLESBook:NCERT EXEMPLARChapter:TRIANGLESExercise:Triangles
Explore 55 Videos
Similar Questions
In a mathematics test given to 15 student , the following makes ( out of 100) are recorded :
52,60,42,40,98,52,48,39,41,62,46,52,54,40,96
find the mean, median and mode of the given data
View SolutionIn a mathematics test given to 15 students, the following marks (out of 100) are recorded:41, 39, 48, 52, 46, 62, 54, 40, 96, 52, 98, 40, 42, 52, 60 Find the mean, median and mode of this data
View Solution
Knowledge Check
The marks obtained by 20 students of a class in a test (out of 50) are given below : 40, 44, 45, 46, 50, 42, 41, 8, 26, 28, 9, 32, 24, 6, 42, 36, 39.
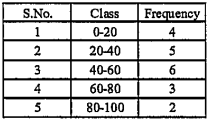
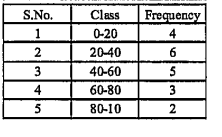
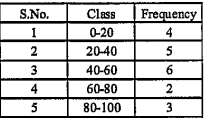
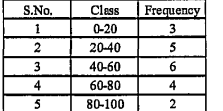
The range of the data isA44B54C90D1020 students of a class obtained following respective marks out of 100 marks in subject Mathematics:54,46,24,36,84,70,16,58,6,82,44,54.32,64.8,66,52,28,16 and 30 Grouped frequency distribution table of above will be
A B
B C
C D
D
In a mathematics test given to 15 students, the following marks (out of 100) are recorded: 41, 39, 48, 52, 46, 62, 54, 40, 96, 52, 98, 40, 42, 52, 60 Find the mean, median and mode of this data.
View SolutionThe marks obtained by 17 students in a mathematics test (out of 100) are given below:
90,79,76,82,65,96,100,91,82,100,49,46,64,48,72,66,68.
Find he range of the above data.
View SolutionWhat is the mean of the marks scored by students in a science exam?
41, 39, 52, 48, 54, 62, 46, 52, 40, 96, 42, 40, 98, 60, 52
View SolutionWe are given the following marks secured by 25 students in an examination .
23,28,30,32,35,36,36,40,41,43,44,44,45,48,49,52,53,54,56,56,58,61,62,65,68.
(i)Arrange this data in the form of a frequency distribution taking the following class intervals.
20-29,30-39,40-49,50-59, and 60-69
(ii) Draw the frequency polygon and ogive for the above data.
View SolutionThe marks (out of 100) obtained by a group of students in Mathematics test are :
88, 74, 90, 88, 40, 46, 58, 96, 82, and 78. Find :
median of the marks obtained
View SolutionThe marks (out of 100) obtained by a group of students in Mathematics test are :
88, 74, 90, 88, 40, 46, 58, 96, 82, and 78. Find :
mode of the marks obtained
View Solution