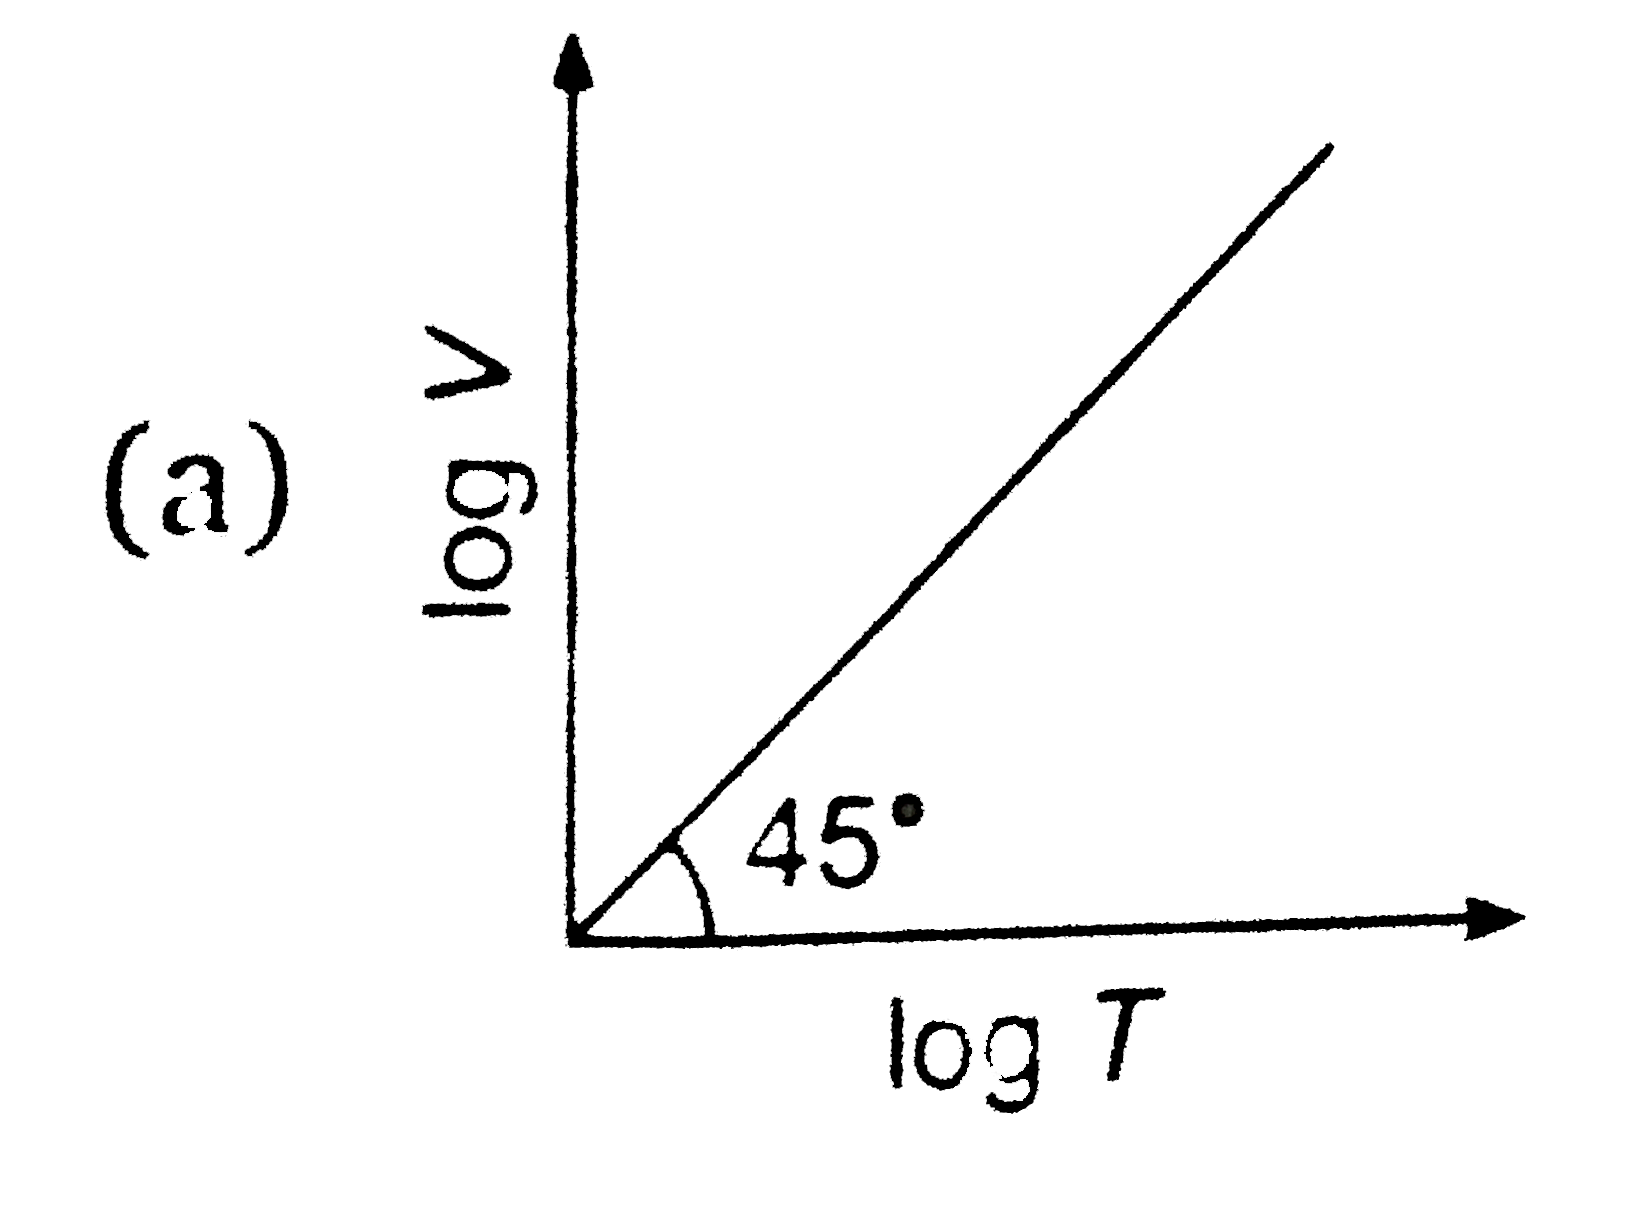
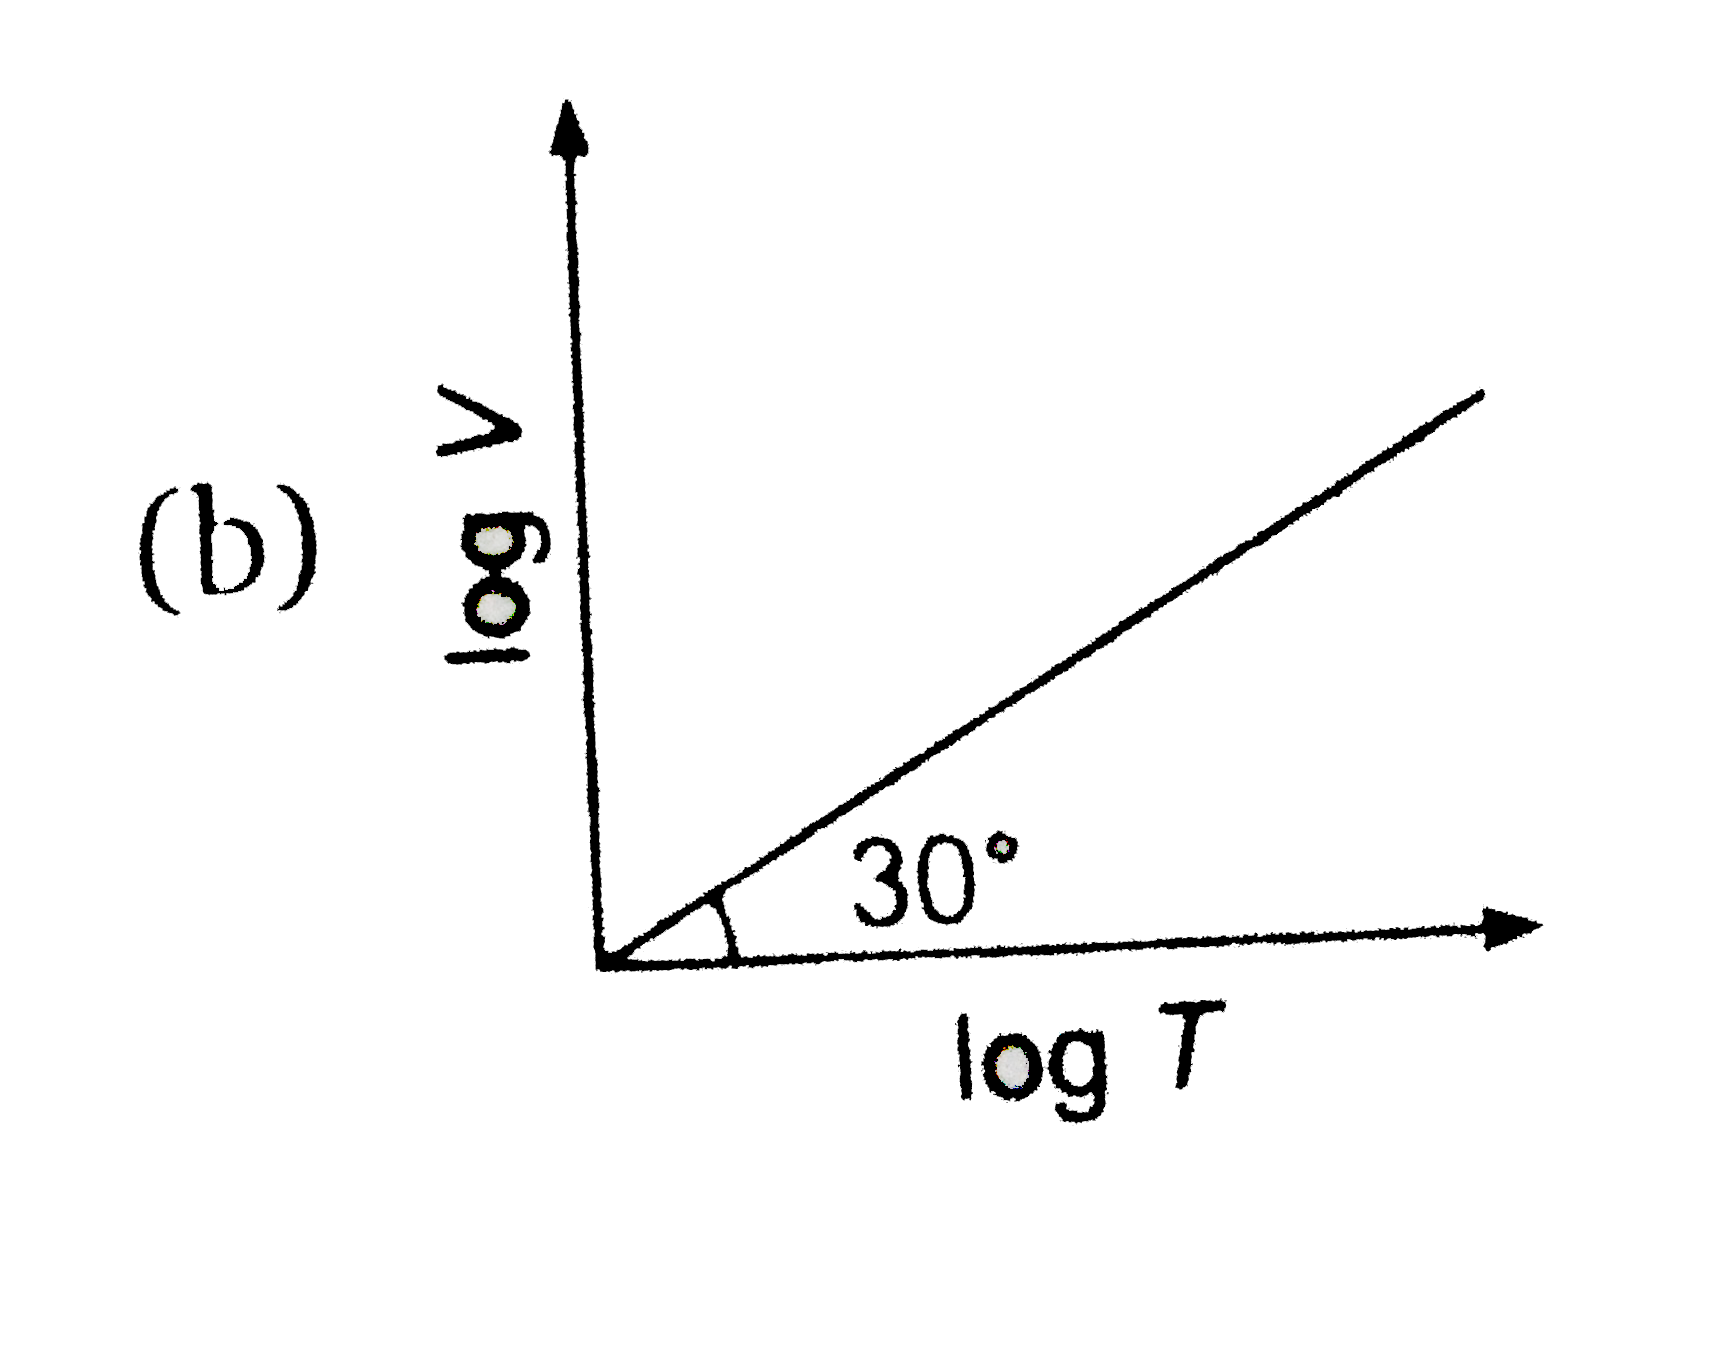
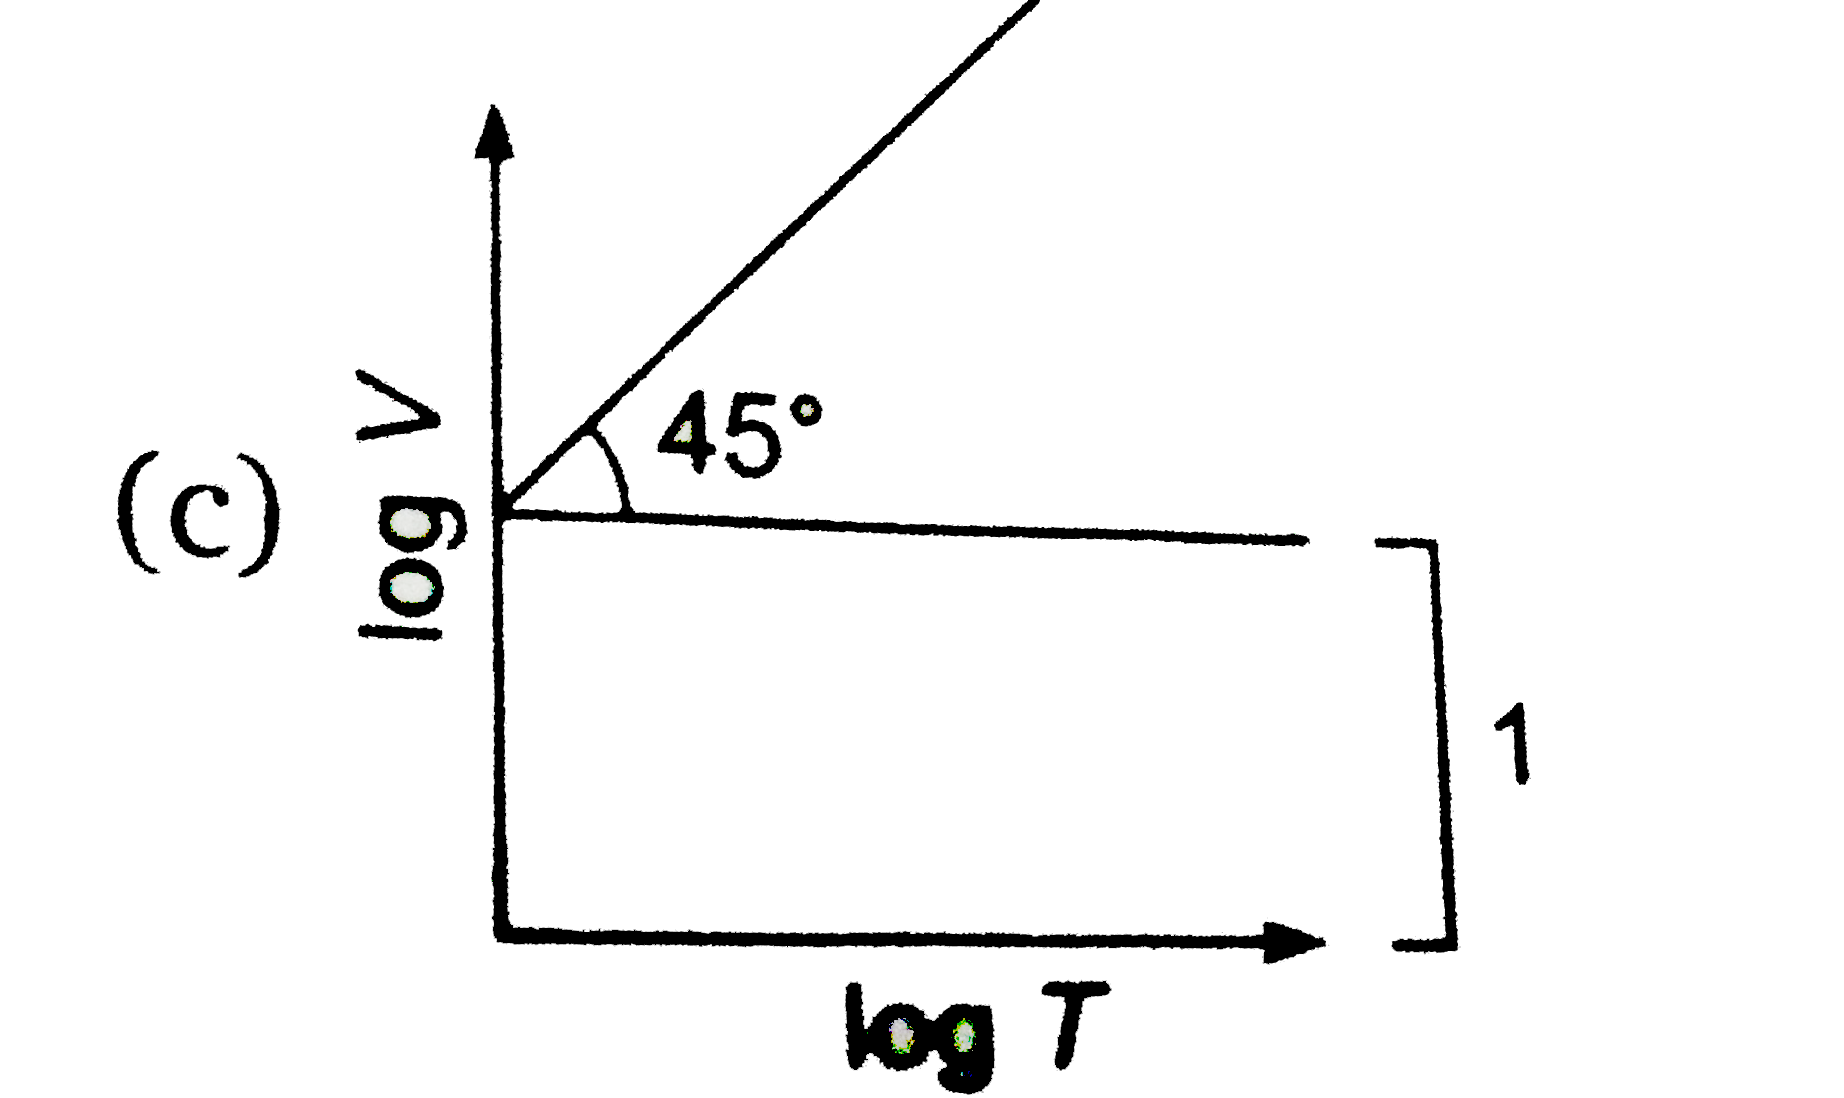
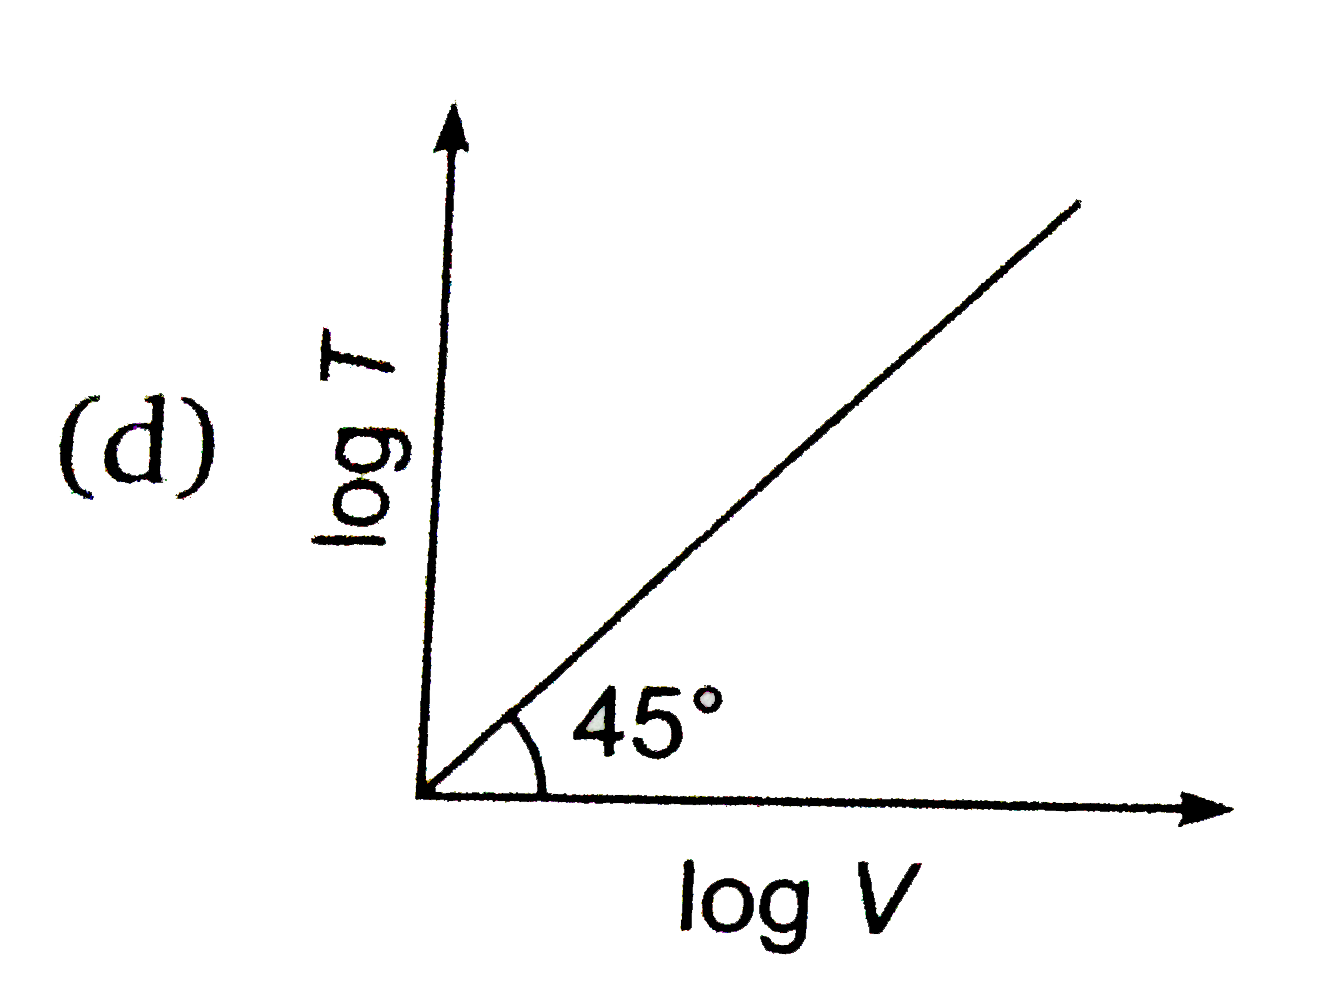
For a closed container containing 10 moles of an ideal gas, at constant pressure of 0.82 atm, which graph correctly represent, variation of log V us log T where volume is in litre and temp. in kelvin :
The correct Answer is:a
(a) V=nRTP=10×0.0821×T0.821
V=T
logV=logT
slope=1
θ=45∘
Topper's Solved these Questions
- GASEOUS STATEBOOK - NARENDRA AWASTHICHAPTER - GASEOUS STATEEXERCISE - Level 1 (Q.31 To Q.60)
1 Video
- GASEOUS STATEBOOK - NARENDRA AWASTHICHAPTER - GASEOUS STATEEXERCISE - Level 1 (Q.121 To Q.150)
1 Video
- ELECTROCHEMISTRYBOOK - NARENDRA AWASTHICHAPTER - ELECTROCHEMISTRYEXERCISE - Level 3 - Subjective Problems
1 Video
- IONIC EEQUILIBRIUMBOOK - NARENDRA AWASTHICHAPTER - IONIC EEQUILIBRIUMEXERCISE - Exercise
196 Videos
Similar Questions
A container contains 1 mole of a gas at 1 atm pressure and 27° C, while its volume is 24.6 litres. If its pressure is 10 atm and temperature 327° C, then new volume is
View SolutionAt a constant pressure, of the following graphs that one which represents the variation of the density of an ideal gas with the absolute temperature T, is
View Solution
Knowledge Check
For a closed container containing 100 mol of an ideal gas fitted with movable, frictionless, weightless piston operating such that pressure of gas remain constant at 8.21 atm, which graph repsents correct variation of log Vv/s log T where V is in litre and T is in Kelvin ? (R=0.0821atmLmolK)
A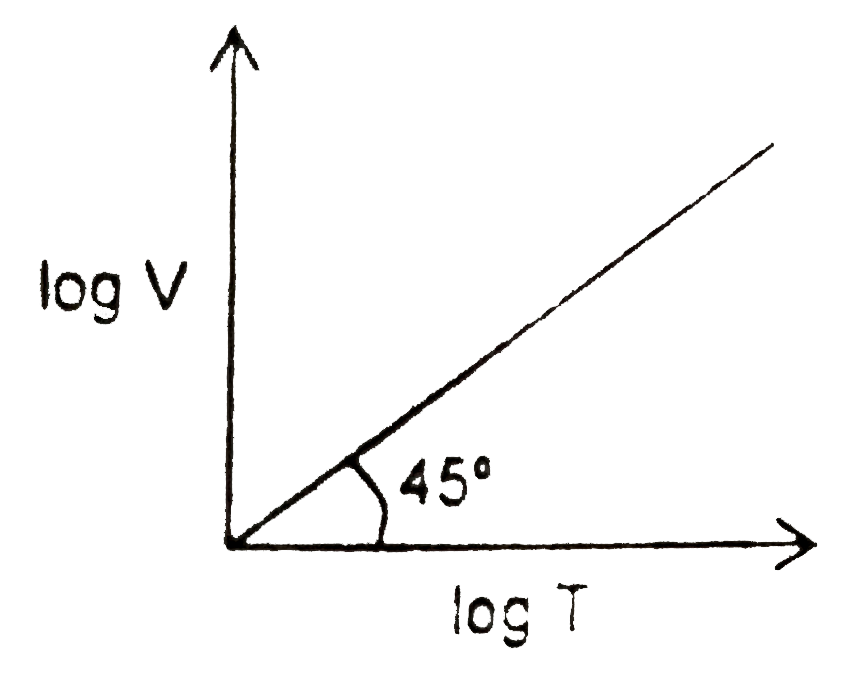 B
B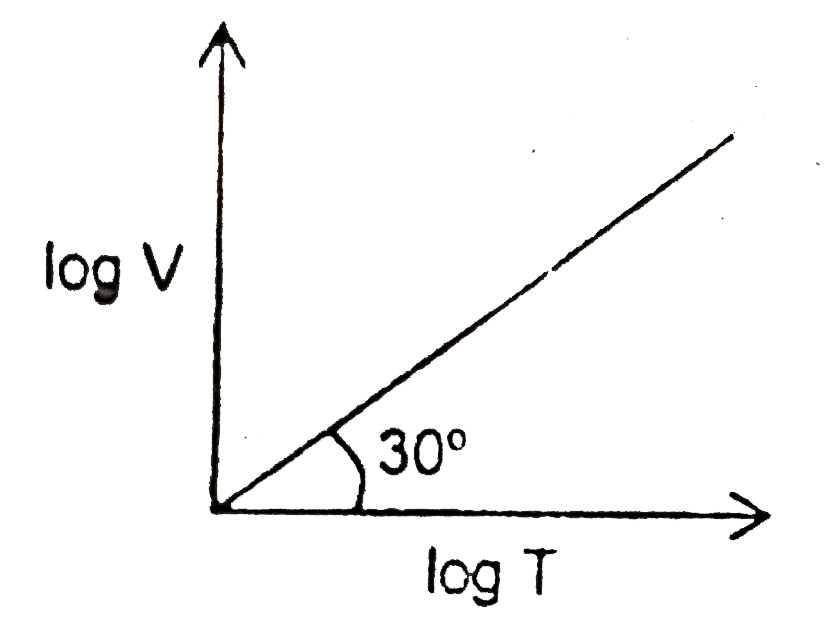 C
C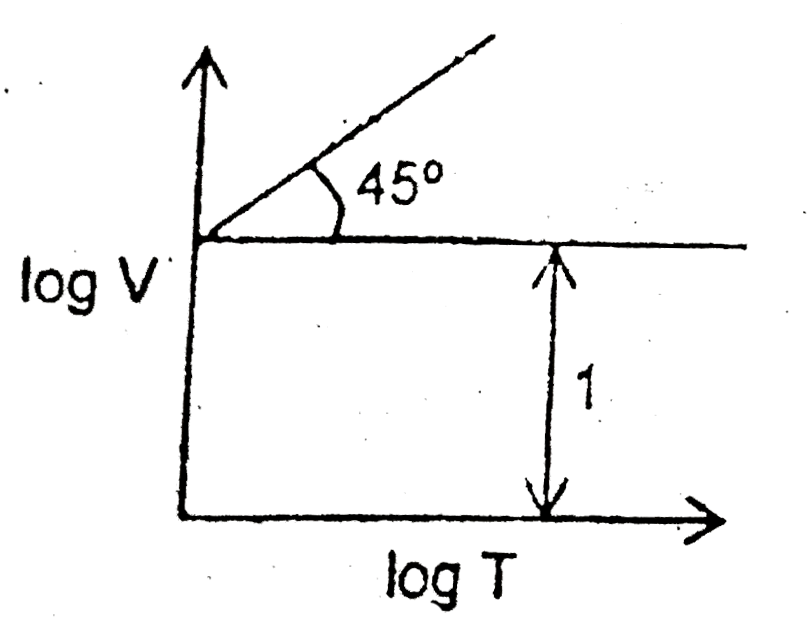 DNone of these
If heat energy is given to an ideal gas at constant pressure, then select the graph which best represents the variation of VT with temperature (T).
A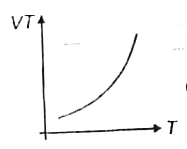 B
B C
C D
D
Ten moles of an ideal gas are filled in a closed vessel. The vessel has cylinder and piston type arrangement and pressure of the gas remains constant at 0.821 atm. Which of the following graph represents correct variation of log V vs log T?
(V = Volume in litre and T = temperature in Kelvin)A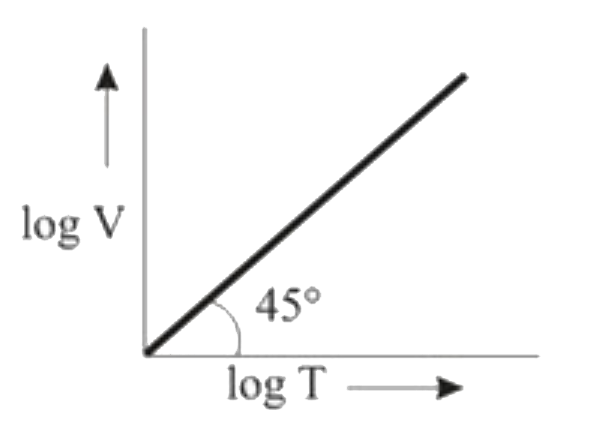 B
B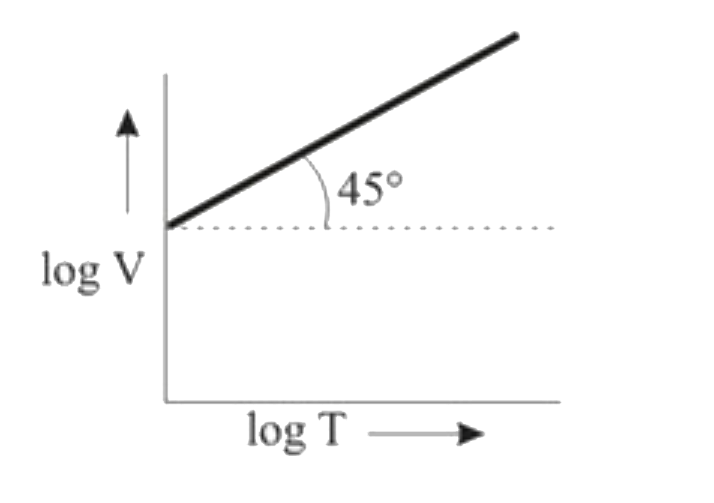 C
C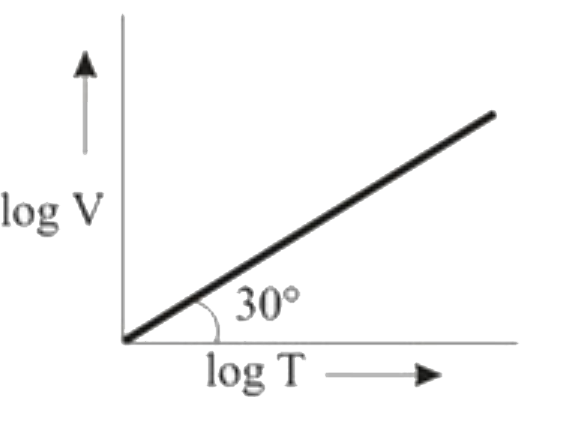 D
D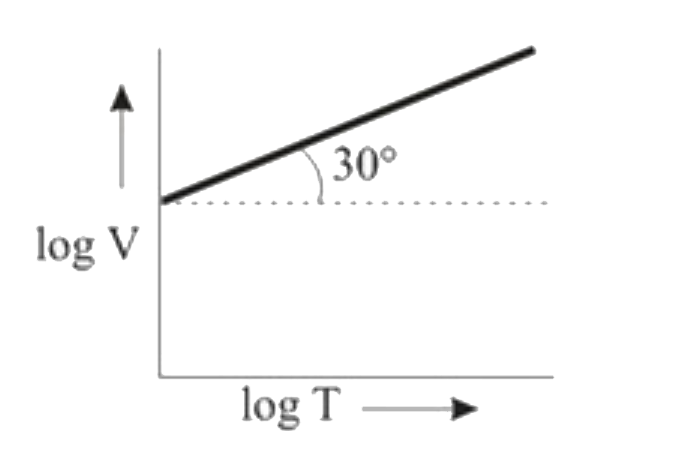
If a graph is plotted between log V and log T for 2 moles of a gas of constant pressure of 0.0821 atm, then which of the following statements are correct?
View SolutionFor 1 mol ofan ideal gas at a constant temperature T, the plot of (log P) against (log V) is a (P: Pressure, V: Volume)
View SolutionUnder what conditions will a pure sample of an ideal gas not only exhibit a pressure of 1atm but also a concentration of 1mollitre−1
[R=0.082 iltre atm mol−1K−1]
View SolutionWhich of the following graphs correctly represents the variation of β=−(dV/dP)/V with P for an ideal gas at constant temperature?
View SolutionWhich of the following graphs correctly represents the variation of β=−(dVdP)/V with P for an ideal gas at constant temperature
View Solution
