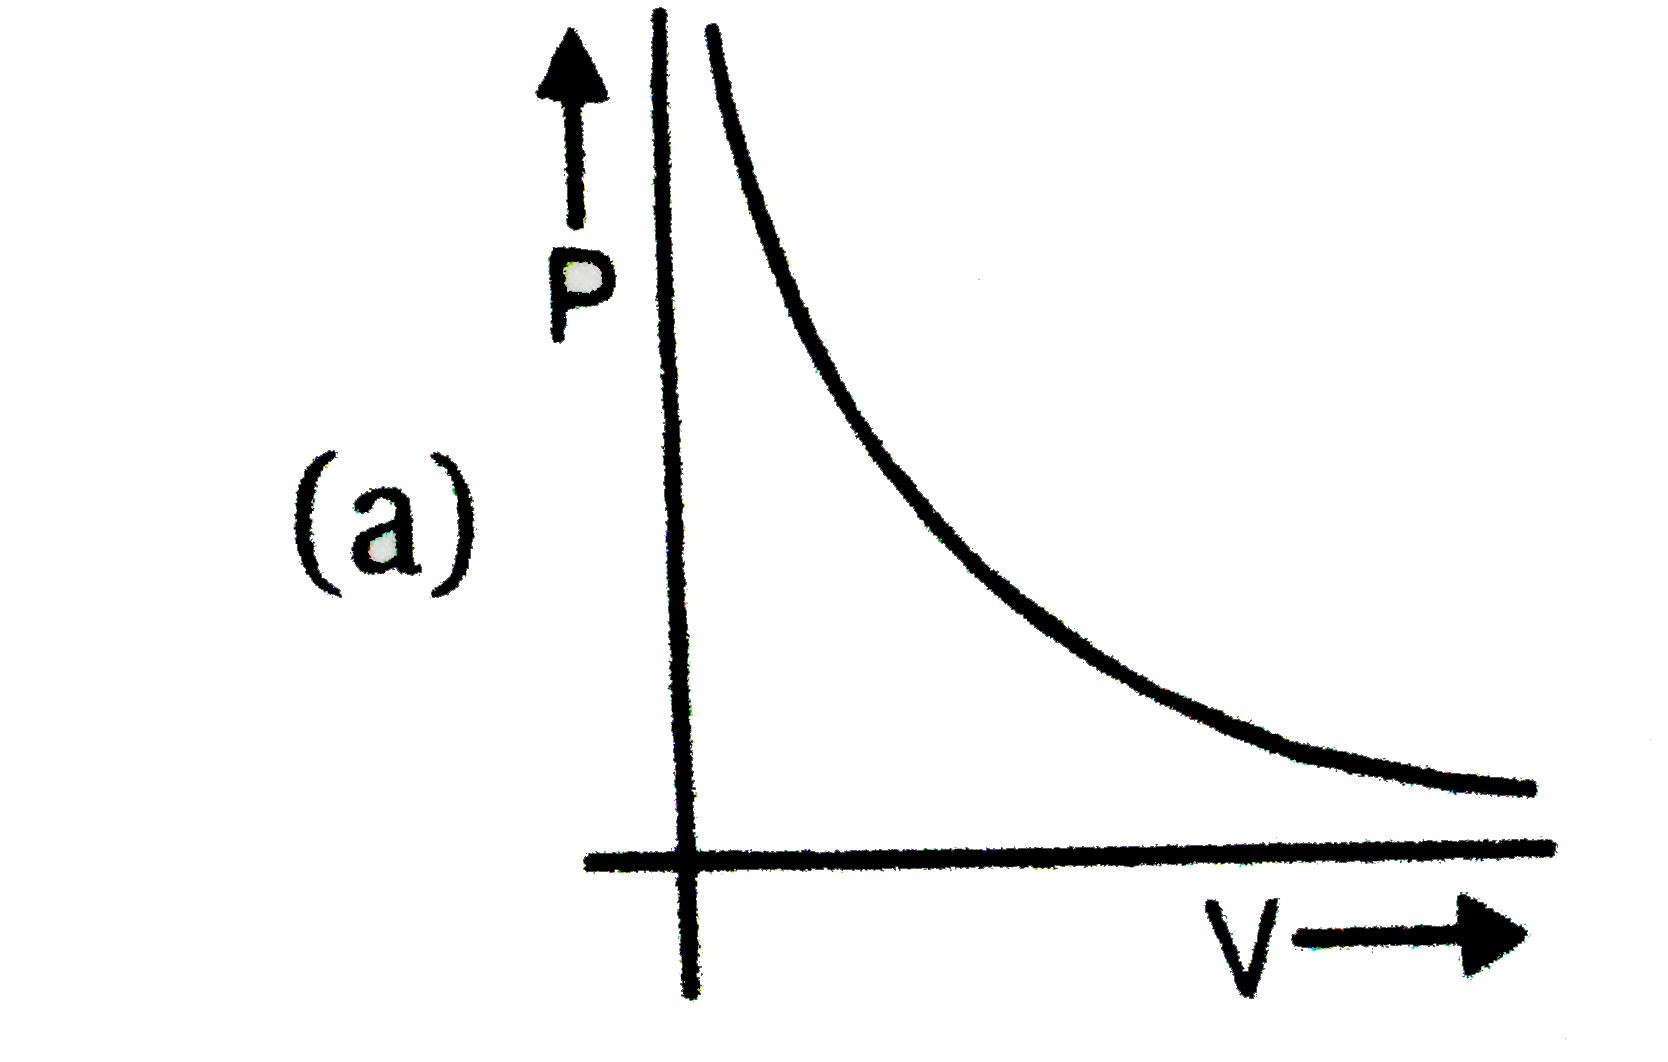
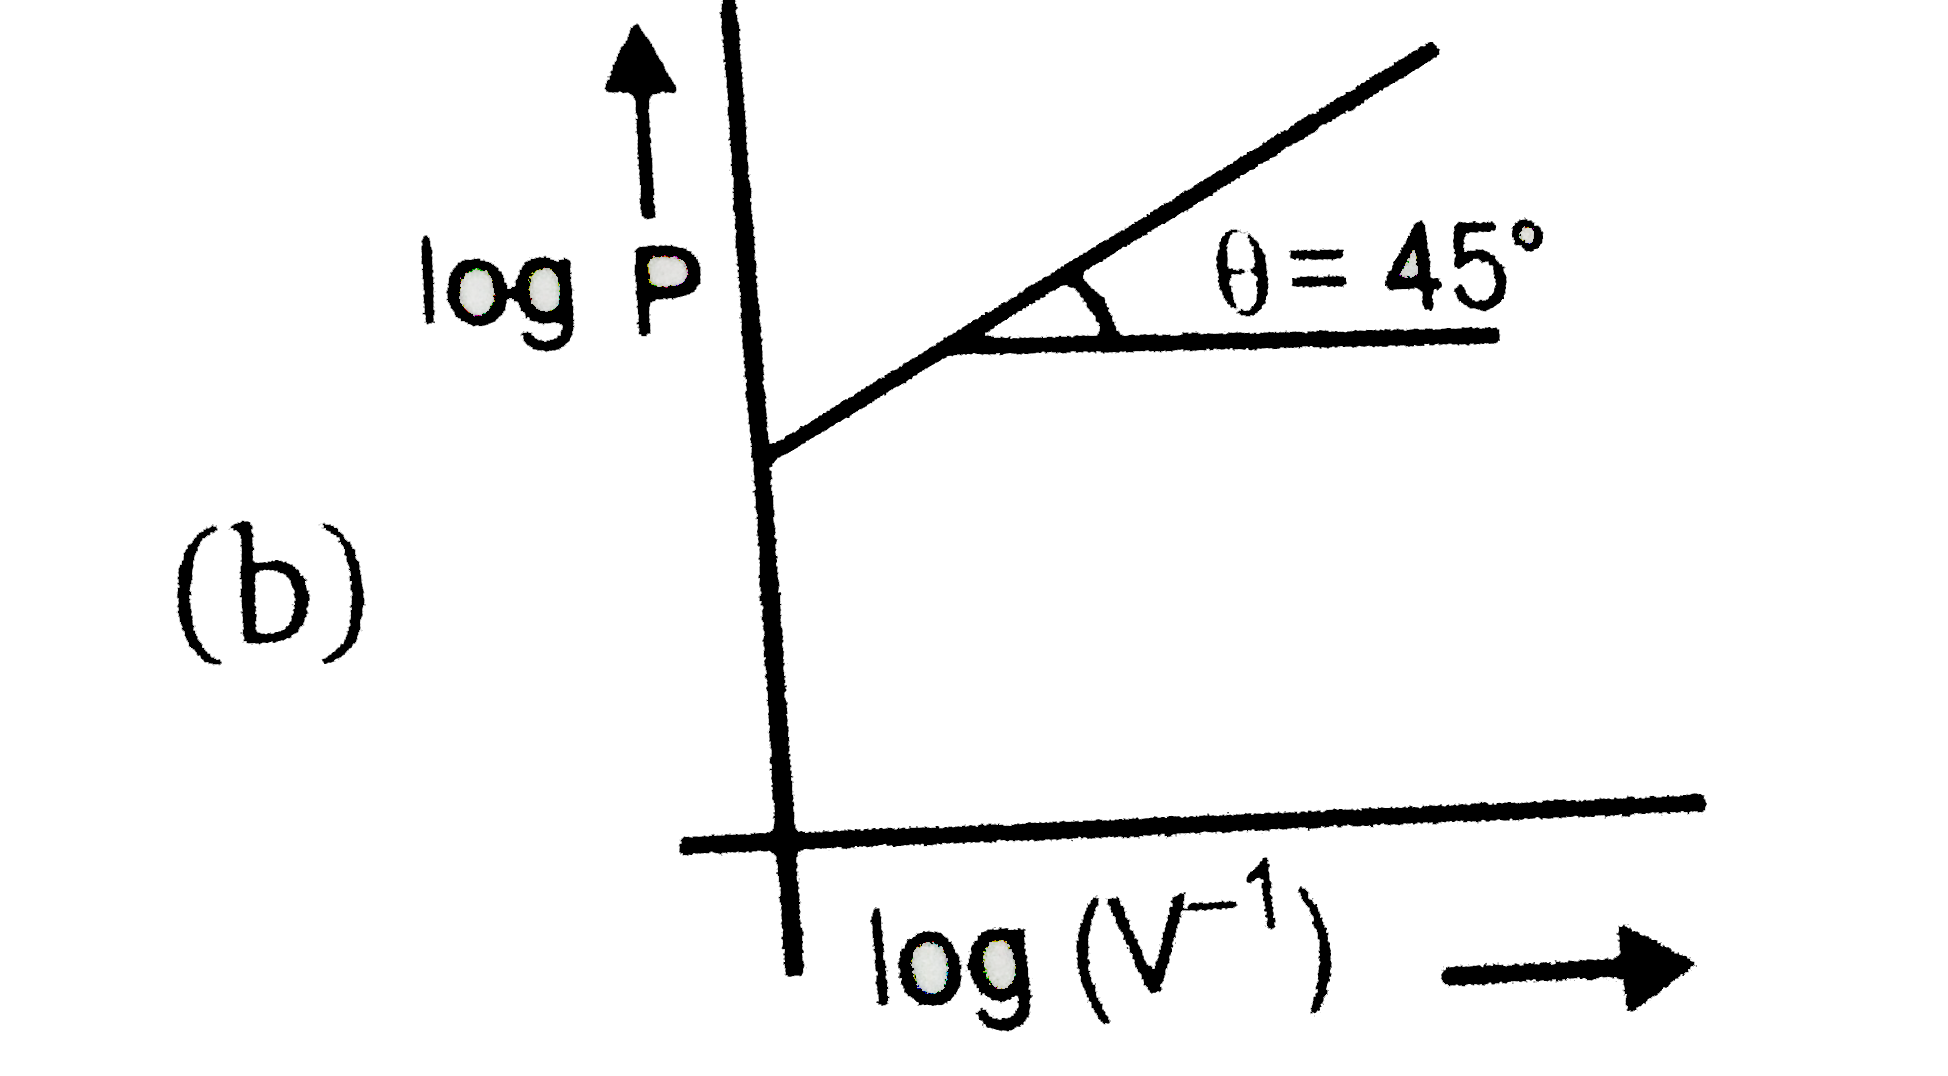
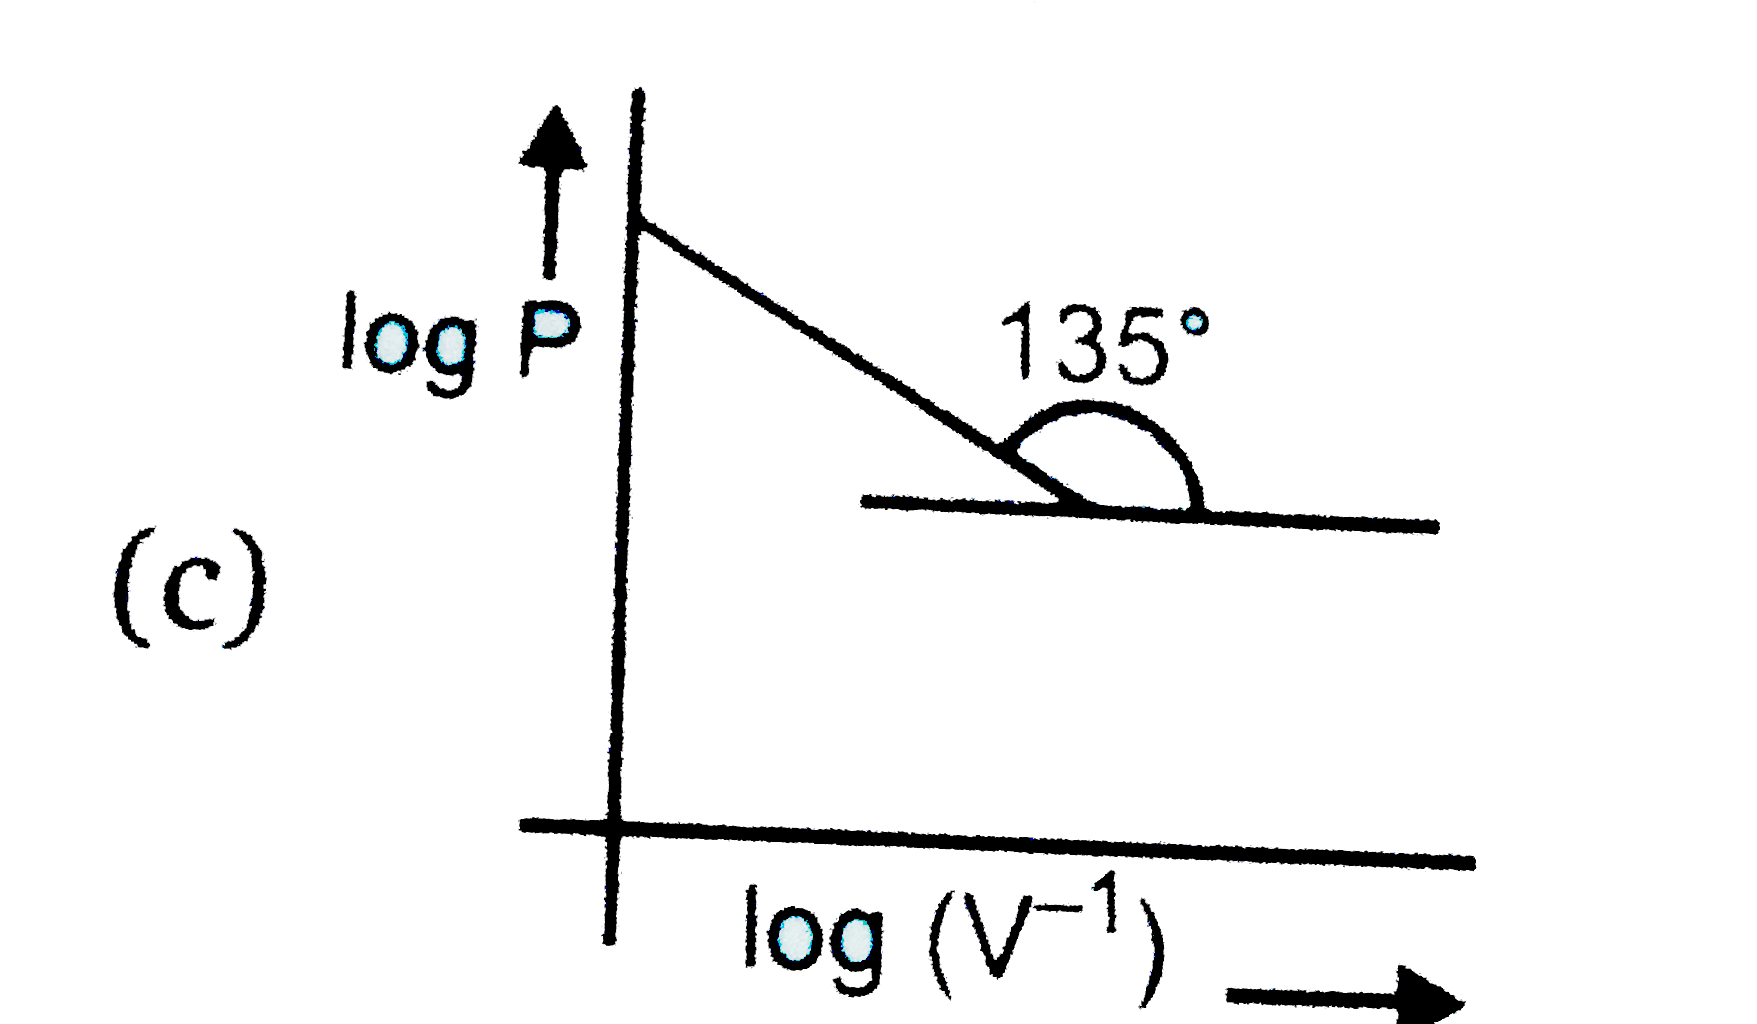
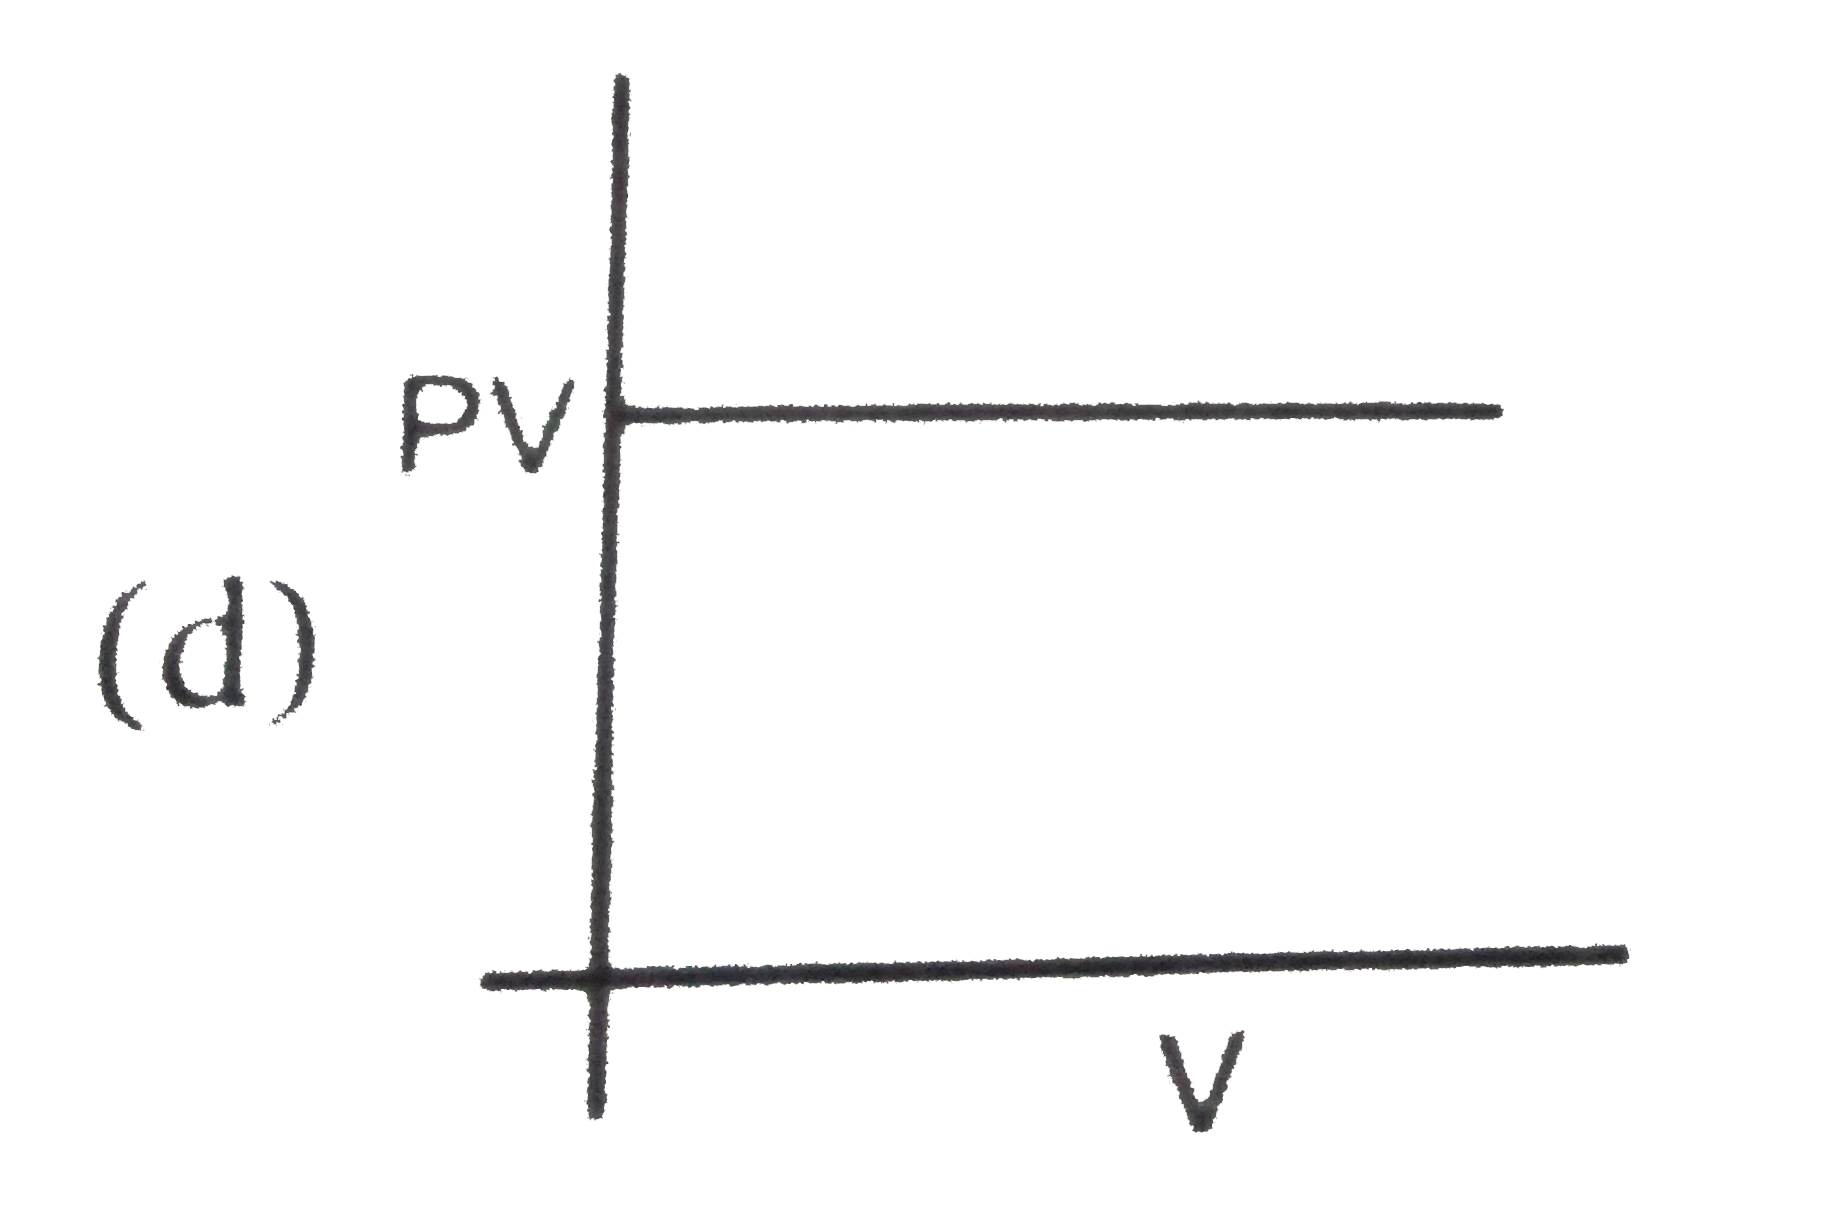
Which of the following plots does not represent Boyle's law?
A
B
C
D
Video Solution
Text Solution
The correct Answer is:B
(c) Boyle's Law
Temperature and mass=constant
PV=K
log P=log K- log V
|
Topper's Solved these Questions
- GASEOUS STATEBOOK - NARENDRA AWASTHICHAPTER - GASEOUS STATEEXERCISE - Level 1 (Q.31 To Q.60)
1 Videos
- GASEOUS STATEBOOK - NARENDRA AWASTHICHAPTER - GASEOUS STATEEXERCISE - Level 1 (Q.121 To Q.150)
1 Videos
- ELECTROCHEMISTRYBOOK - NARENDRA AWASTHICHAPTER - ELECTROCHEMISTRYEXERCISE - Level 3 - Subjective Problems
1 Videos
- IONIC EEQUILIBRIUMBOOK - NARENDRA AWASTHICHAPTER - IONIC EEQUILIBRIUMEXERCISE - Exercise
196 Videos
Similar Questions
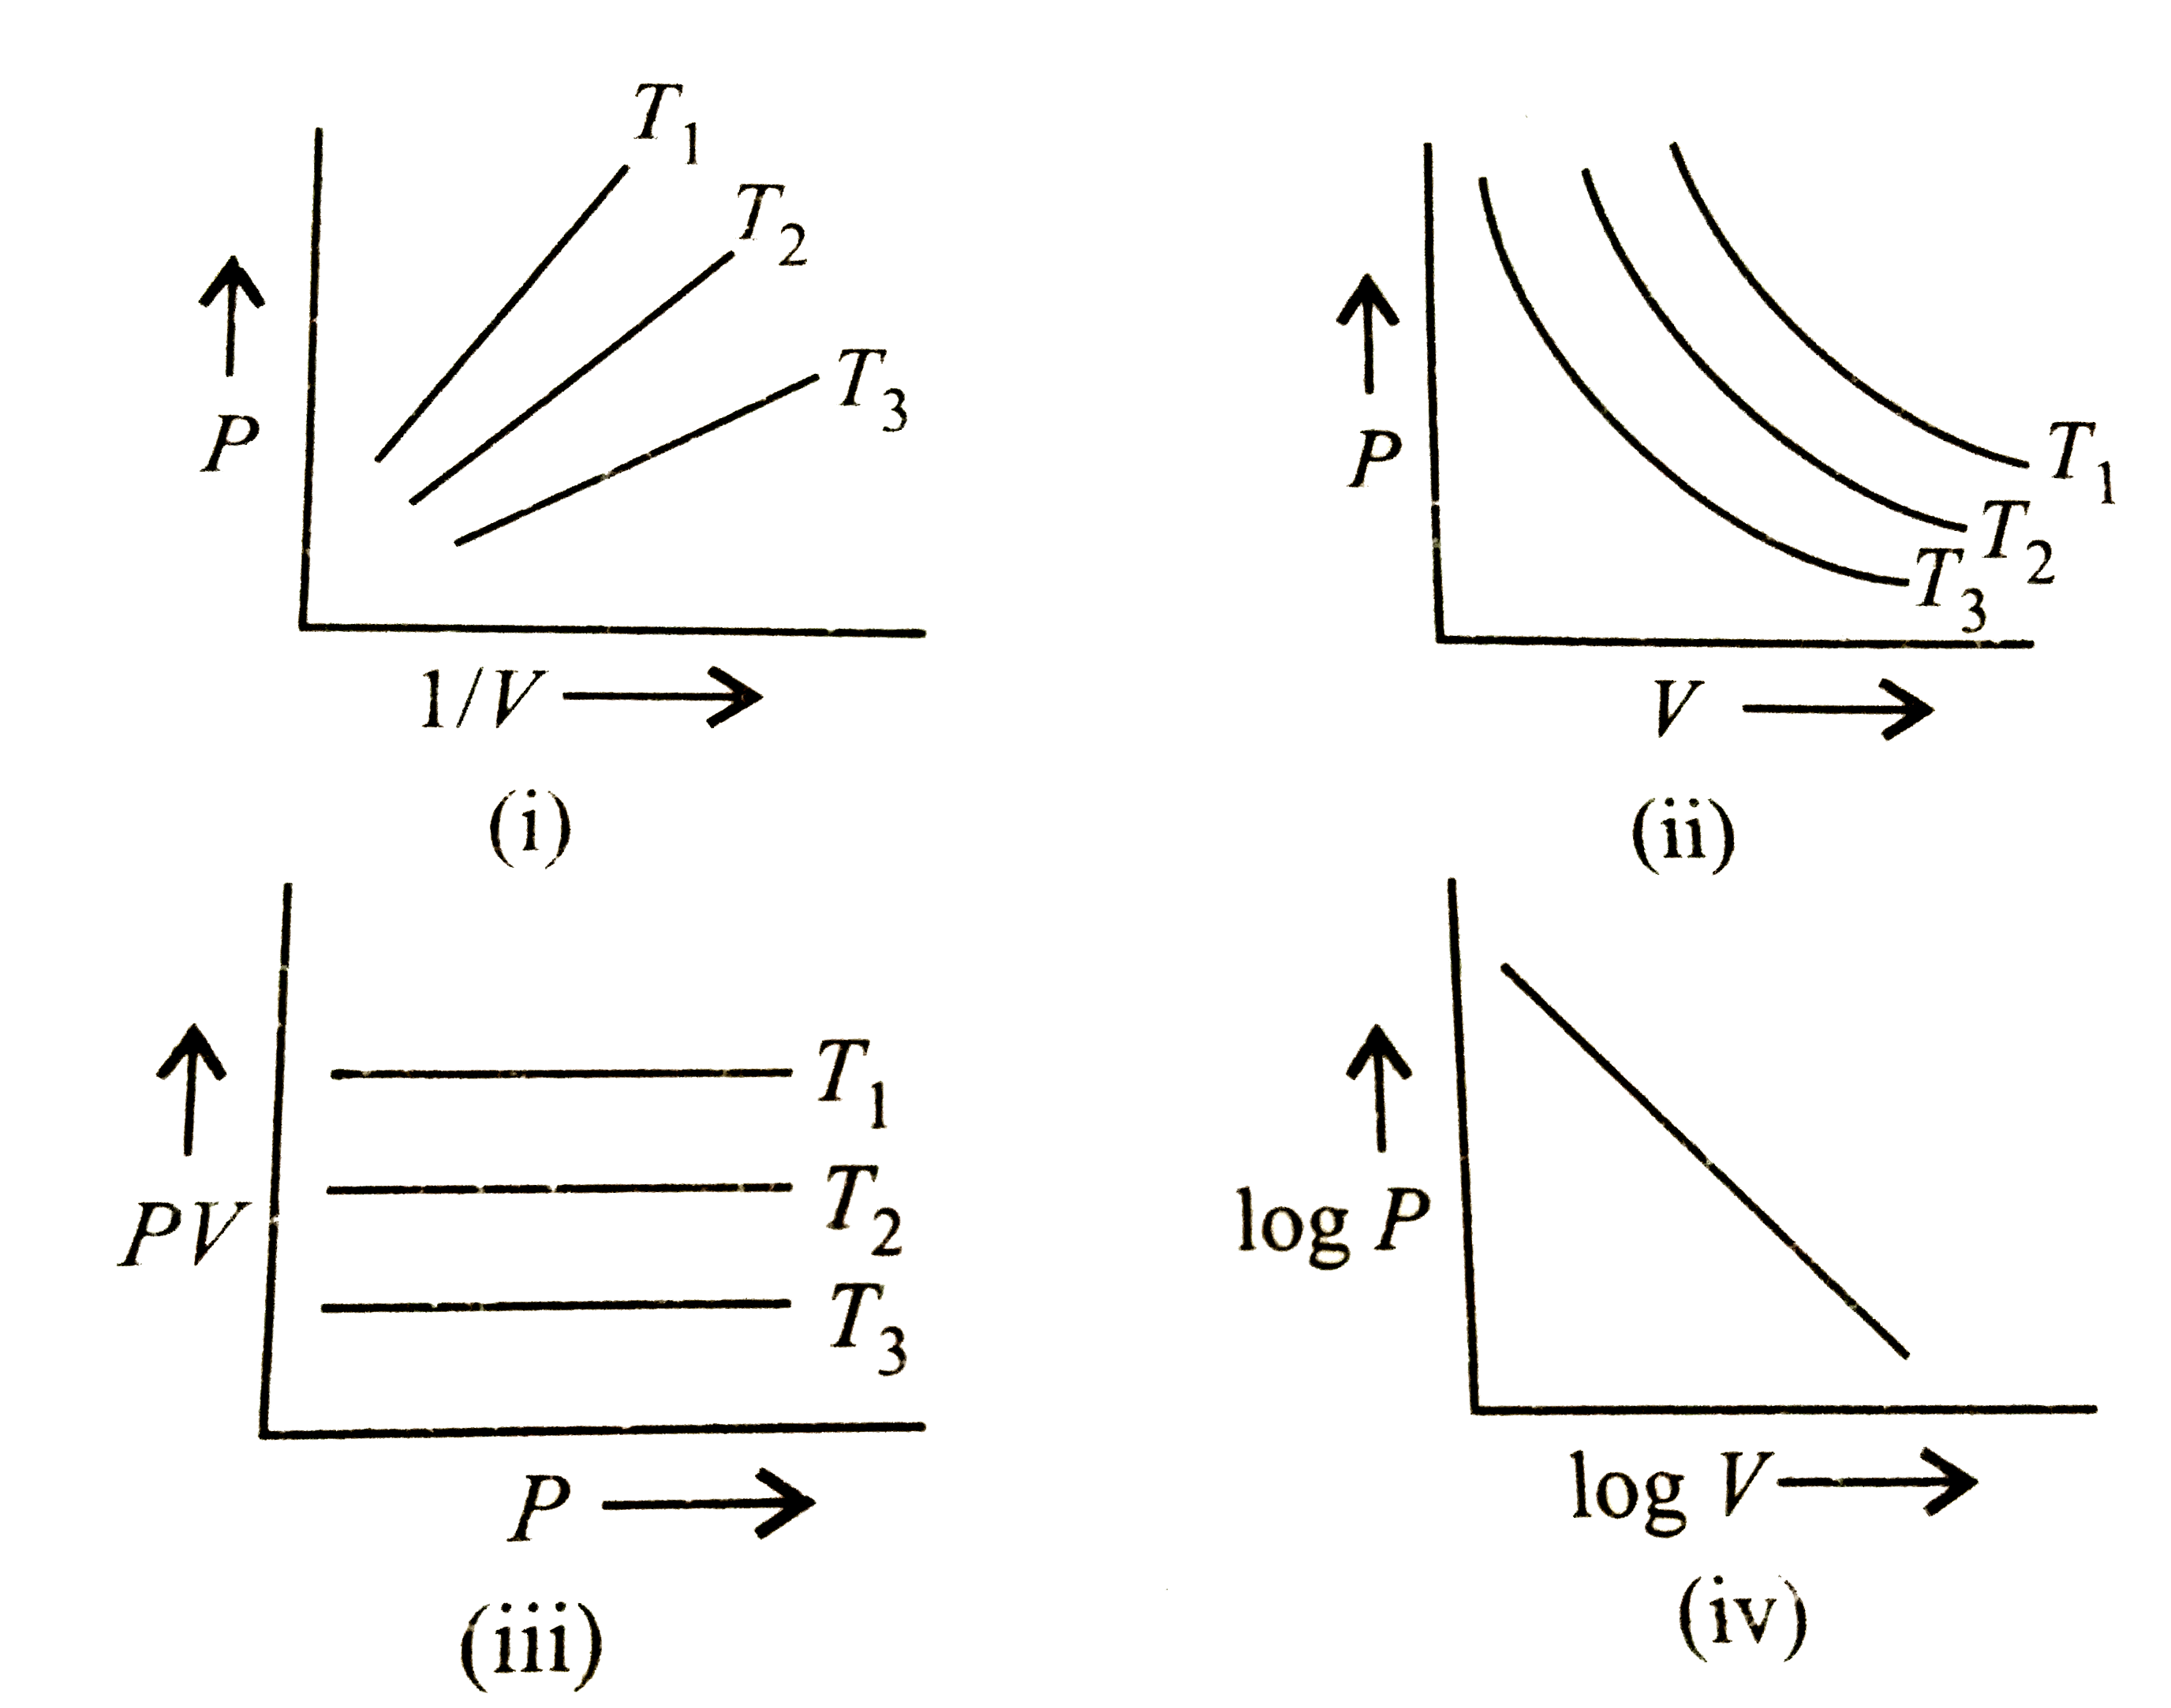
Graph between pressure and volume are plotted at different temperature. Which of the following isotherms represent Boyle's law as PV = constant?
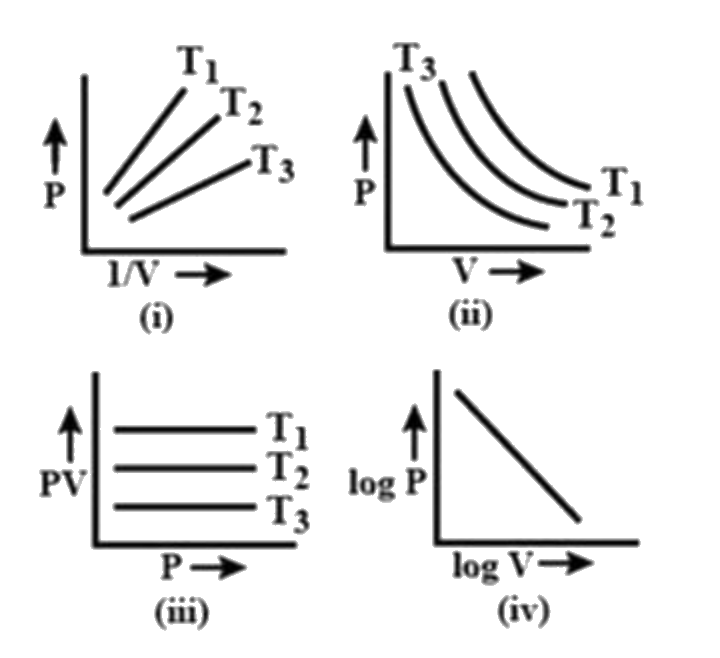
View SolutionGraphs between pressure and volume are plotted at different temperatures . Which of the following isotherms represent Boyle's law as PV = constant ? (T1>T2>T3)
View Solution
Knowledge Check
Which of the following curve does not represent Boyle's law?
A B
B C
C D
D
Which of the following curves does not represent Boyle's law ?
A B
B C
C D
D
Which of the following curves does not represent Boyle's law?
A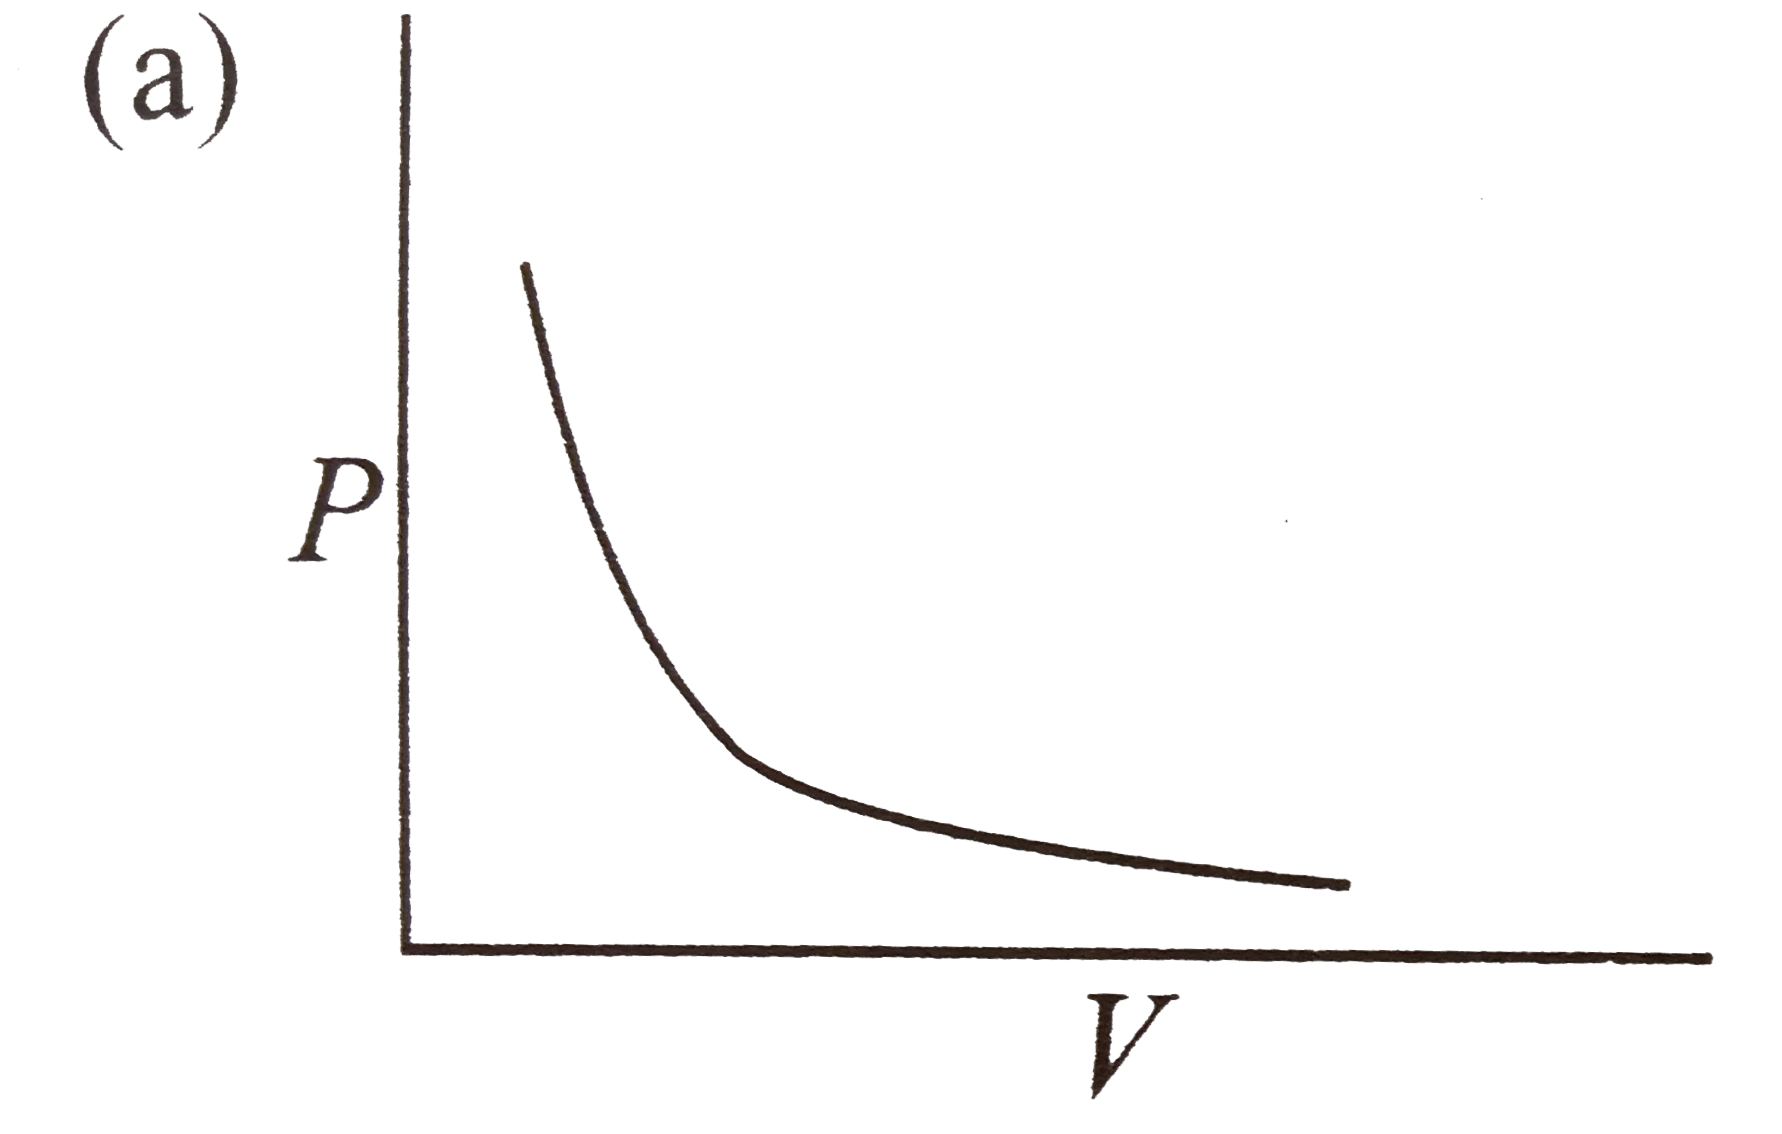 B
B C
C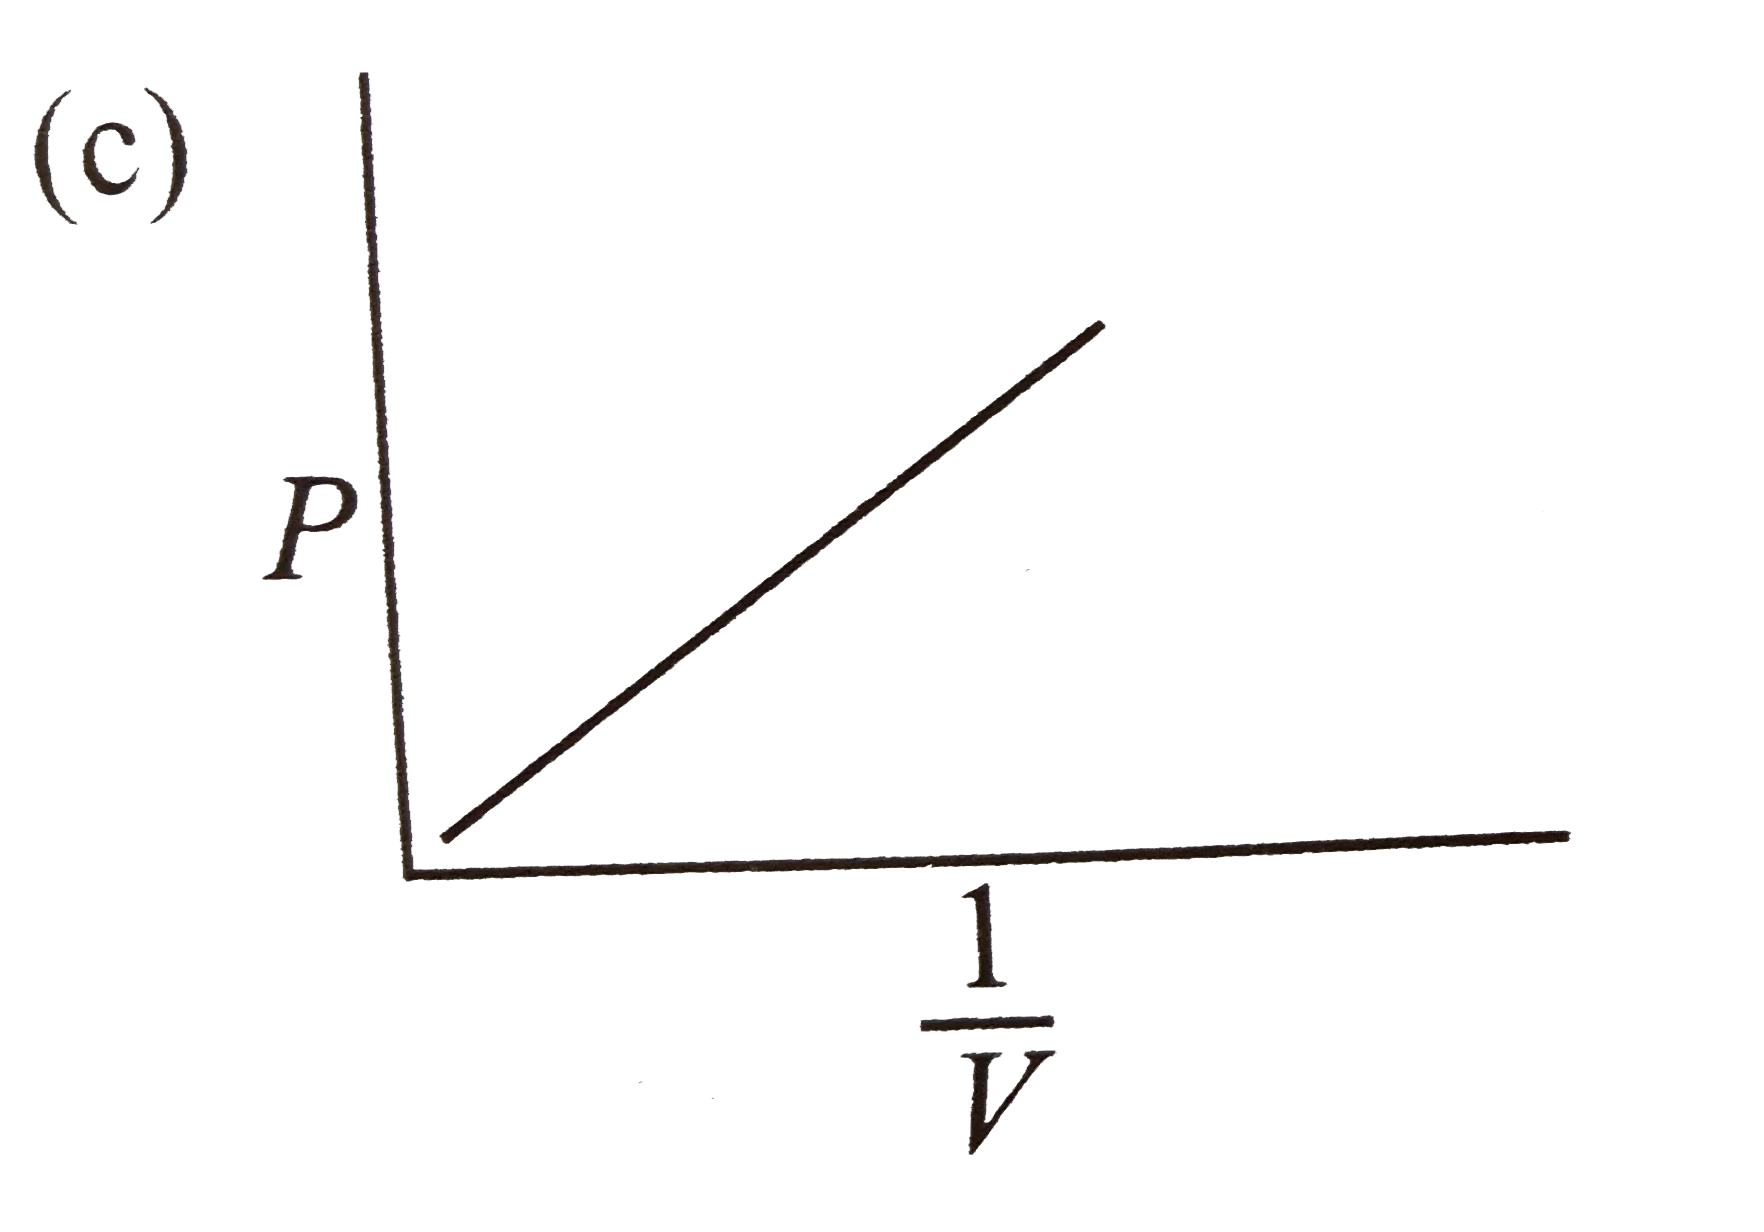 D
D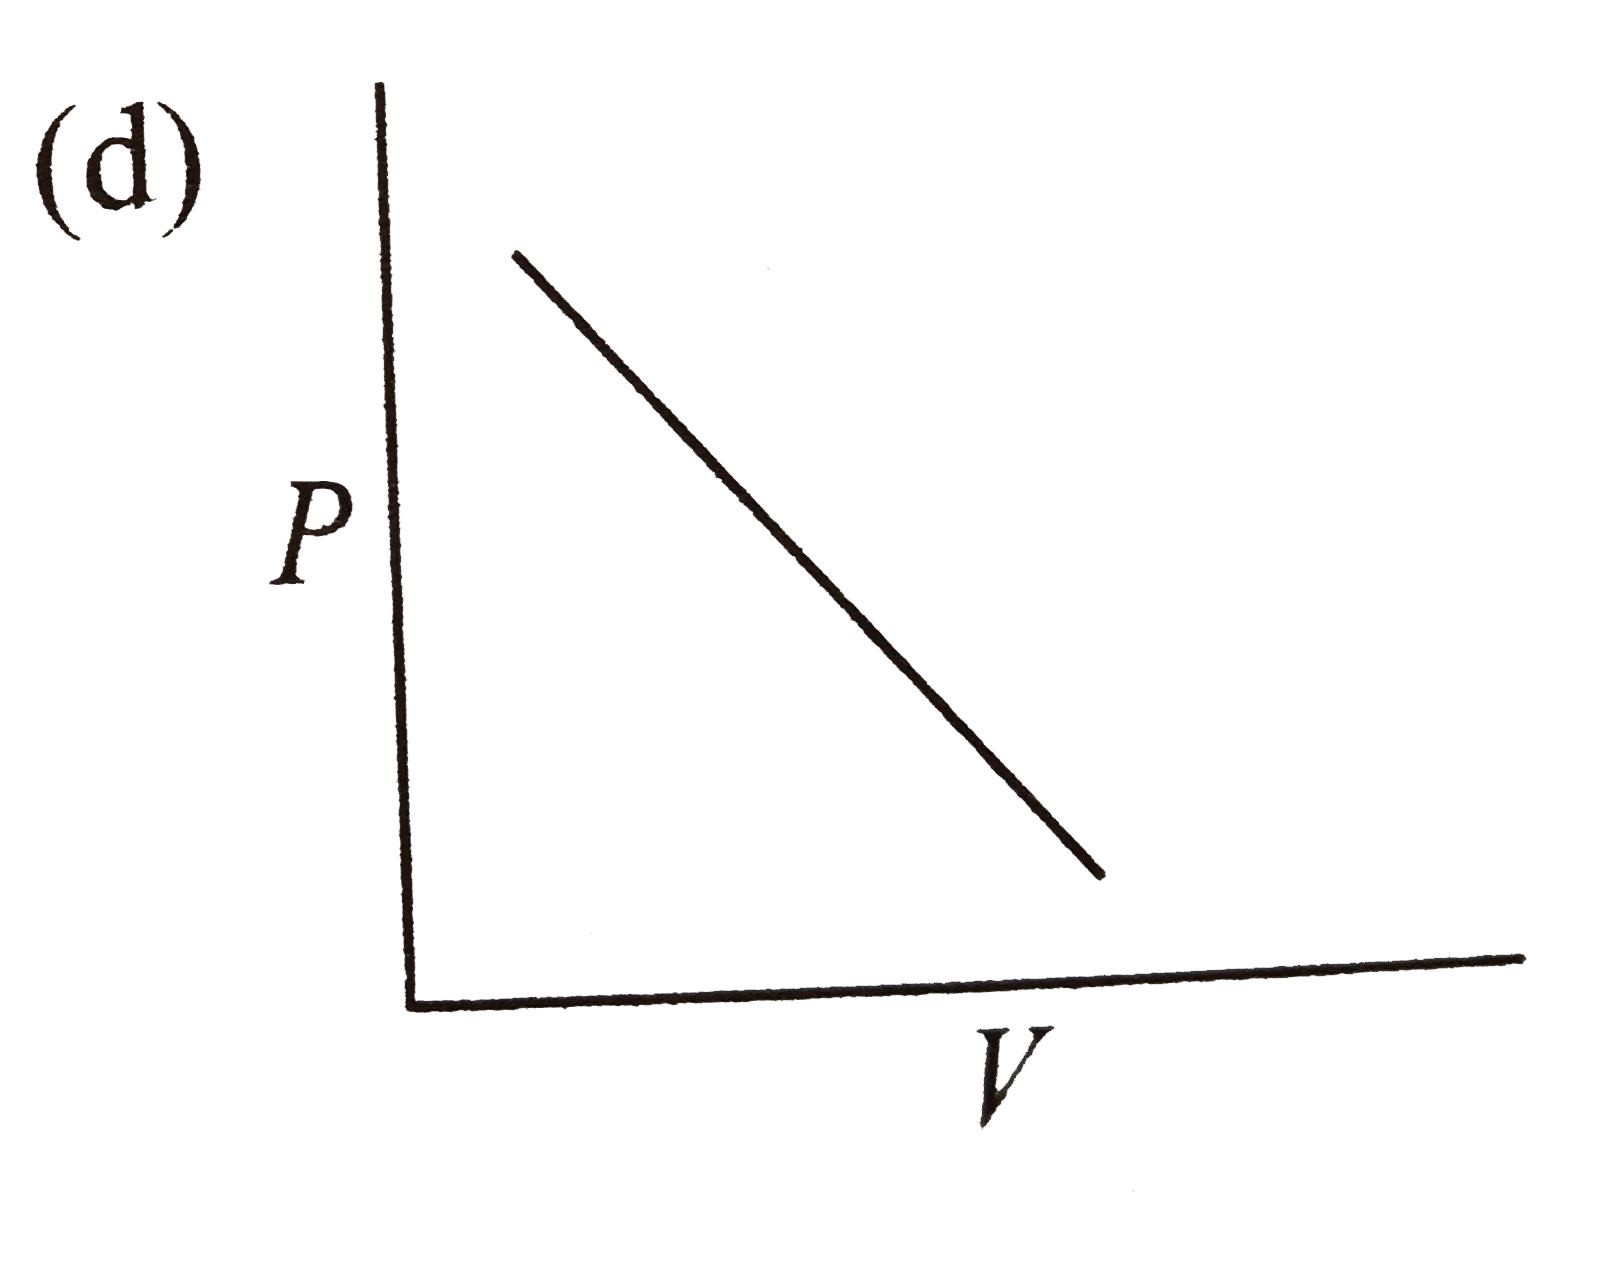
At constant pressure which of the following does not represent Charle's law?
View SolutionWhich of the following plots does not represent the behaviour of an ideal binary liquid solution?
View SolutionWhich of the following plots does not represent the behaviour of an ideal binary liquid solution of A and B?
View SolutionWhich of the following expressions does not represent Charles' law?
View SolutionWhich curve does not represent Boyle's law ?
View Solution
