Which of the following inequalities represents the graph shown below on the real number line ?

0<x<5
0<x≤4
−2<x≤4
1≤x≤4
The correct Answer is:B
Step by step video, text & image solution for Which of the following inequalities represents the graph shown below on the real number line ? by Maths experts to help you in doubts & scoring excellent marks in Class 12 exams.
Updated on:21/07/2023Topper's Solved these Questions
Similar Questions
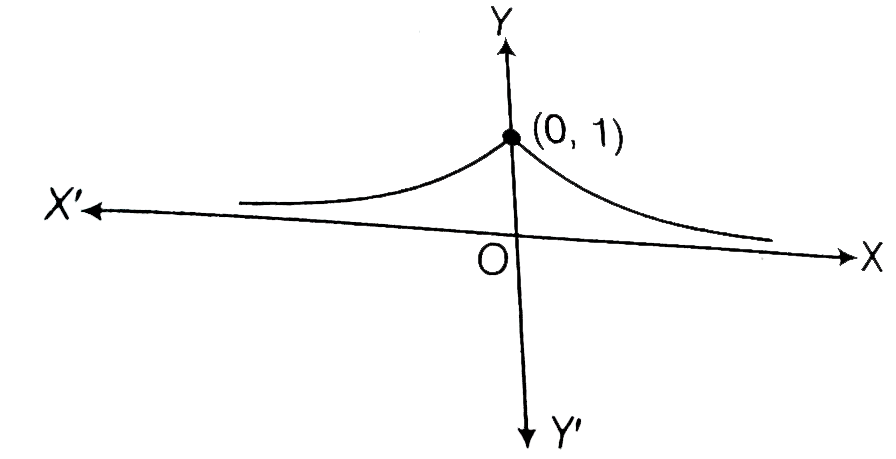
Which one of the following function best represents the graphs as shown below?
View Solution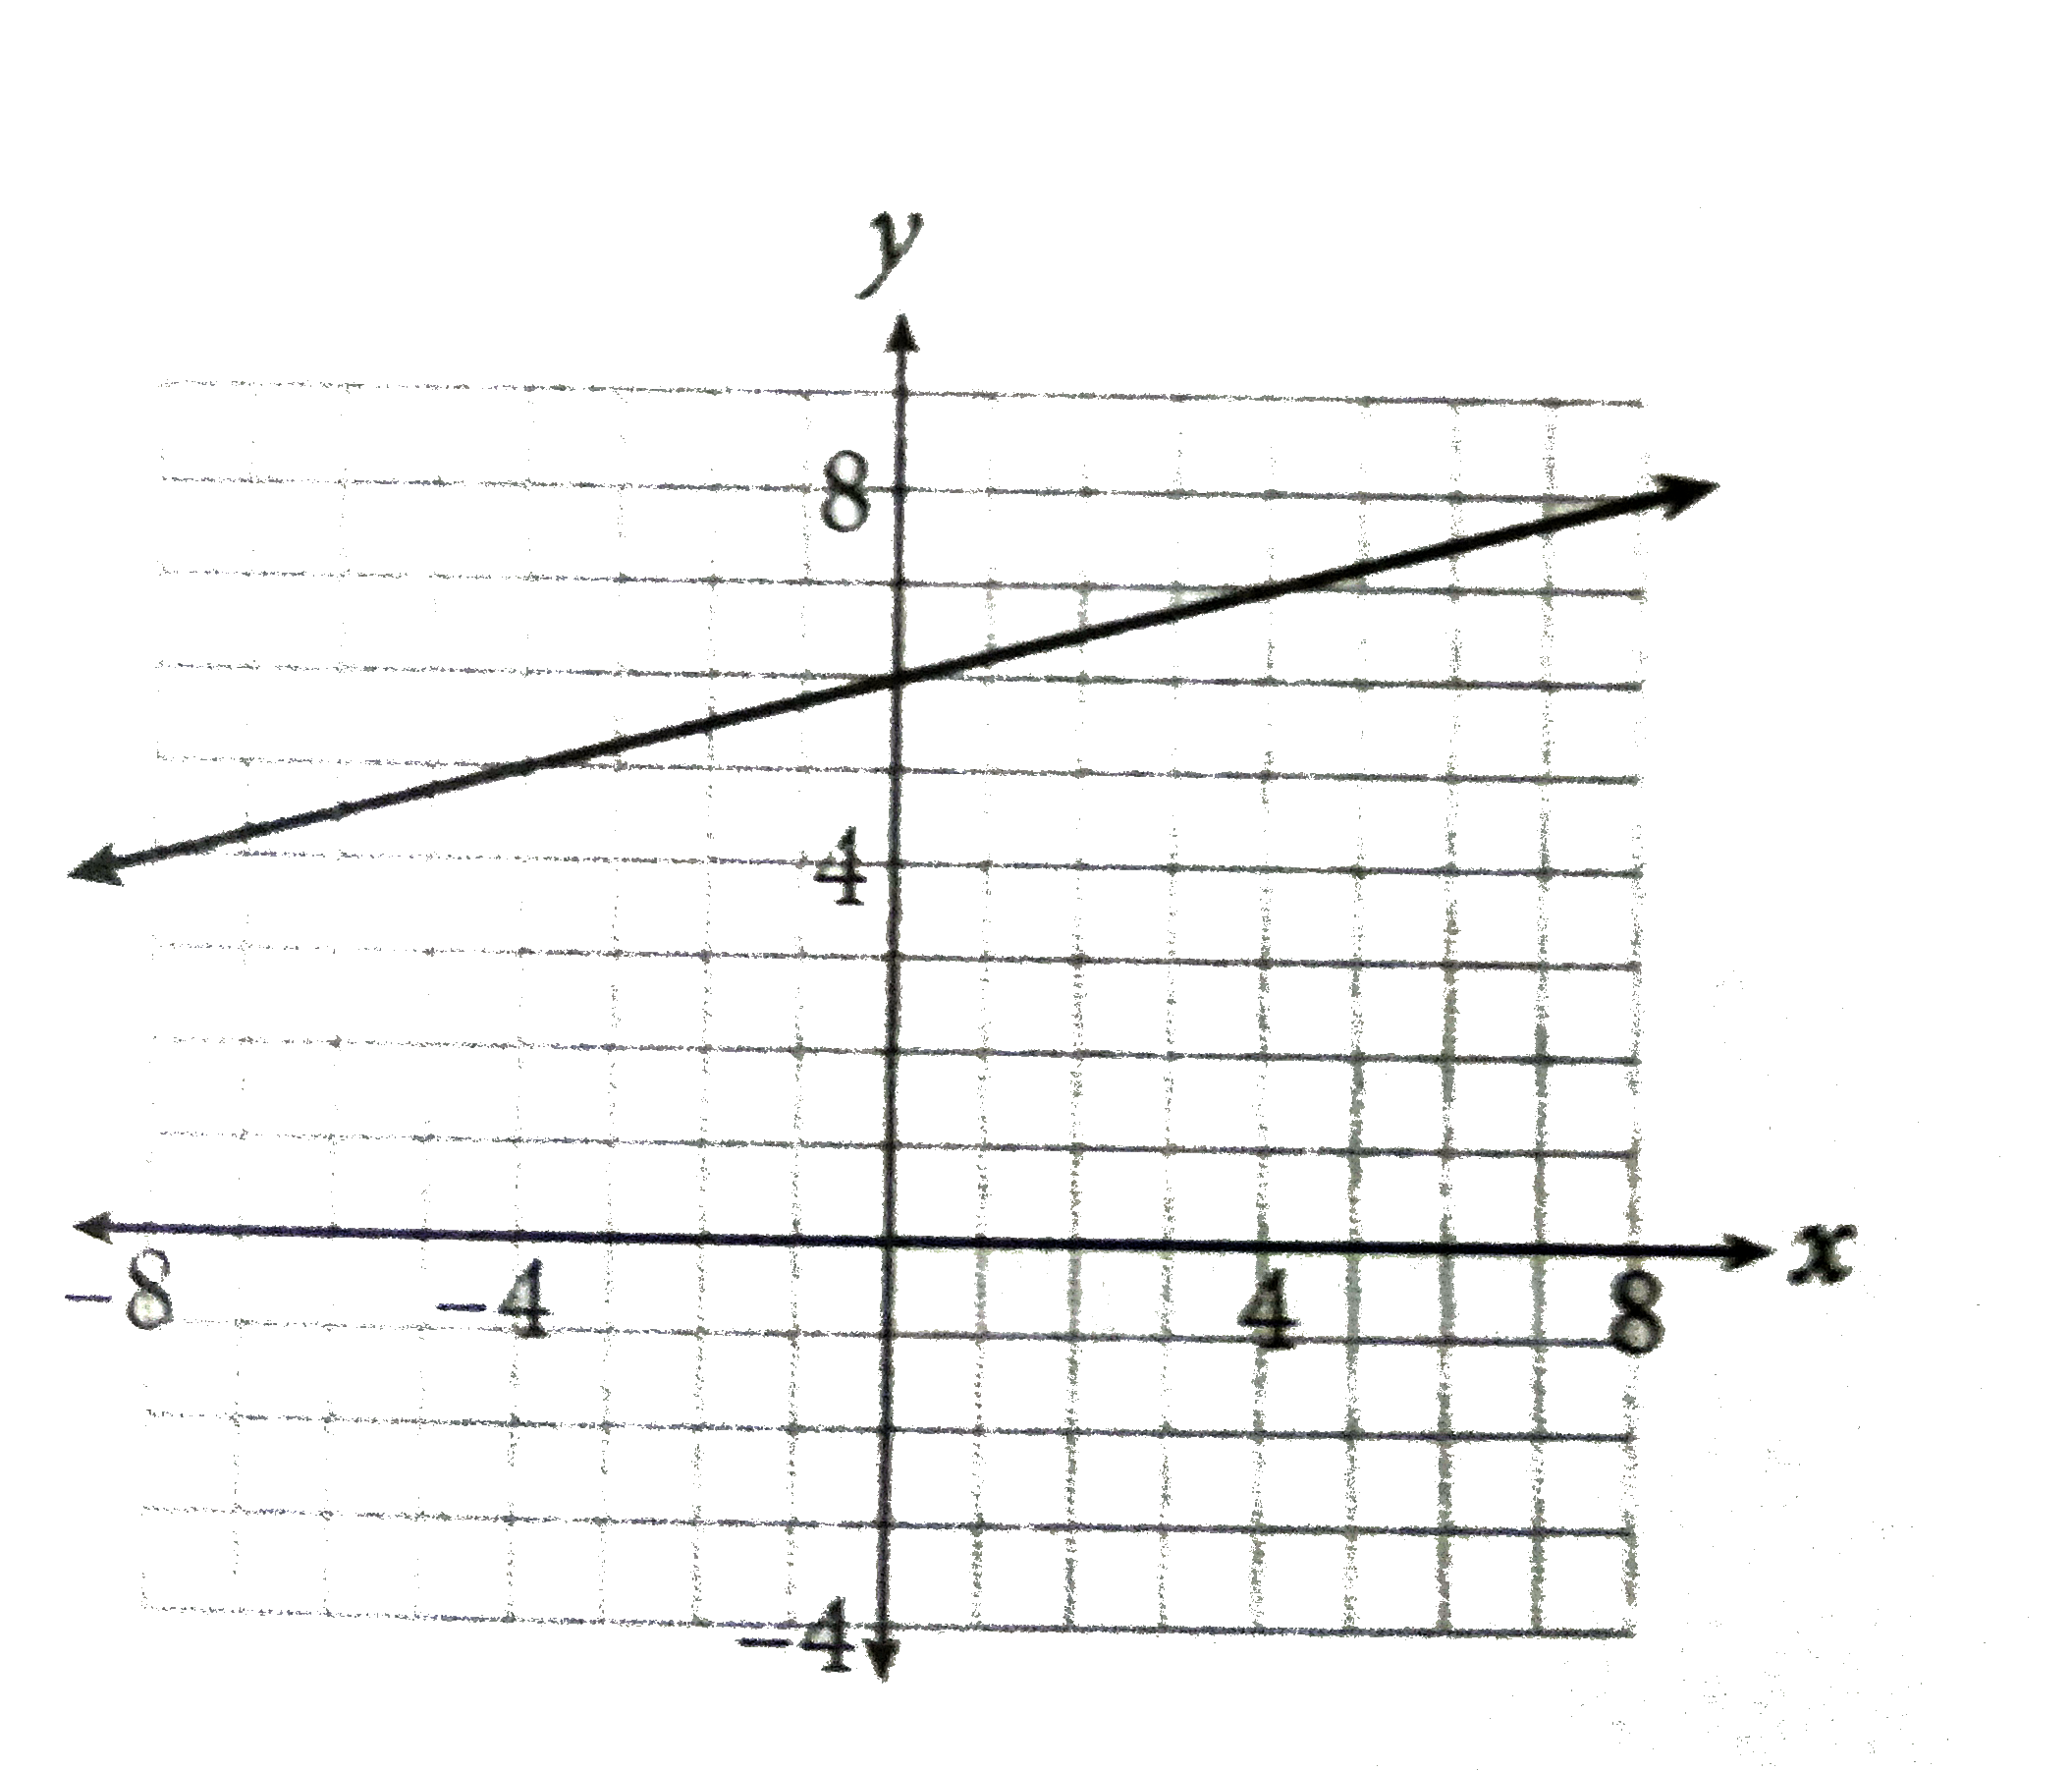
Which of the following equations represents the line shown in the graph?
View Solution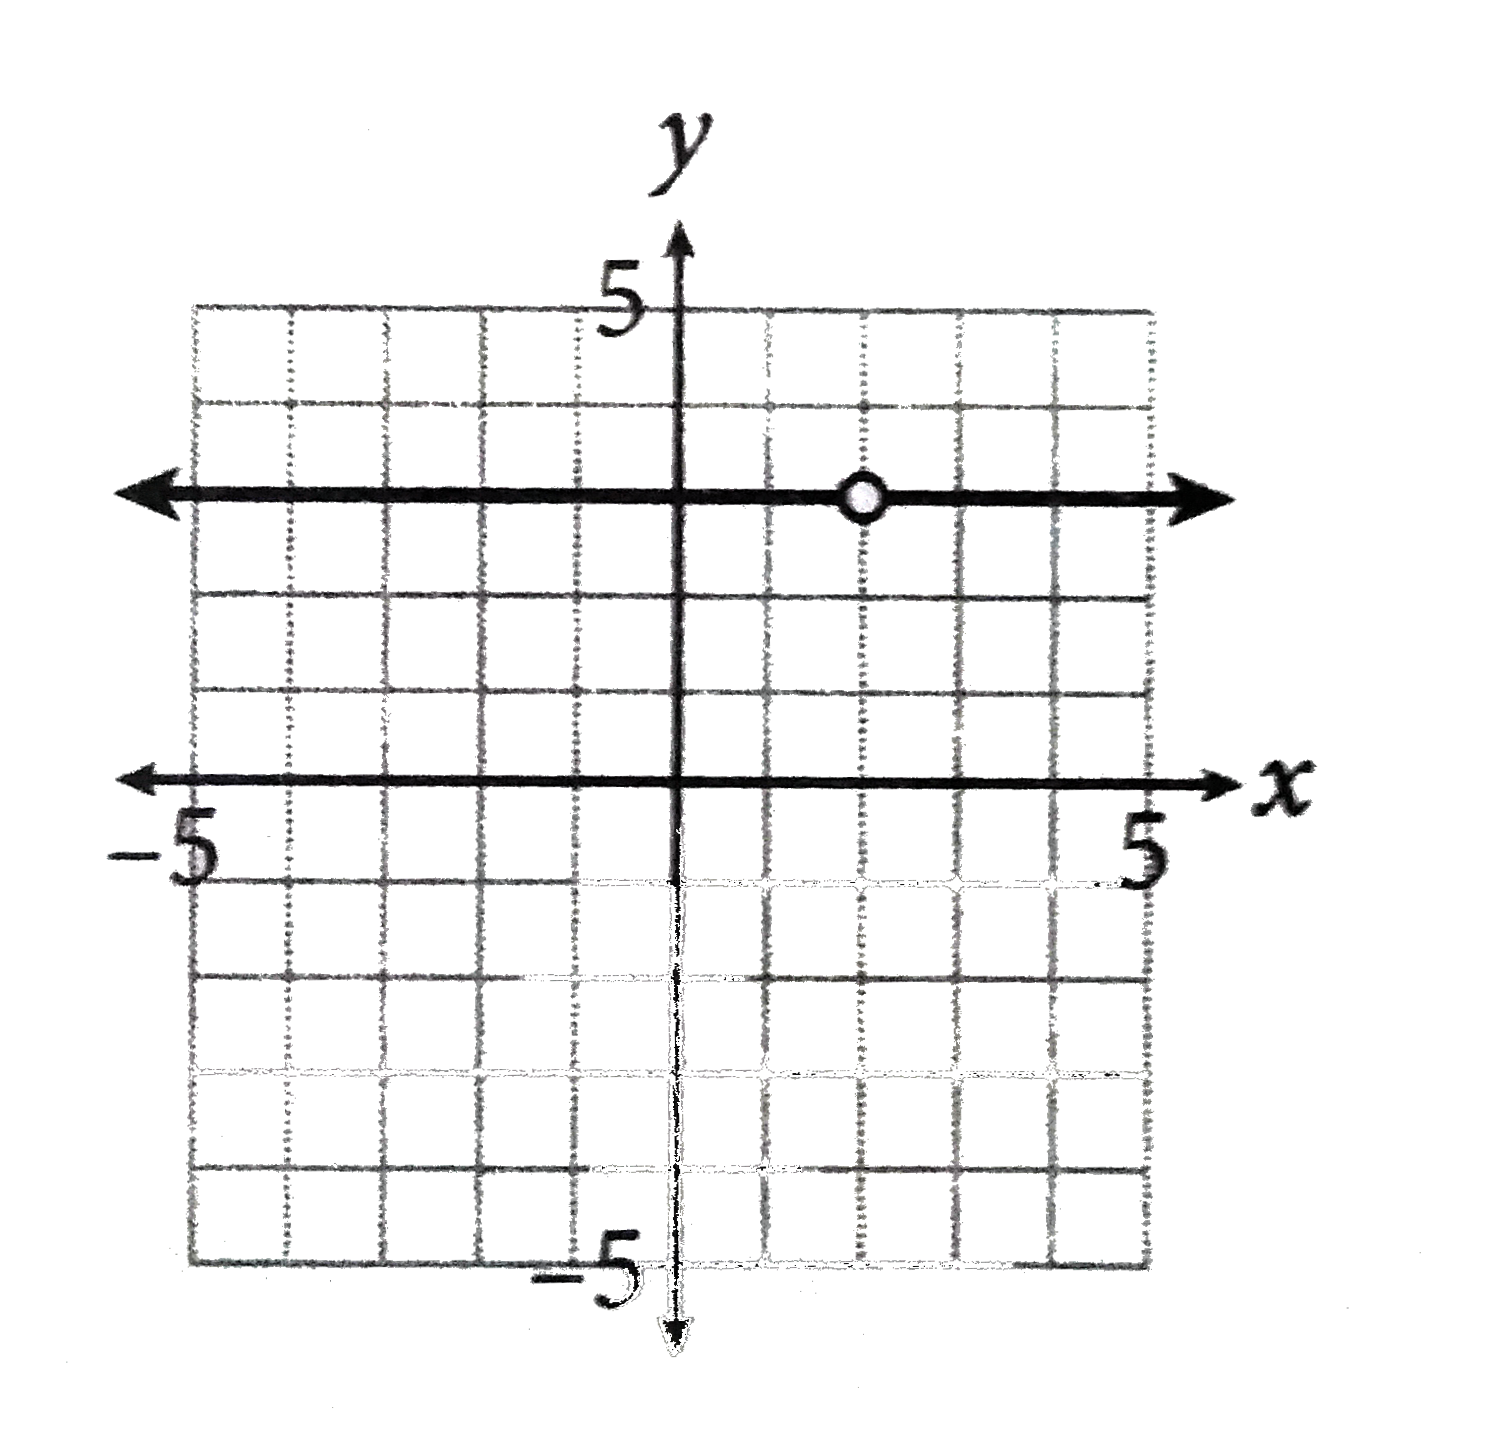
Which of the following rational functions could represent the graph shown?
View SolutionSolve the following inequality and represent the solution set on the real number line 2x−5≤5;x+4<11,where x∈I, I is a set of integers.
View SolutionSolve the following inequation and represent the solution set on the number line.
−3<−12−2x3≤56,x∈R.
View SolutionFor the following inequations, graph the solution set on the real number line :
x−1<3−x≤5
View SolutionFor the following inequations, graph the solution set on the real number line :
−4≤3x−1<8
View SolutionThe inequality representing the following graph is
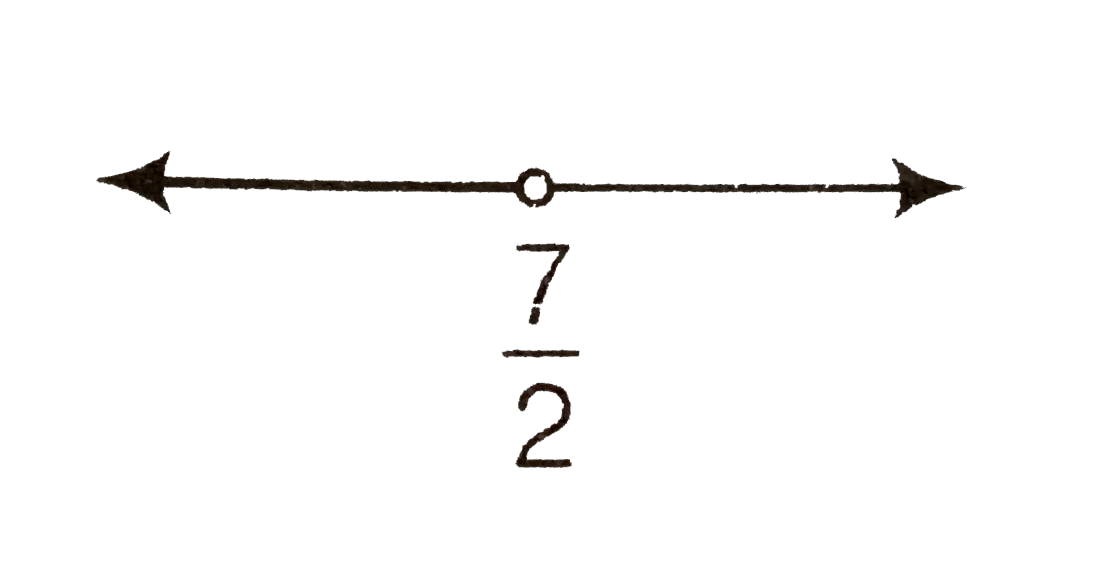
View SolutionThe inequality representing the following graph is
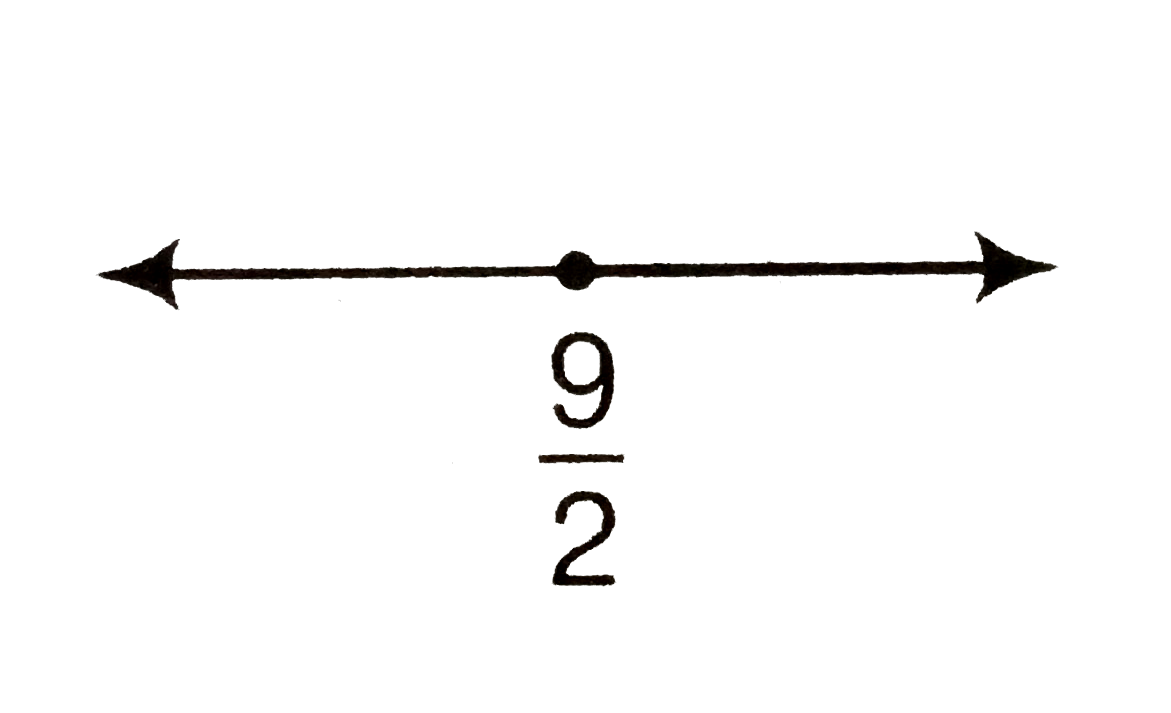
View SolutionThe inequality representing the following graph is
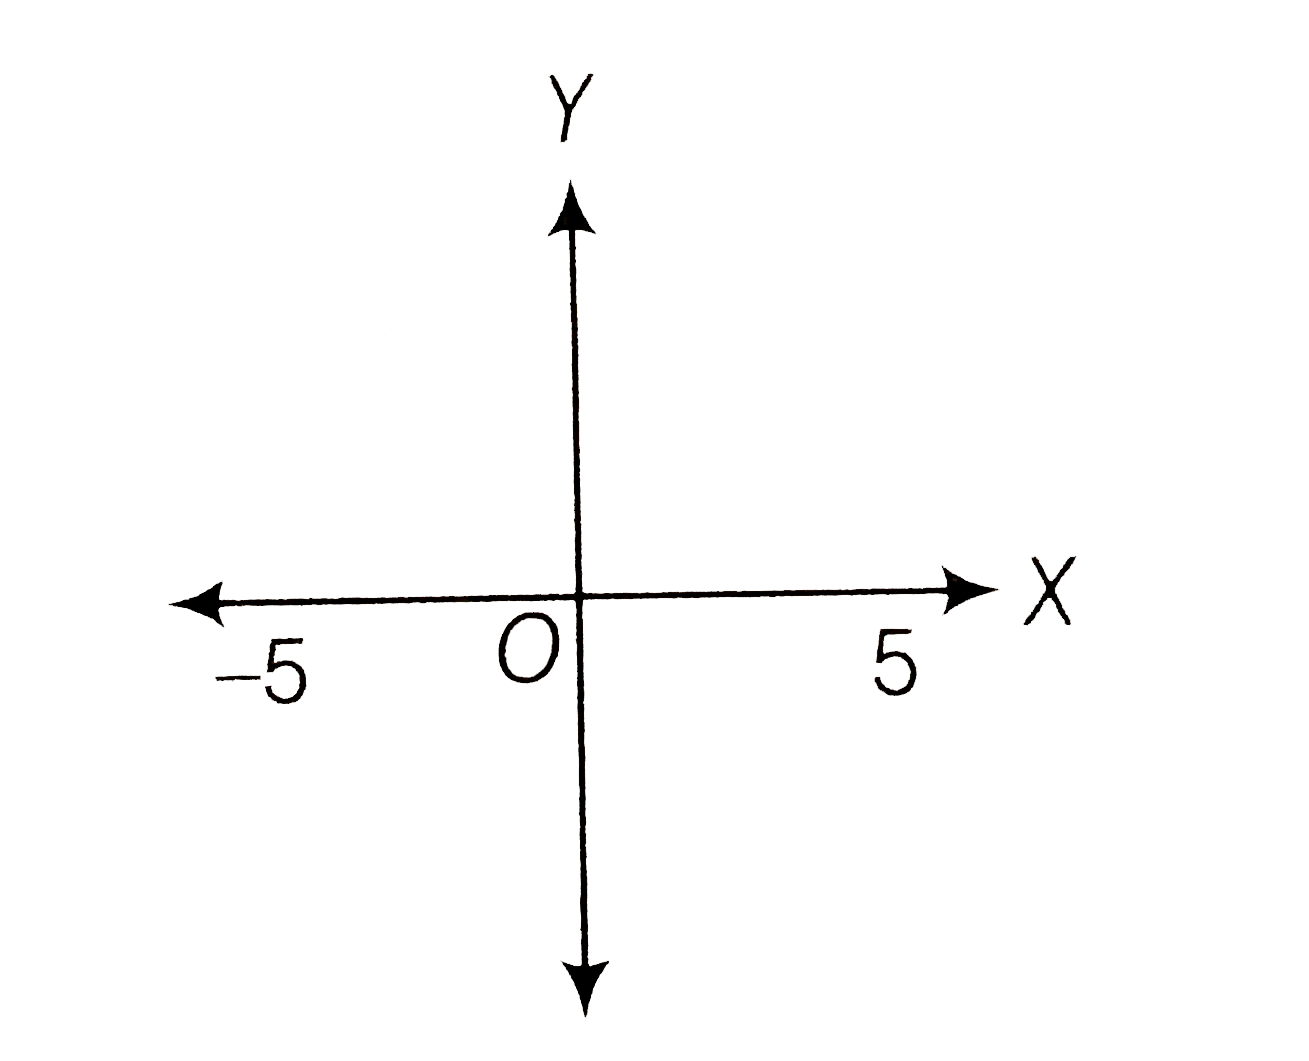
View Solution

