Which is not the graphical representation for the zeroth order reaction ?
The correct Answer is:C
To determine which graphical representation is not applicable for a zero-order reaction, we need to analyze the characteristics of zero-order reactions and their graphical representations.
1. Understanding Zero-Order Reactions:
- A zero-order reaction is one where the rate of reaction is constant and does not depend on the concentration of the reactants. This means that the rate of reaction remains the same regardless of how much reactant is present.
2. Rate Law for Zero-Order Reactions:
- The rate law can be expressed as:
Rate=k
where k is the rate constant. This indicates that the rate is independent of concentration.
3. Concentration vs. Time Graph:
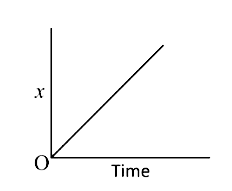
- For a zero-order reaction, if we plot concentration ((A)) of the reactant against time (t), we get a straight line with a negative slope. This is because the concentration decreases linearly over time:
(A)=(A)0−kt
- This graph is a valid representation for a zero-order reaction.
4. Rate vs. Time Graph:
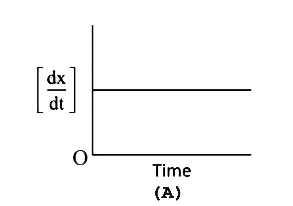
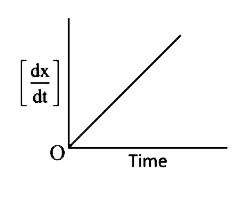
- The rate of reaction remains constant over time for a zero-order reaction. Therefore, if we plot the rate of reaction against time, we will get a horizontal line. This is also a valid representation.
5. Rate vs. Concentration Graph:
- For a zero-order reaction, the rate does not change with changes in concentration. If we plot the rate against concentration, we will get a horizontal line as well. This is valid too.
6. Logarithmic Graphs:
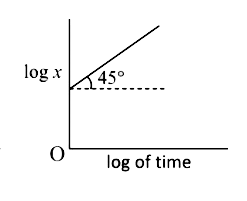
- If we consider a logarithmic representation (like log of concentration vs. time), this is typically associated with first-order reactions. For zero-order reactions, the logarithmic relationship does not hold as the rate is constant and does not depend on concentration.
7. Conclusion:
- Based on the analysis, the graphical representation that does not apply to a zero-order reaction is the one that suggests a logarithmic relationship between concentration and time.
Answer:
The graphical representation that is not applicable for a zero-order reaction is the logarithmic graph (log (A) vs. time).
- A zero-order reaction is one where the rate of reaction is constant and does not depend on the concentration of the reactants. This means that the rate of reaction remains the same regardless of how much reactant is present.
- The rate law can be expressed as:
Rate=k
where k is the rate constant. This indicates that the rate is independent of concentration.
- For a zero-order reaction, if we plot concentration ((A)) of the reactant against time (t), we get a straight line with a negative slope. This is because the concentration decreases linearly over time:
(A)=(A)0−kt
- This graph is a valid representation for a zero-order reaction.
- The rate of reaction remains constant over time for a zero-order reaction. Therefore, if we plot the rate of reaction against time, we will get a horizontal line. This is also a valid representation.
- For a zero-order reaction, the rate does not change with changes in concentration. If we plot the rate against concentration, we will get a horizontal line as well. This is valid too.
- If we consider a logarithmic representation (like log of concentration vs. time), this is typically associated with first-order reactions. For zero-order reactions, the logarithmic relationship does not hold as the rate is constant and does not depend on concentration.
- Based on the analysis, the graphical representation that does not apply to a zero-order reaction is the one that suggests a logarithmic relationship between concentration and time.
The graphical representation that is not applicable for a zero-order reaction is the logarithmic graph (log (A) vs. time).
Similar Questions
Knowledge Check
Which is a graphical representation of an application ?
AWindows 95BWindows ExplorerCTaskbarDNone of theseSelect the correct graphical representation :
A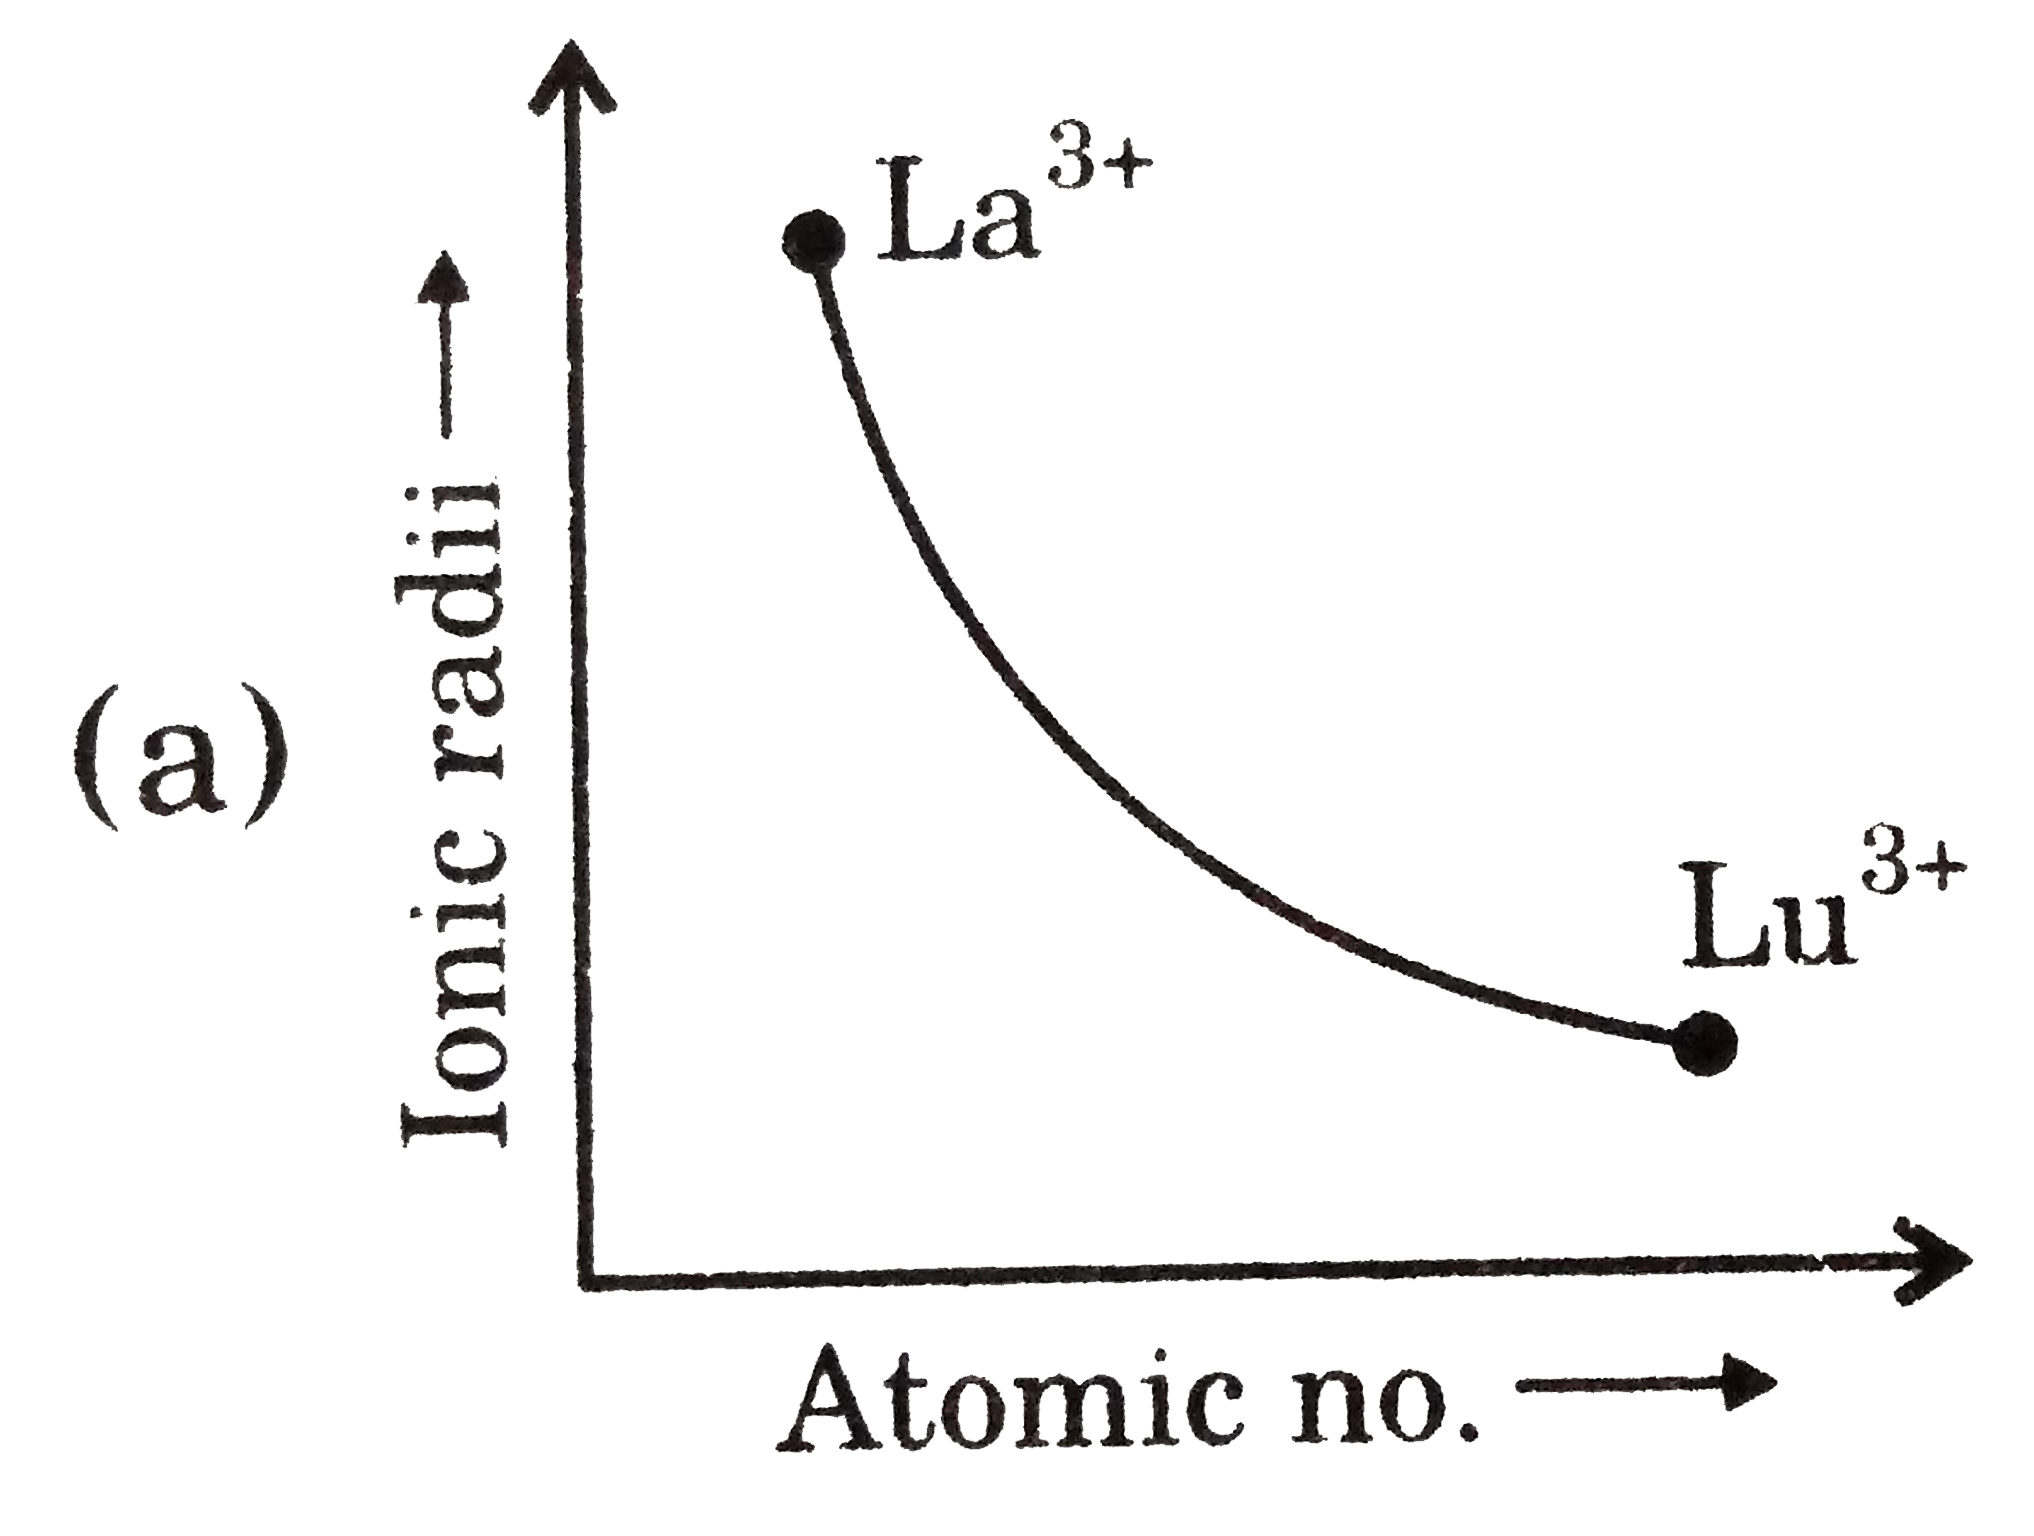 B
B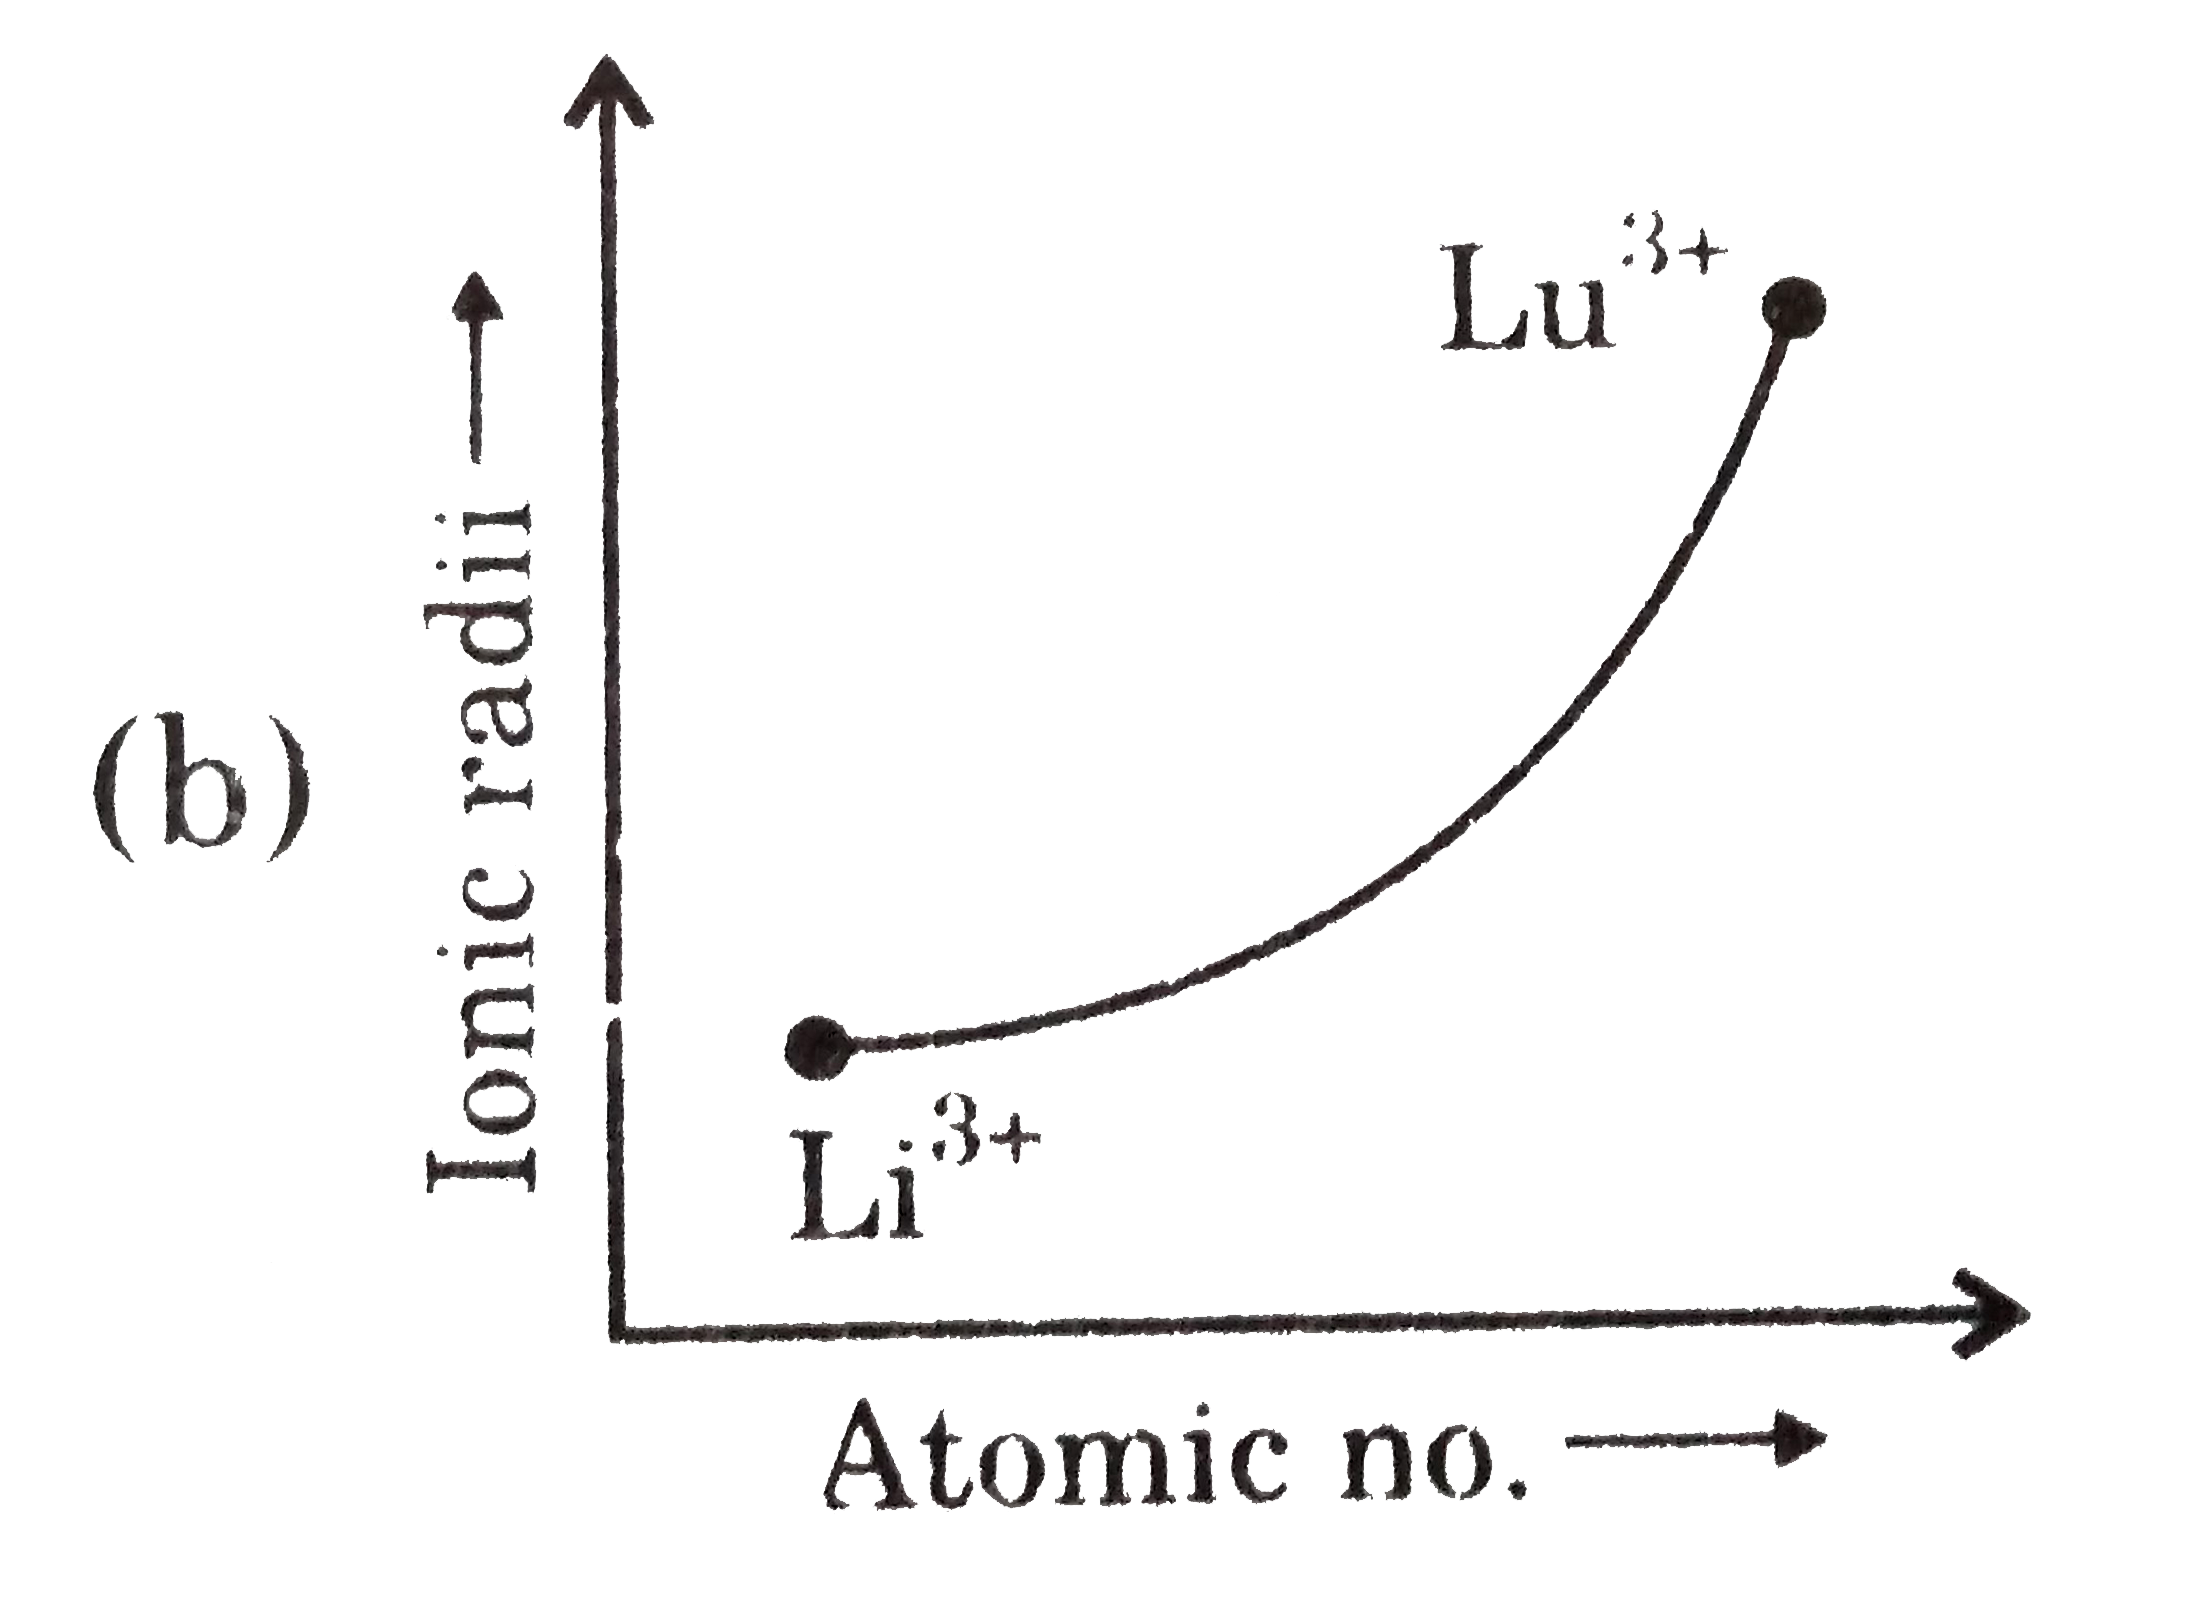 C
C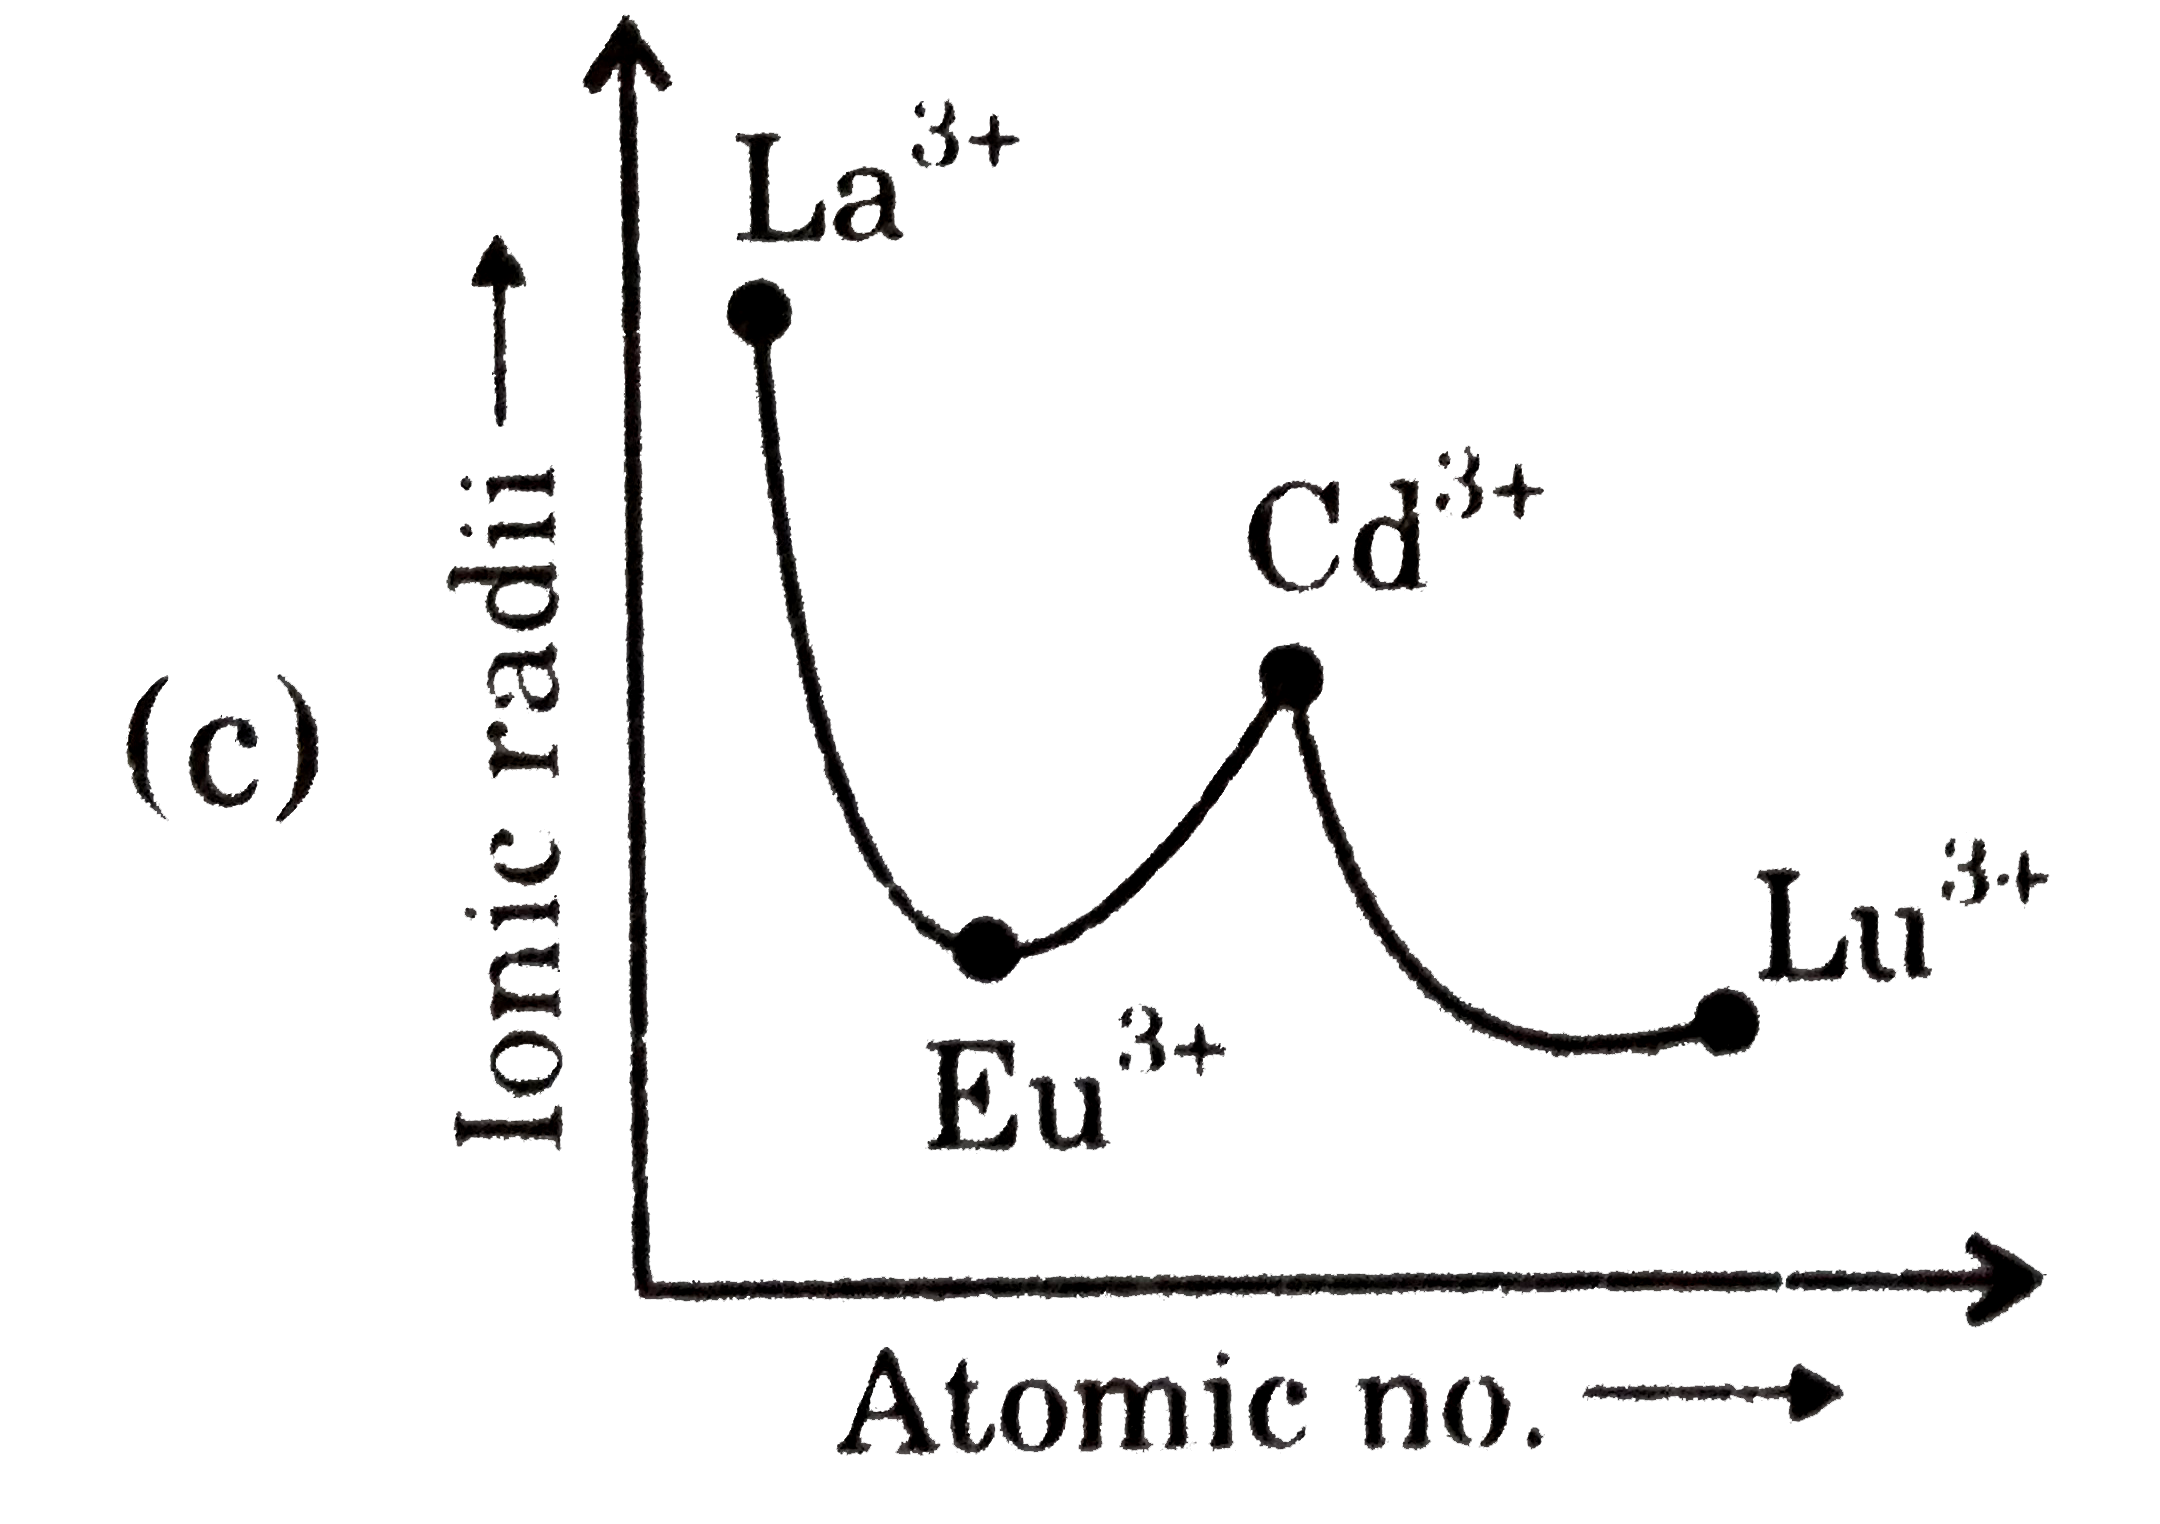 D
D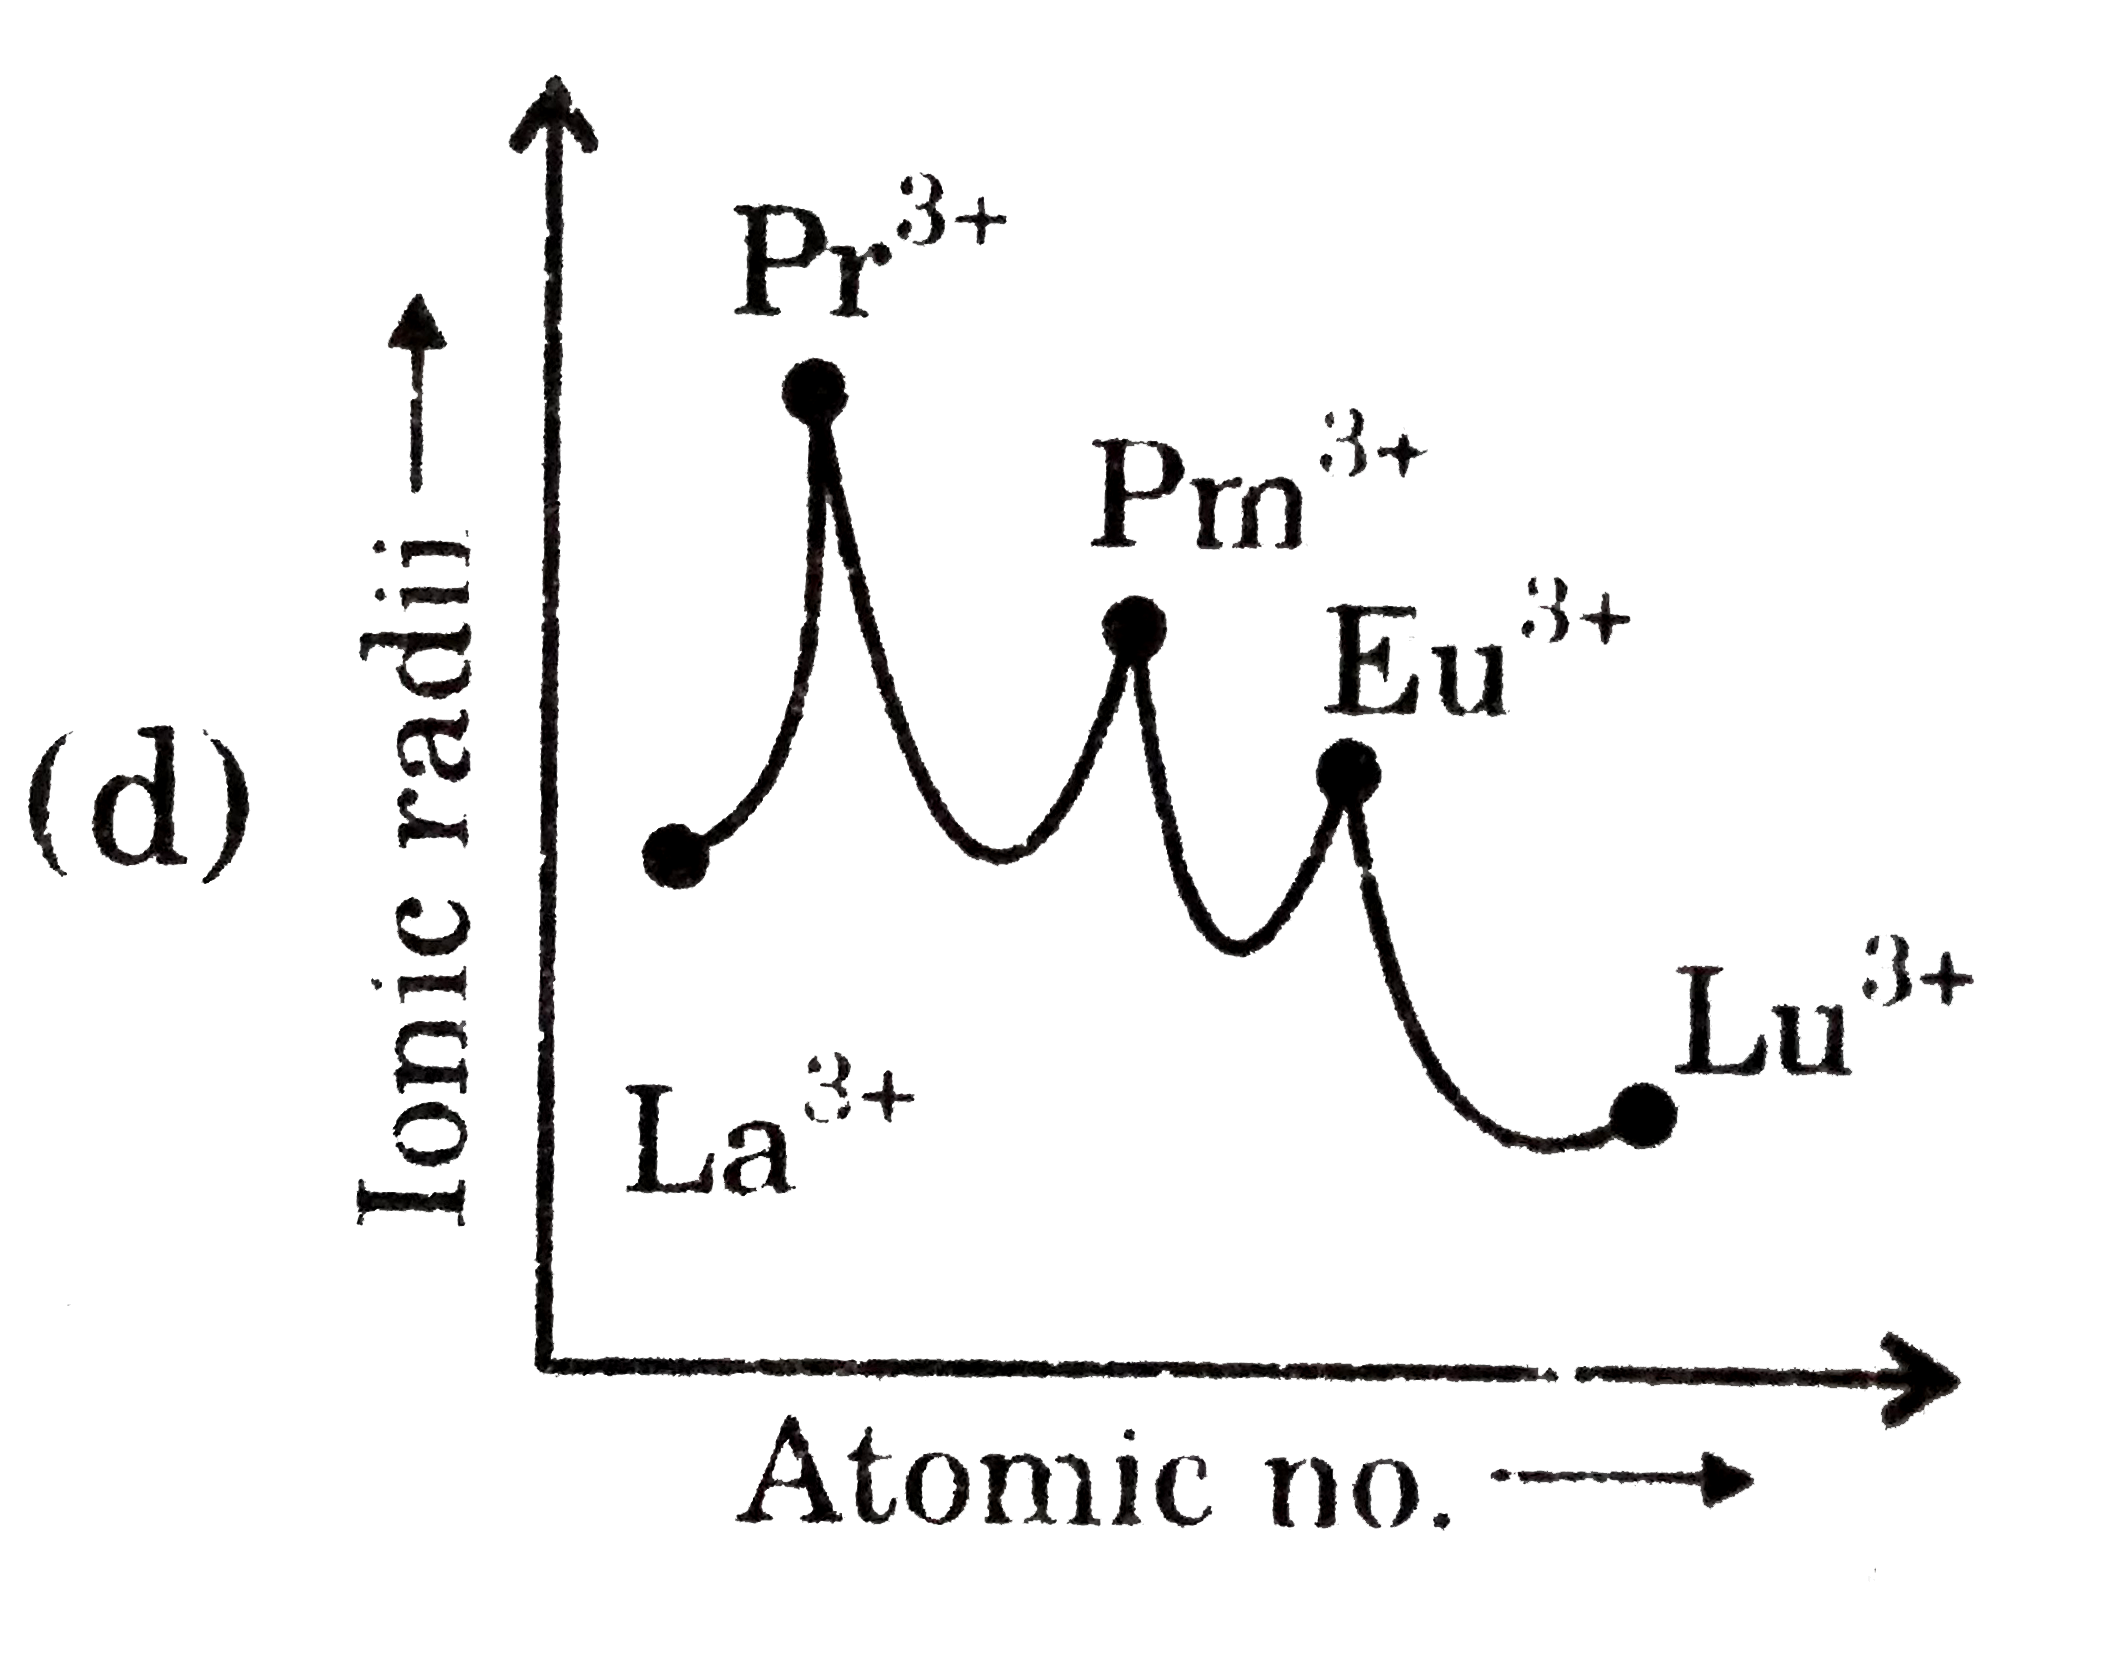
When HCl (aq) is titrated with NaOH(aq) conductometrically then the graphical representation of the titration will be
A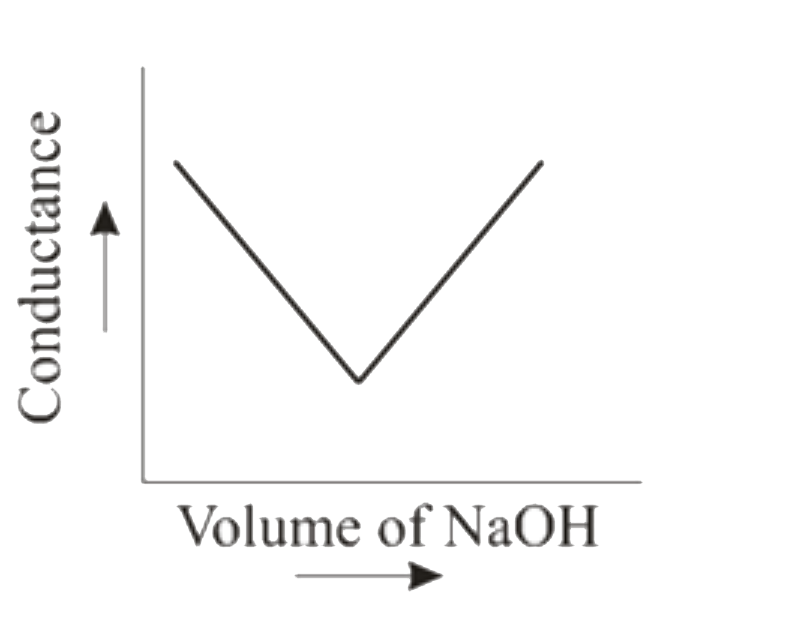 B
B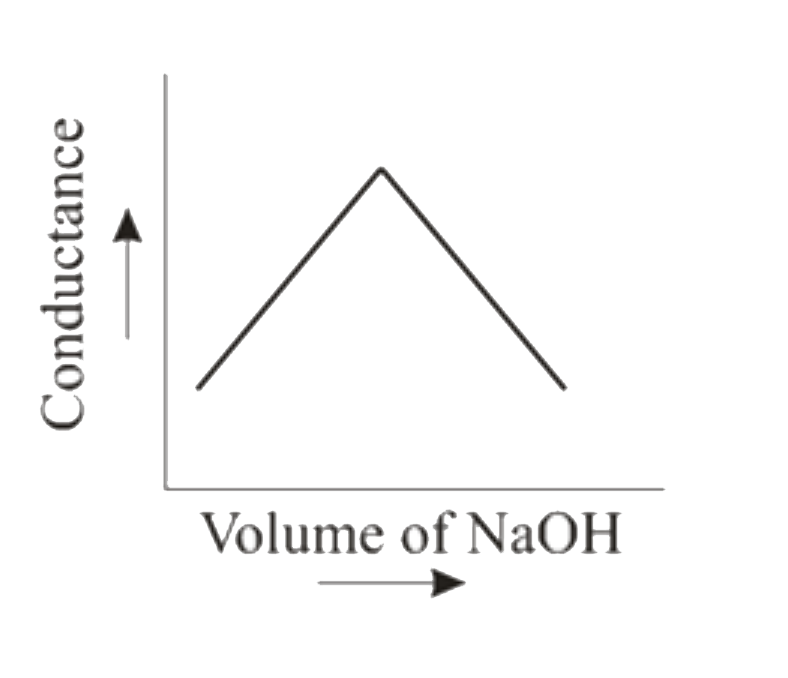 C
C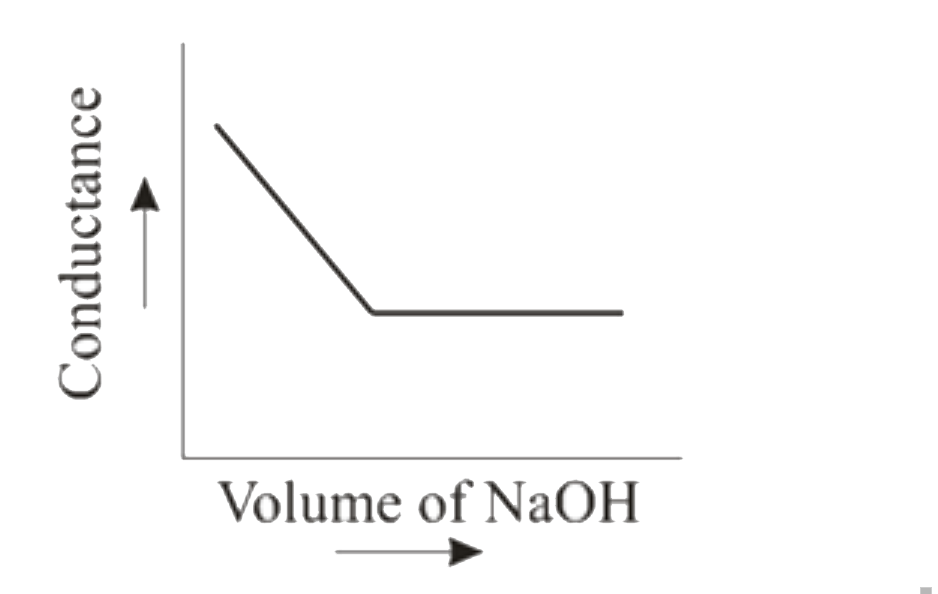 D
D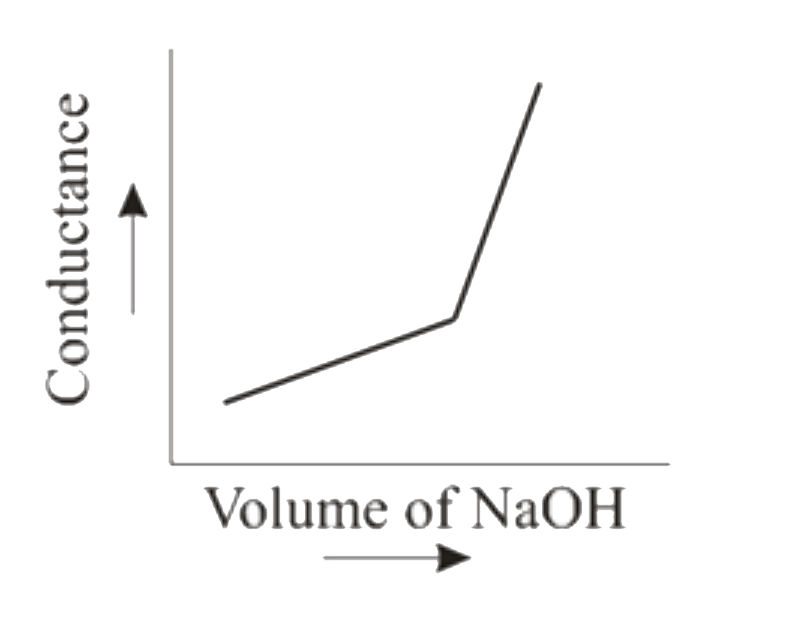
Graphical representation of raoults law
View SolutionGraphical Representation For Motion
View SolutionThis graphical representation specifics

View SolutionSecond Order Reaction and its characteristics | Graphical representation of Second order reaction | Pseudo First Order Reaction
View SolutionGraphical representation of cartesian product
View Solution

