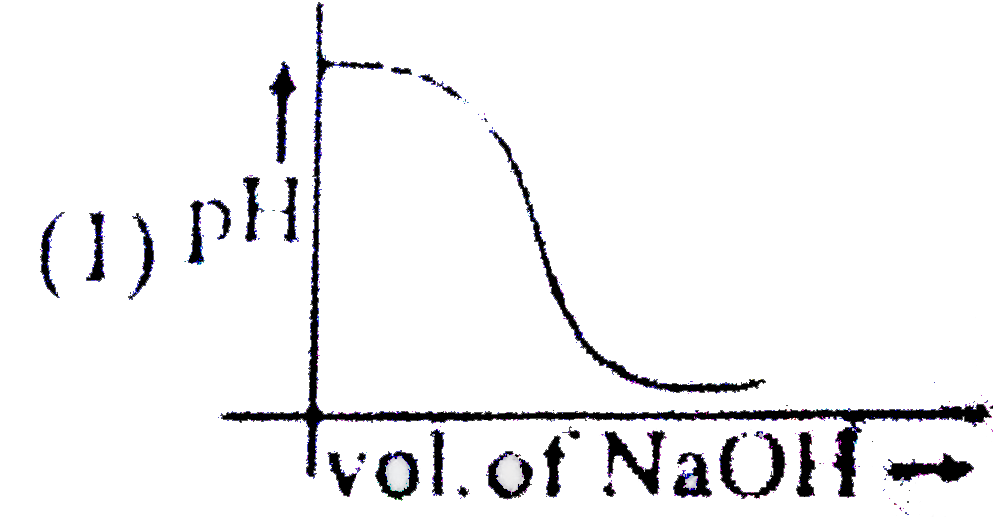
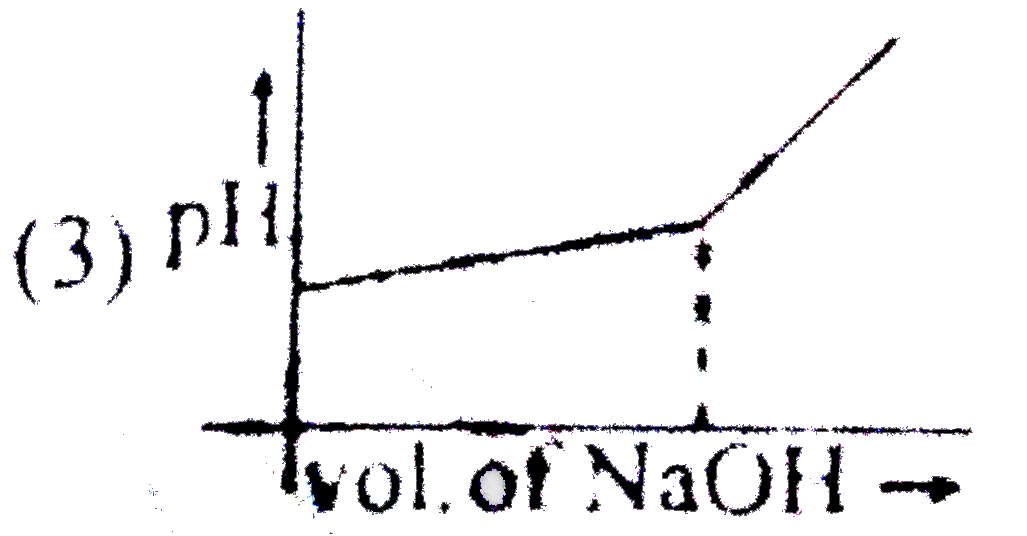
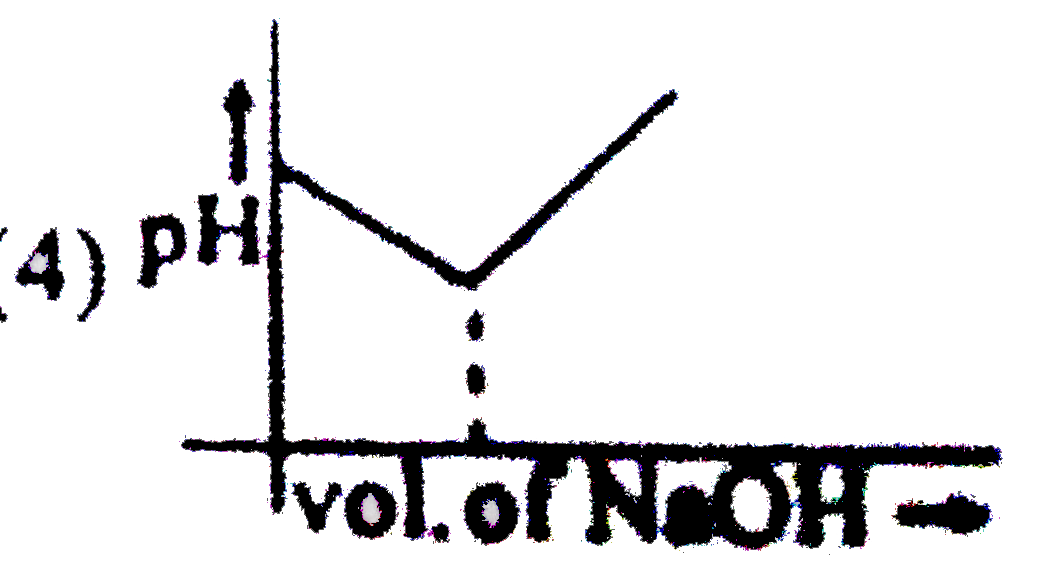
which one of the following curves represents the graph of pH during titration of NaOH and HCl (aq).?
A
B

C
D
Text Solution
The correct Answer is:B
pH first almost ramins same than suddenly ↑ and then become almost same .
|
Topper's Solved these Questions
Similar Questions
Knowledge Check
Which one of the following curves represents the graph pH during the titration of NaOH and HCl(aq)
A B
B C
C D
D
Which one of the following graphs represents motion?
A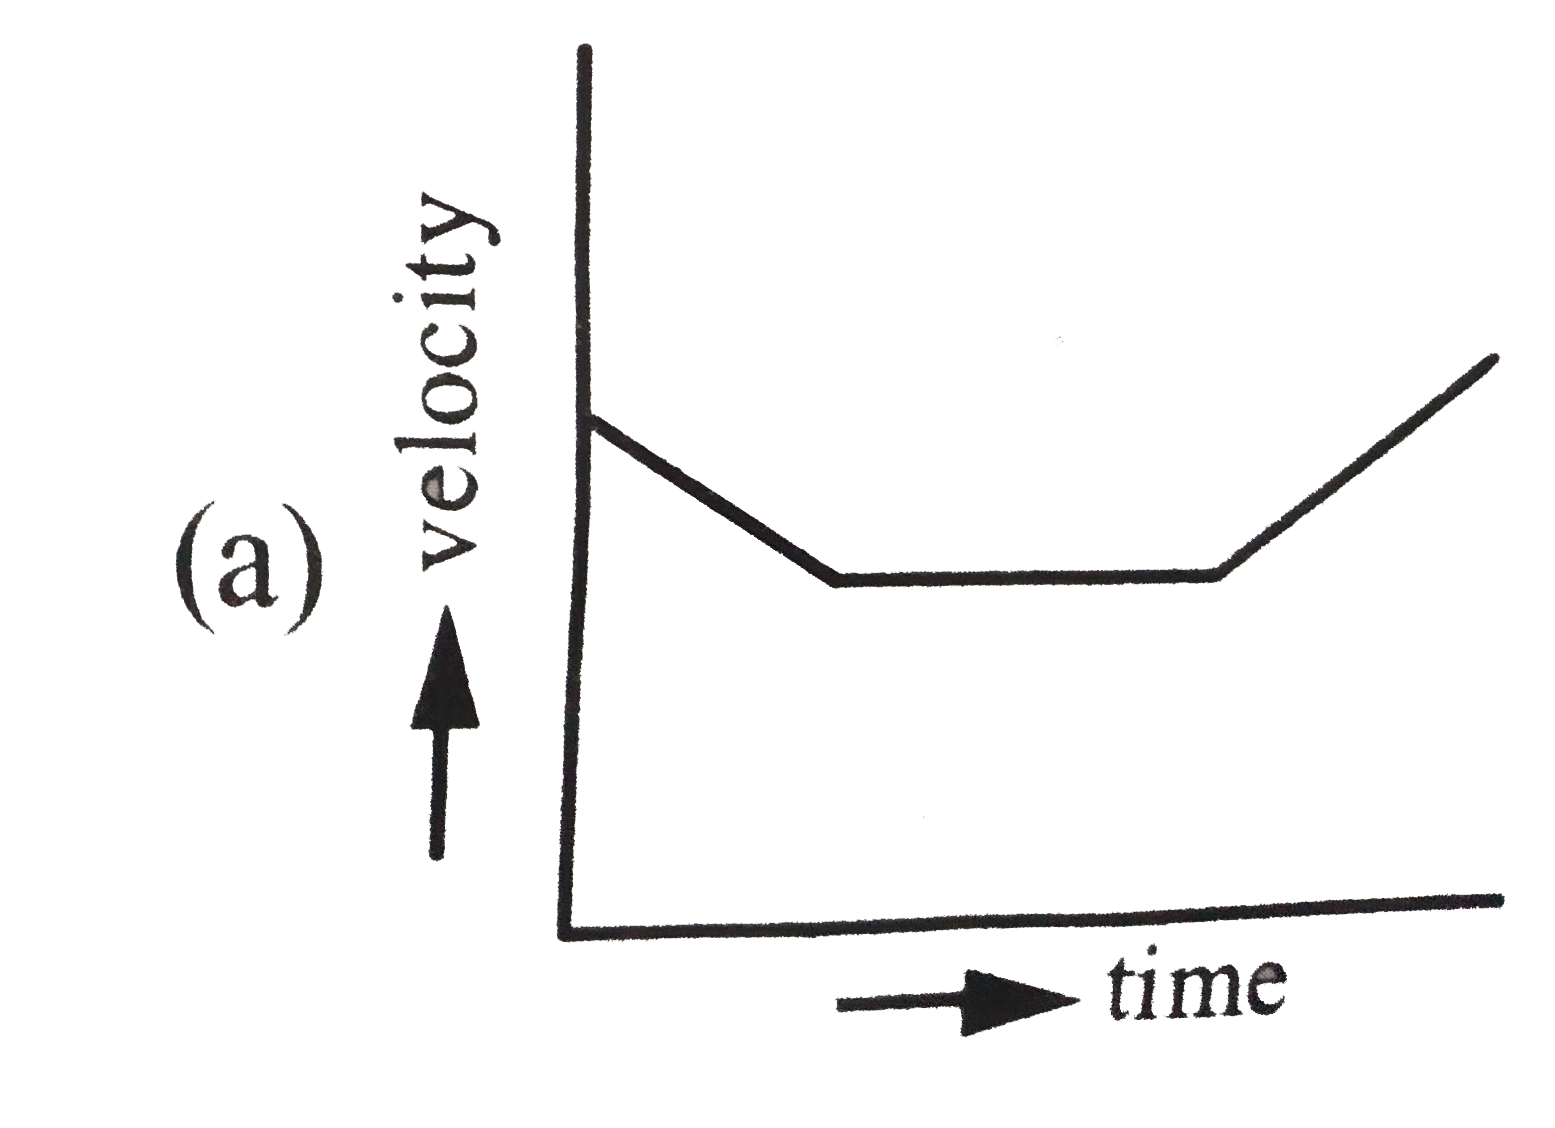 B
B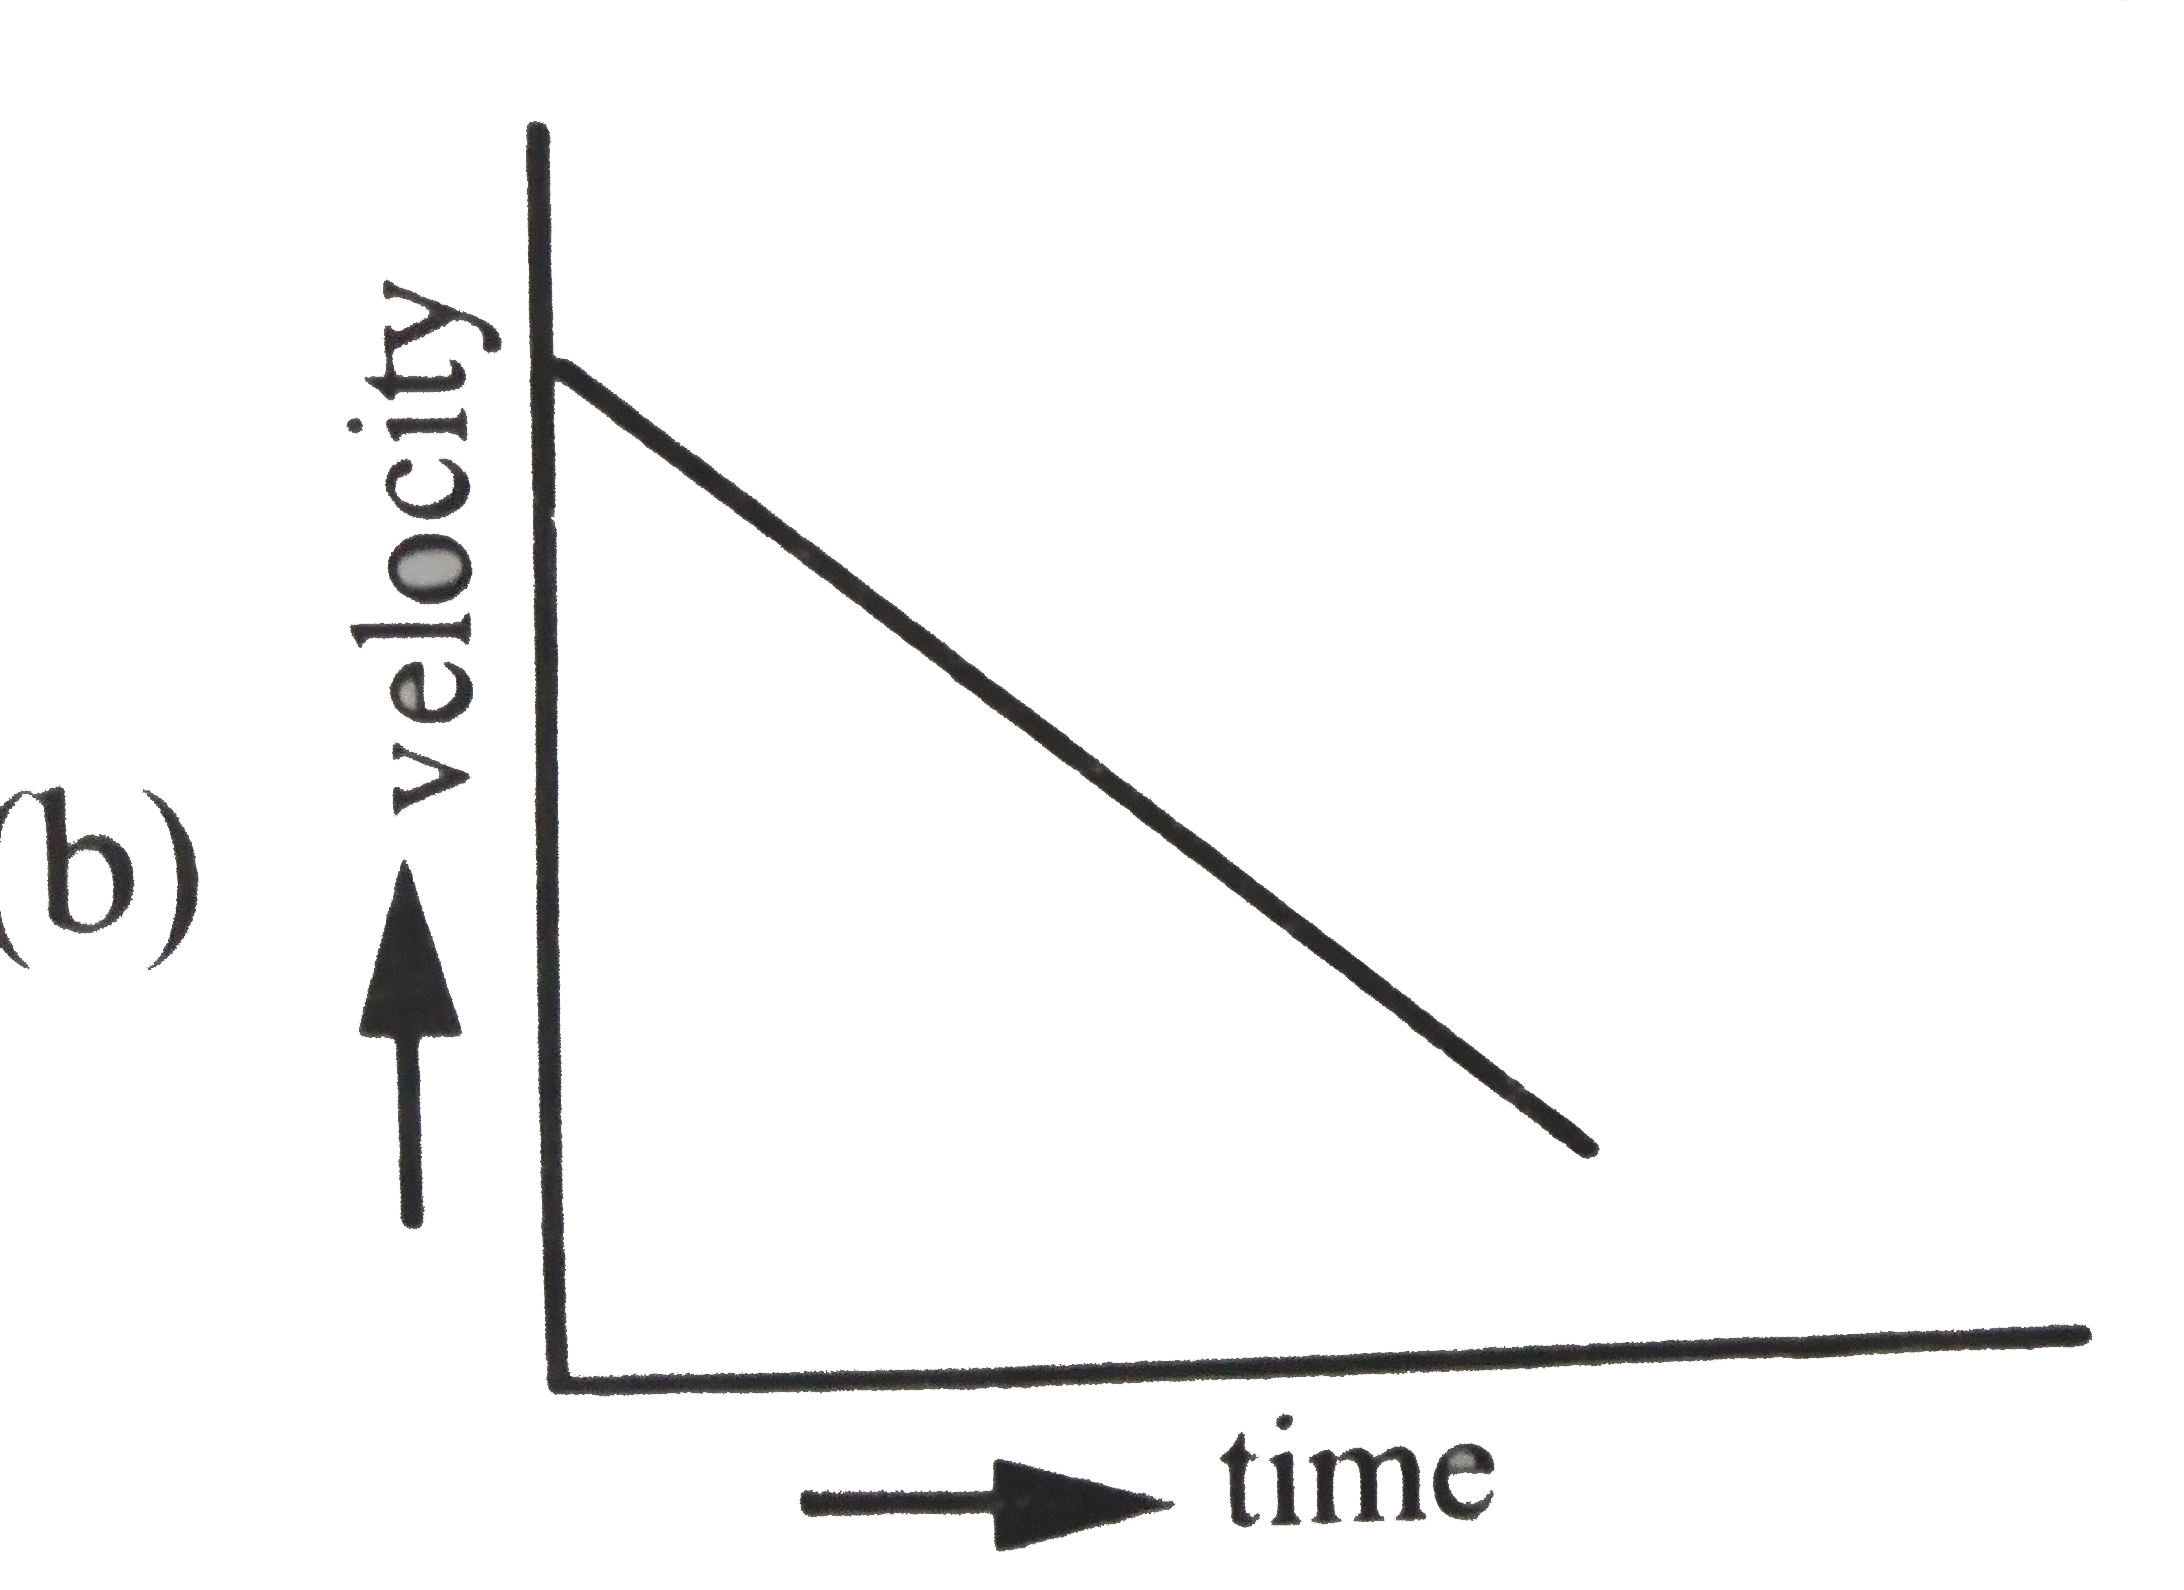 C
C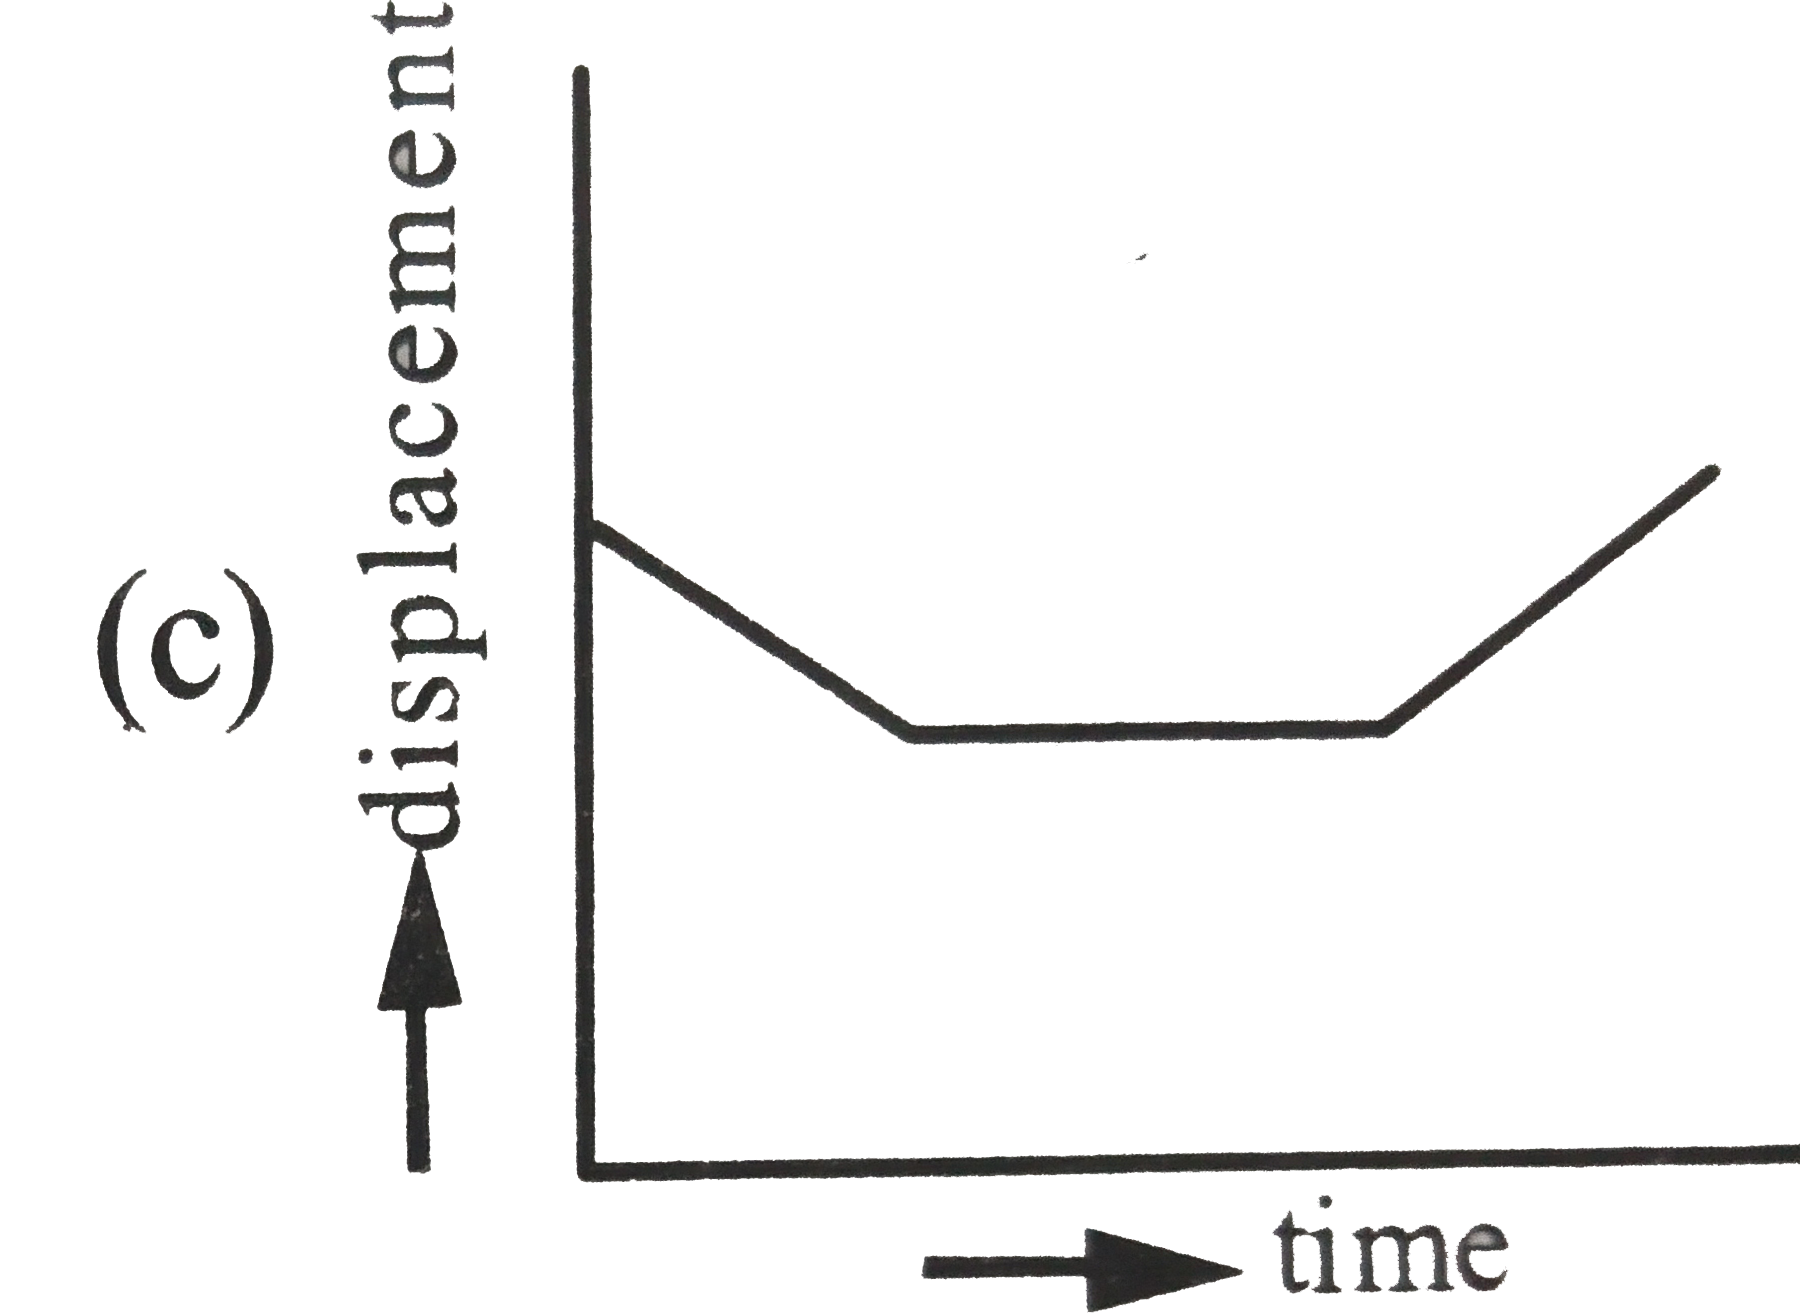 D
D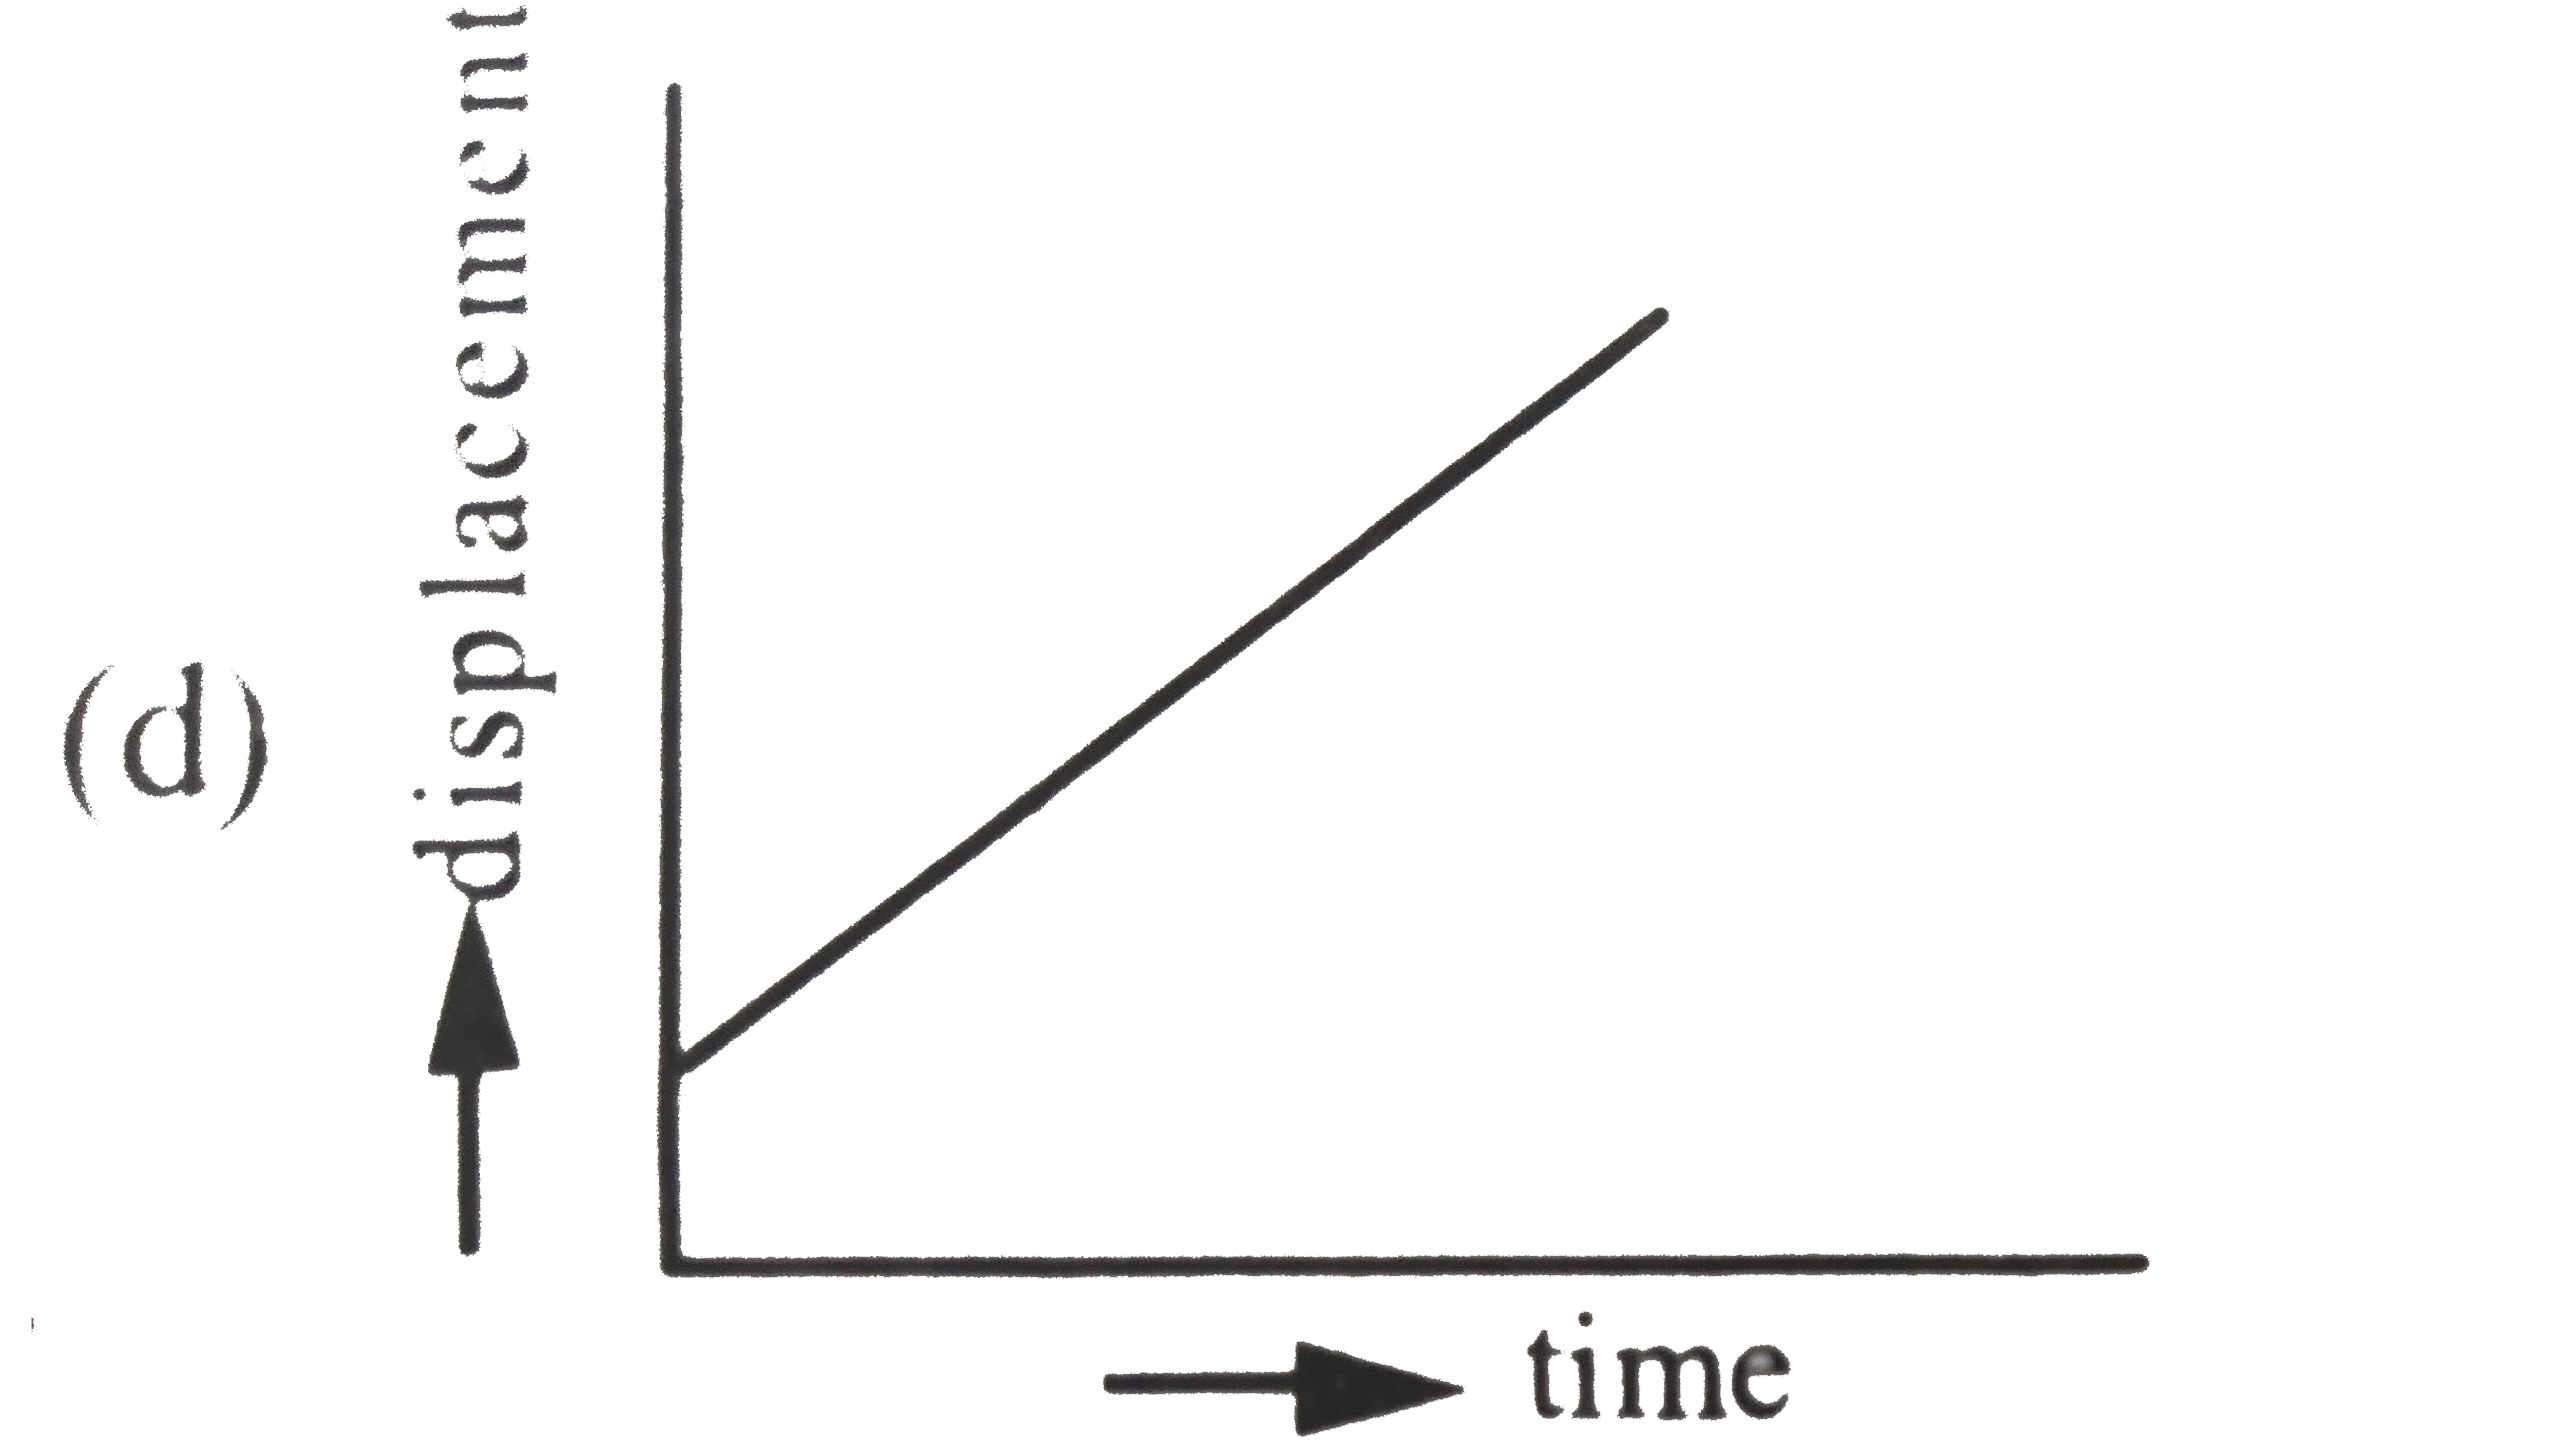
The curve represents the titration of :
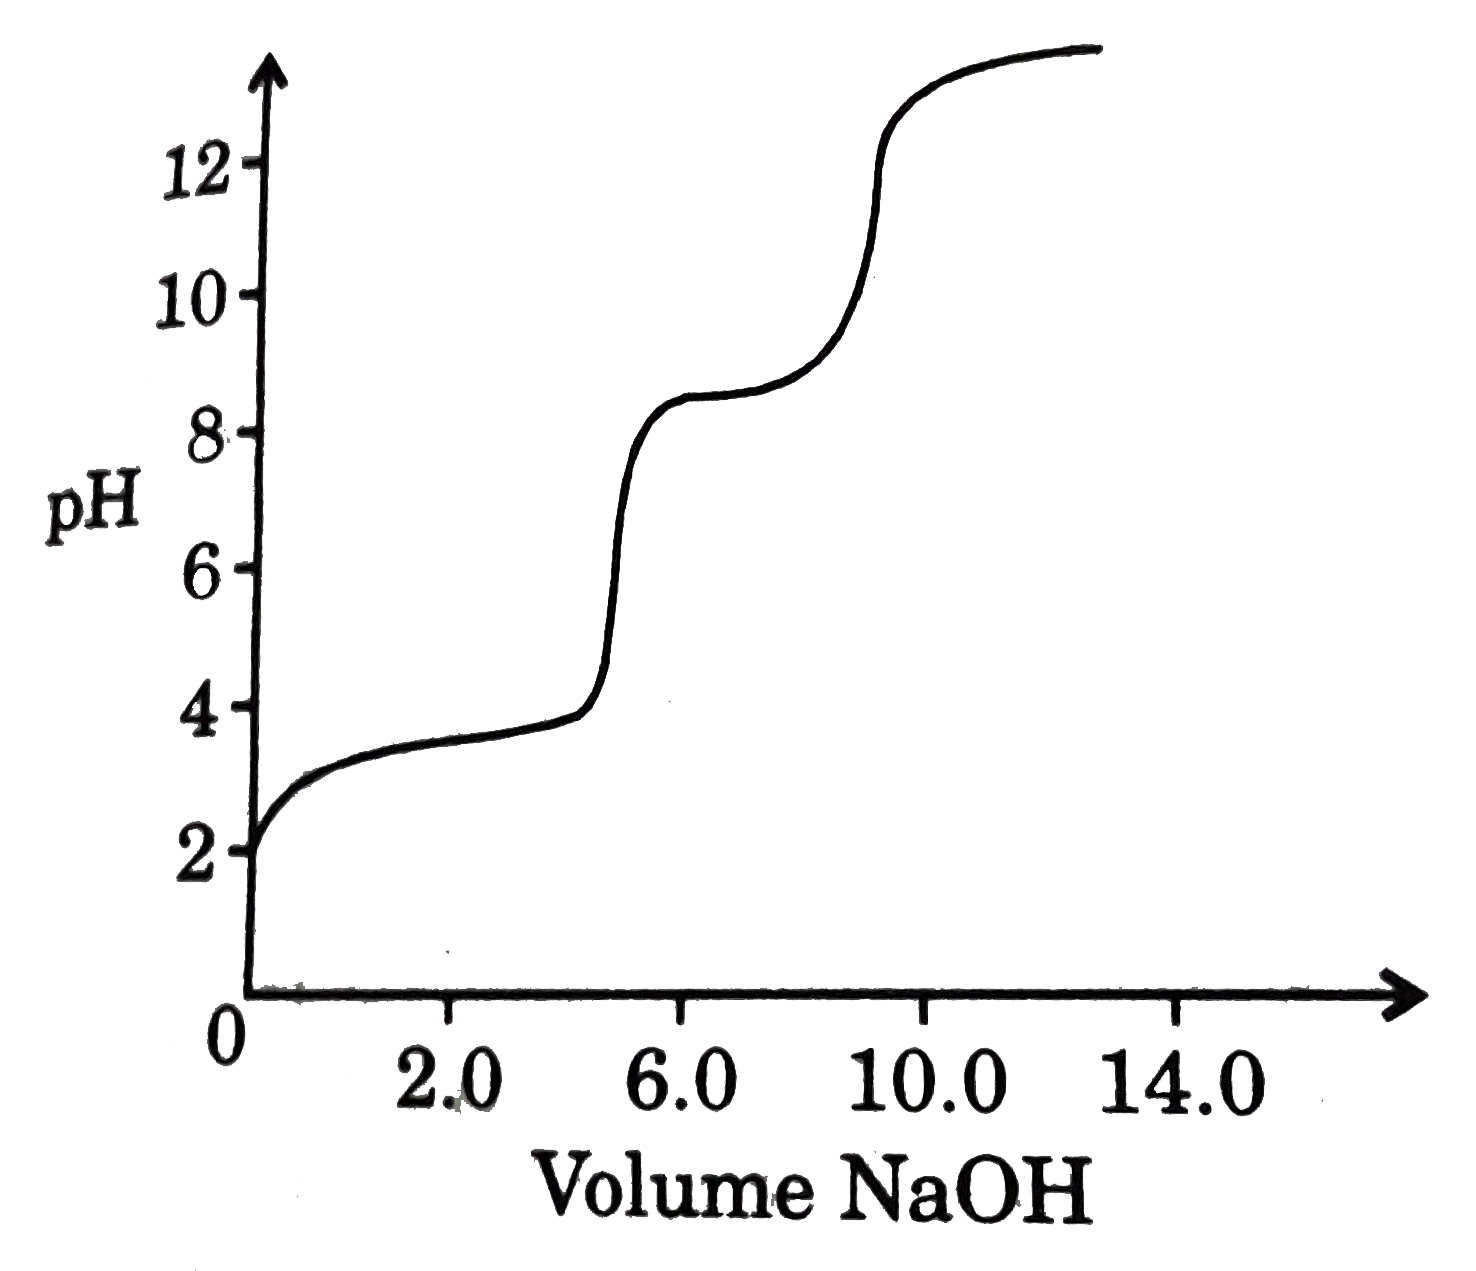 Aa diprotic acidBtwo monoprotic acids with the same Kas but different concentrations.Ctwo monoprotic acid with different Kas but the same concentrationsDtwo monoprotic acids with different Kas and different concentrations.
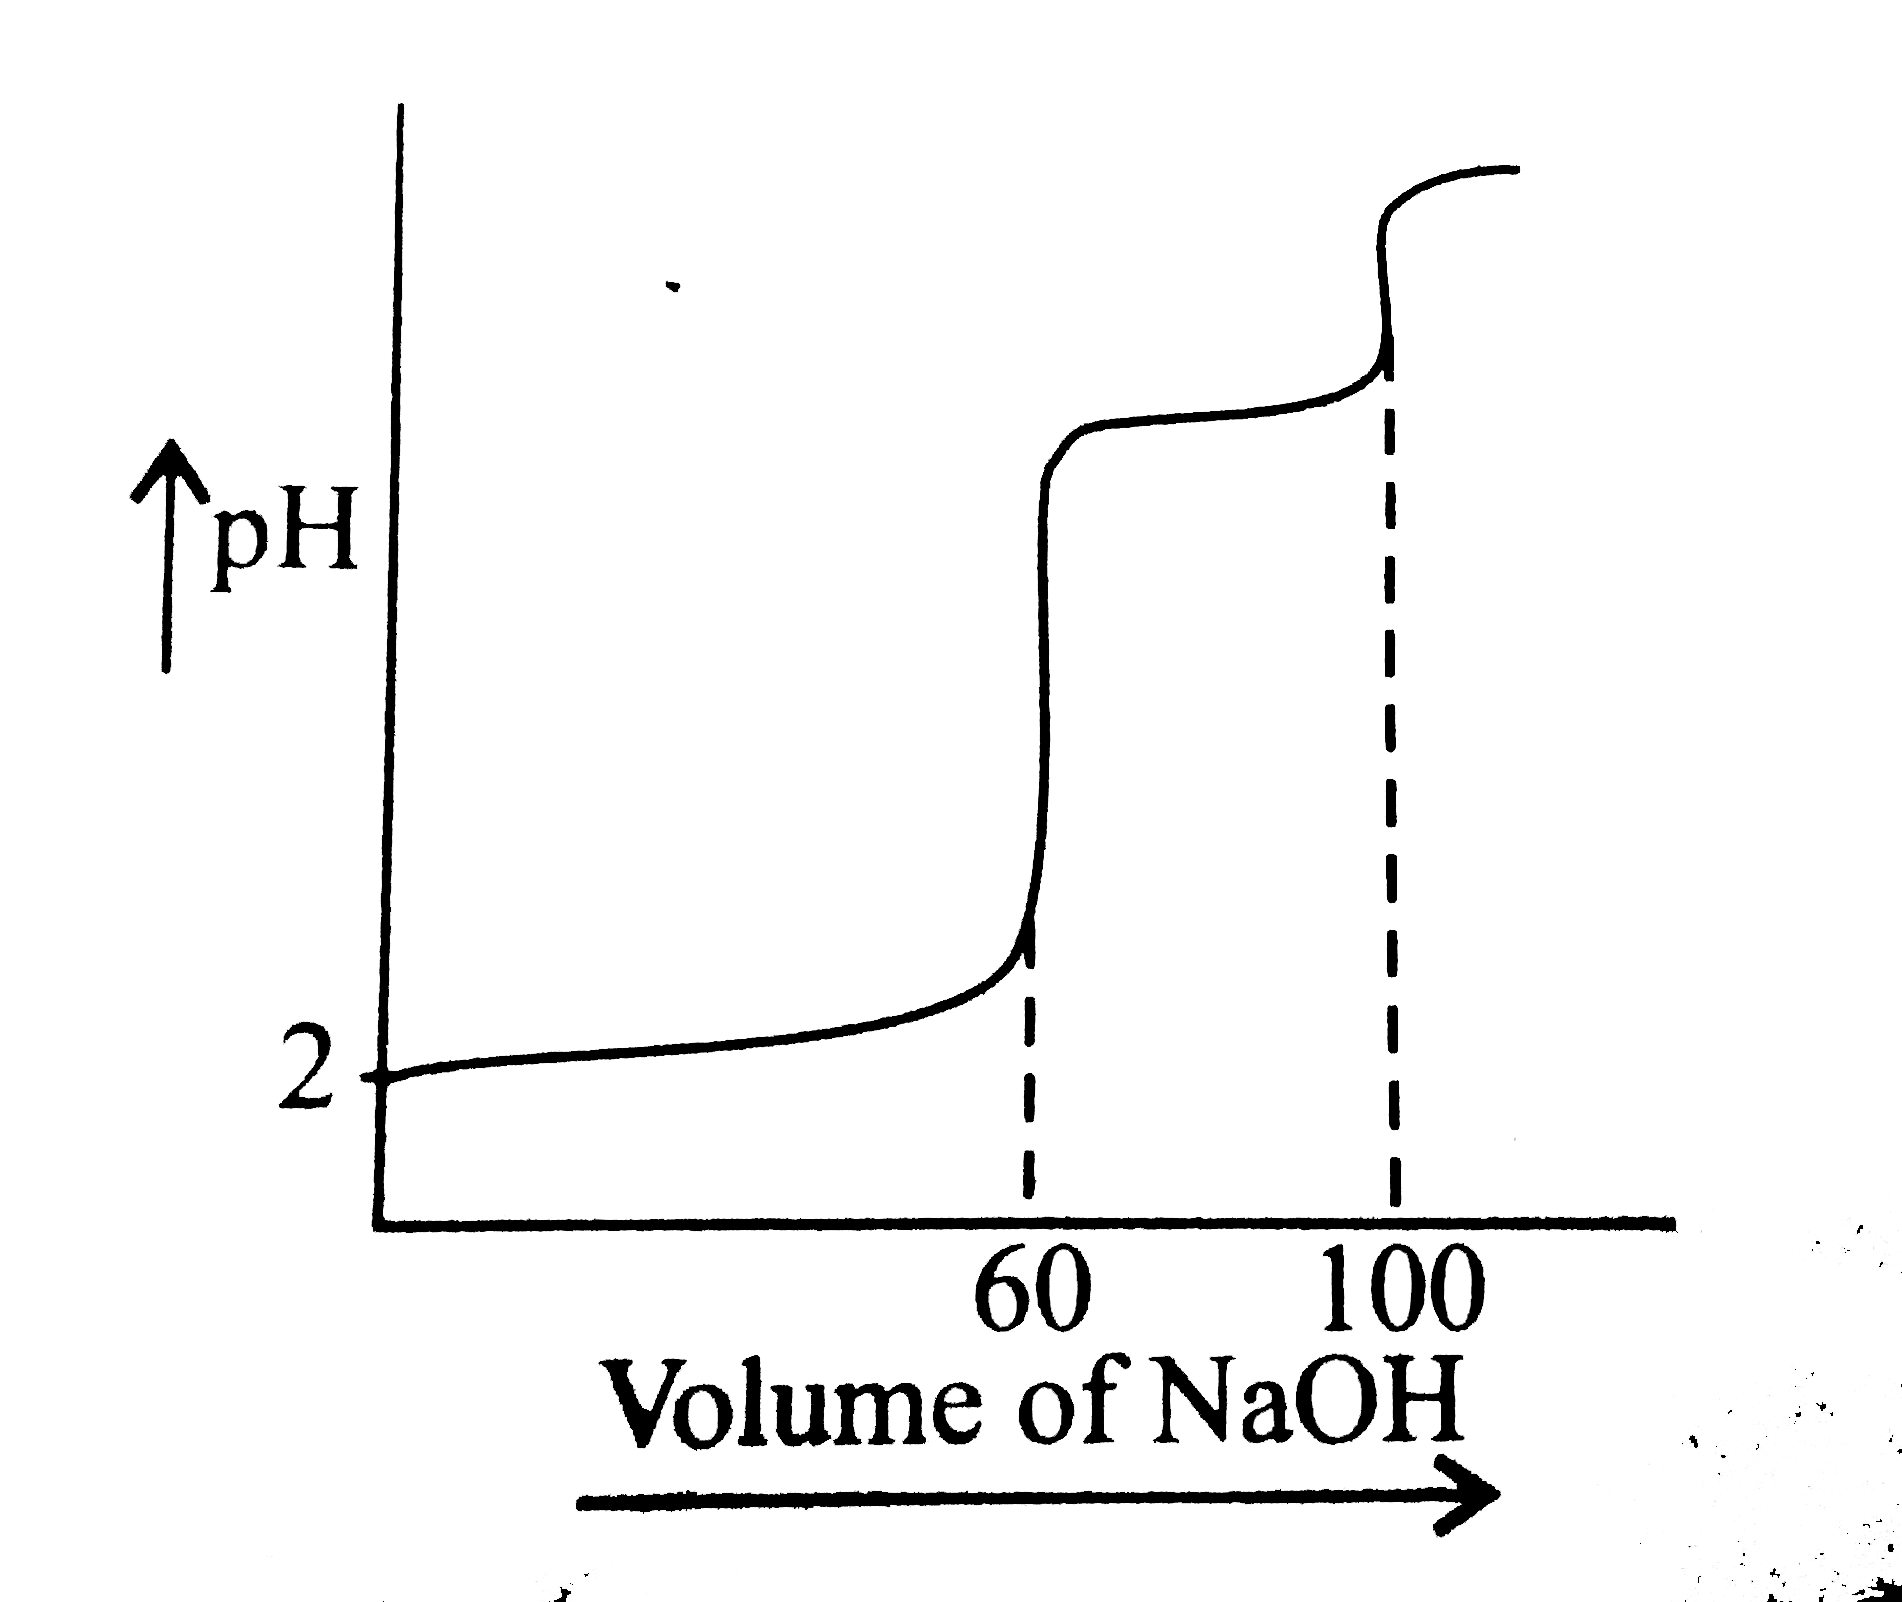
The following graph represents the titration of pH vs volume
View SolutionWhich one of the following graphs represent a function? (FIGURE)
View SolutionWhich of the following curve will represent the variation of conductance C during titration of CH3COOH by gradual addition of NaOH solution (V)
View SolutionThe following graph represents the titration of pH vs volume

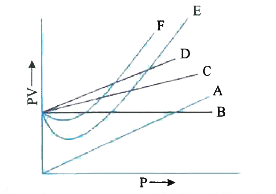
View SolutionWhich curve in the following graph represents the curve of ideal gas ?
View Solution


