Figure shows the stress-strain graphs for materials .A and B. From the graph it follows that
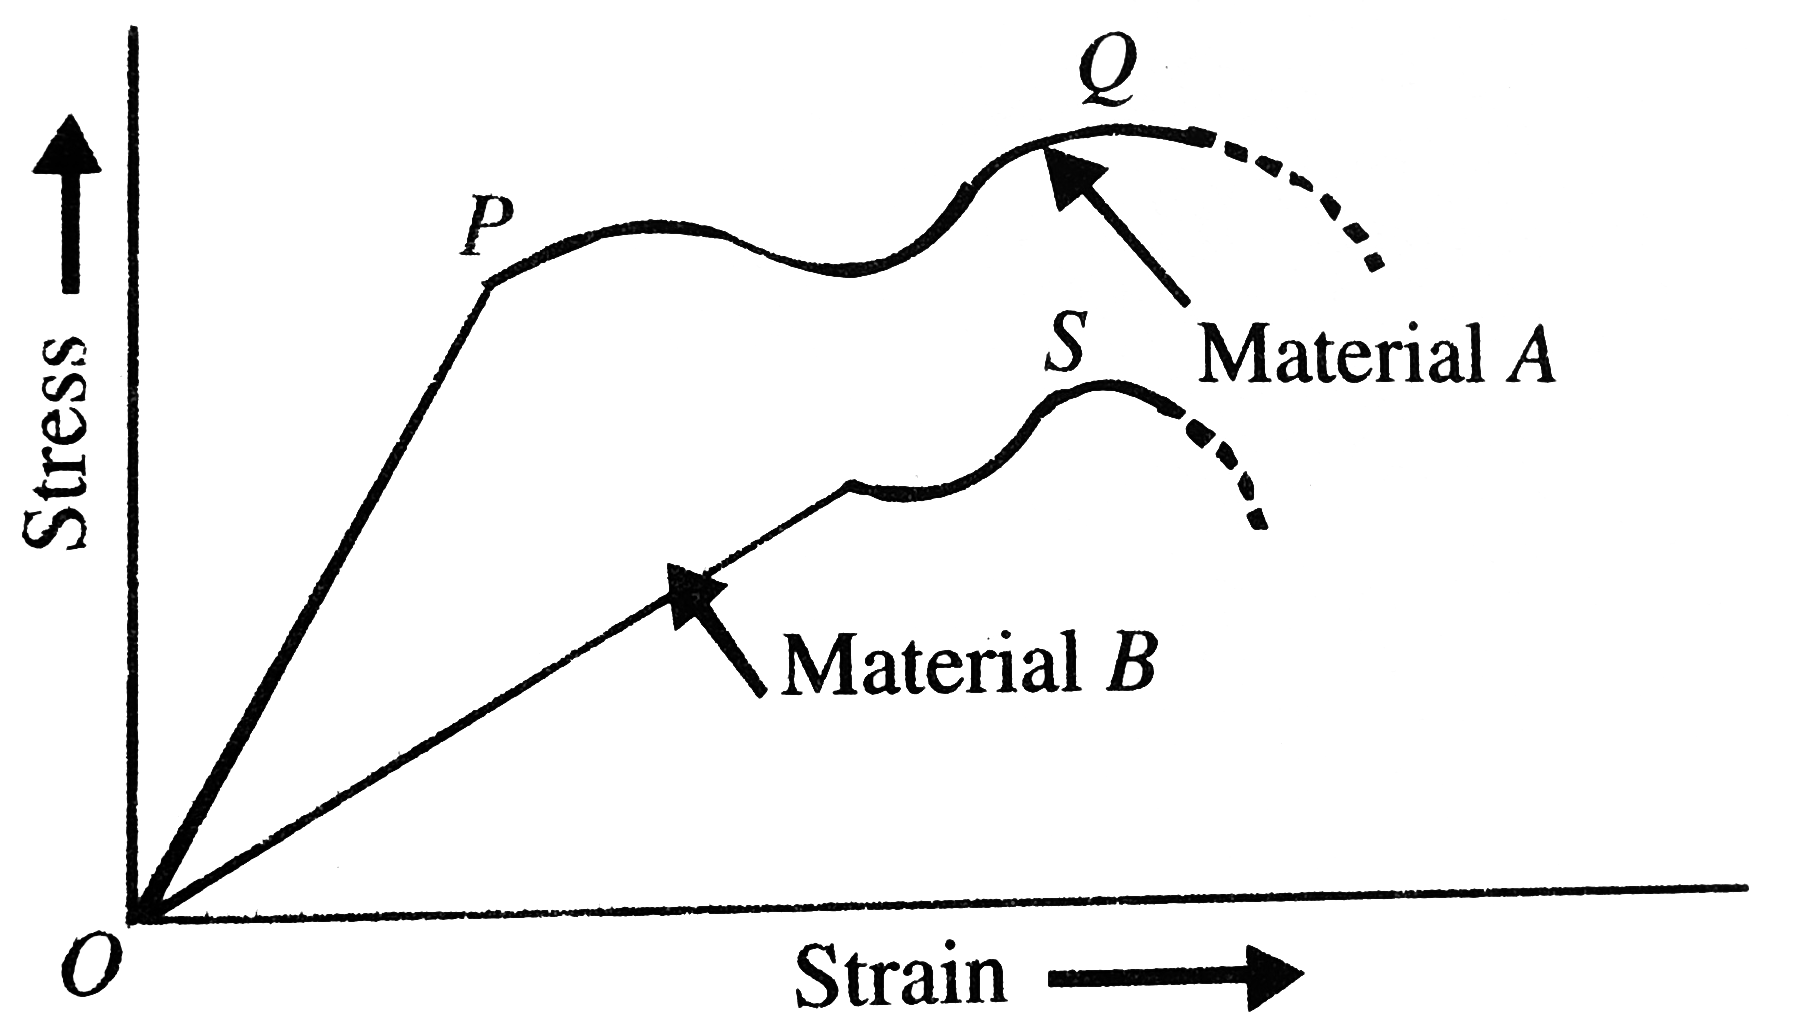
material A has a higher Young’s modulus
material B is more ductile
material A can withstand greater stress
material B can withstand greater stress
The correct Answer is:AC
The slope of the linear portion of the curve gives the Young’s modulus of the material. The slope of the linear portion OP for material A is greater than that of the linear portion OR for material B. Hence, statement (A) is correct. The plastic region for material A (from P to Q) is greater than that (from R to S) for material B, which indicates that material A is more ductile. Hence, statement (B) is in correct. The breaking stress for material B in (i.e., stress corresponding to point S) is less than that for material A (i.e., stress corresponding to point Q), hence material A is stronger than material B.
Similar Questions
The stress versus strain graph for two materials A and B are shown in fig. the graph are on the same scale. ltbr> (a) Which materail has greater Young's modulus?
(b) which of the two is stronger materail?
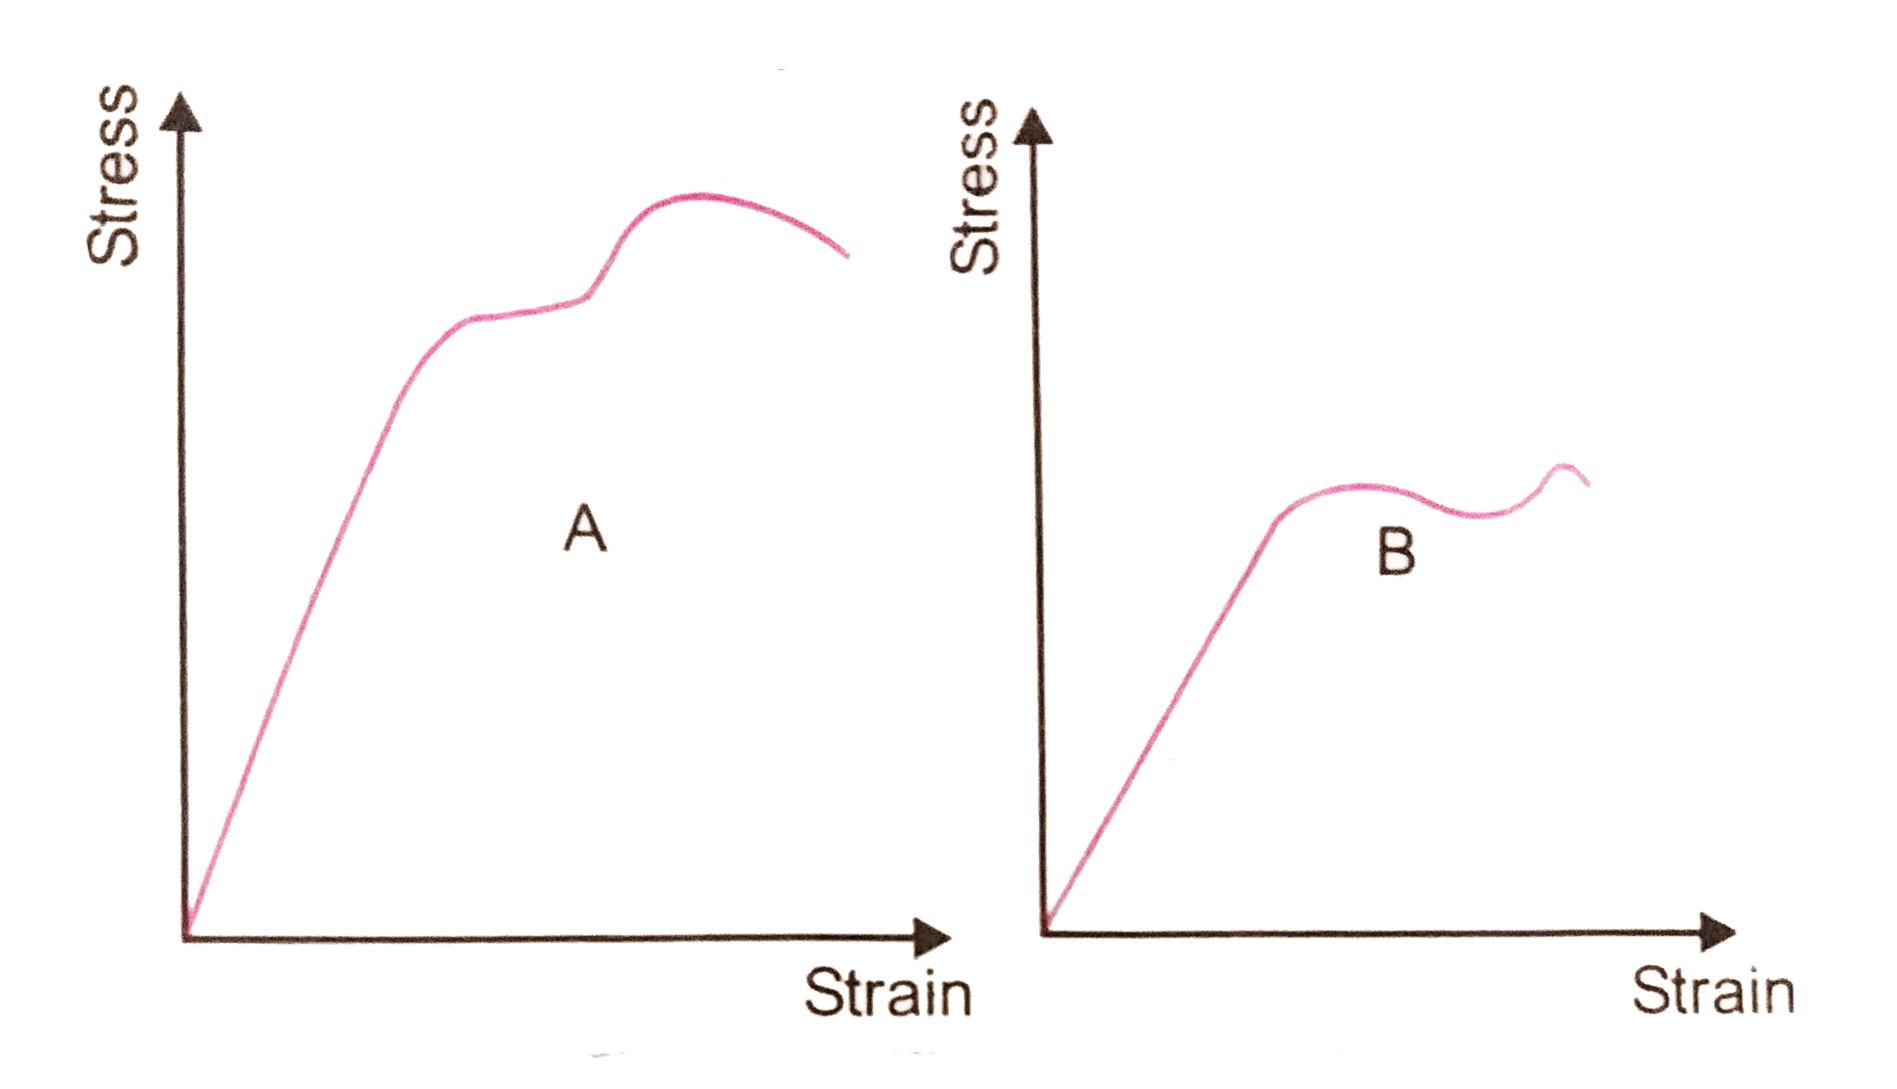
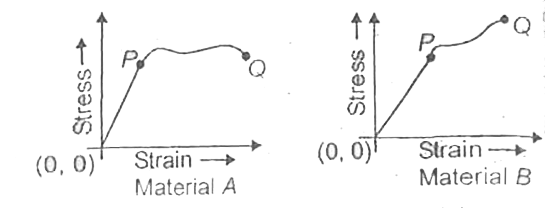
View SolutionThe stress-strain graphs for two materials A and are shown in figure. The graphs are drawn to the same scale. Select the correct statement
View Solution
Knowledge Check
Figure shows the stress-strain curve of two metals P and Q. From the graph, it can be concluded that
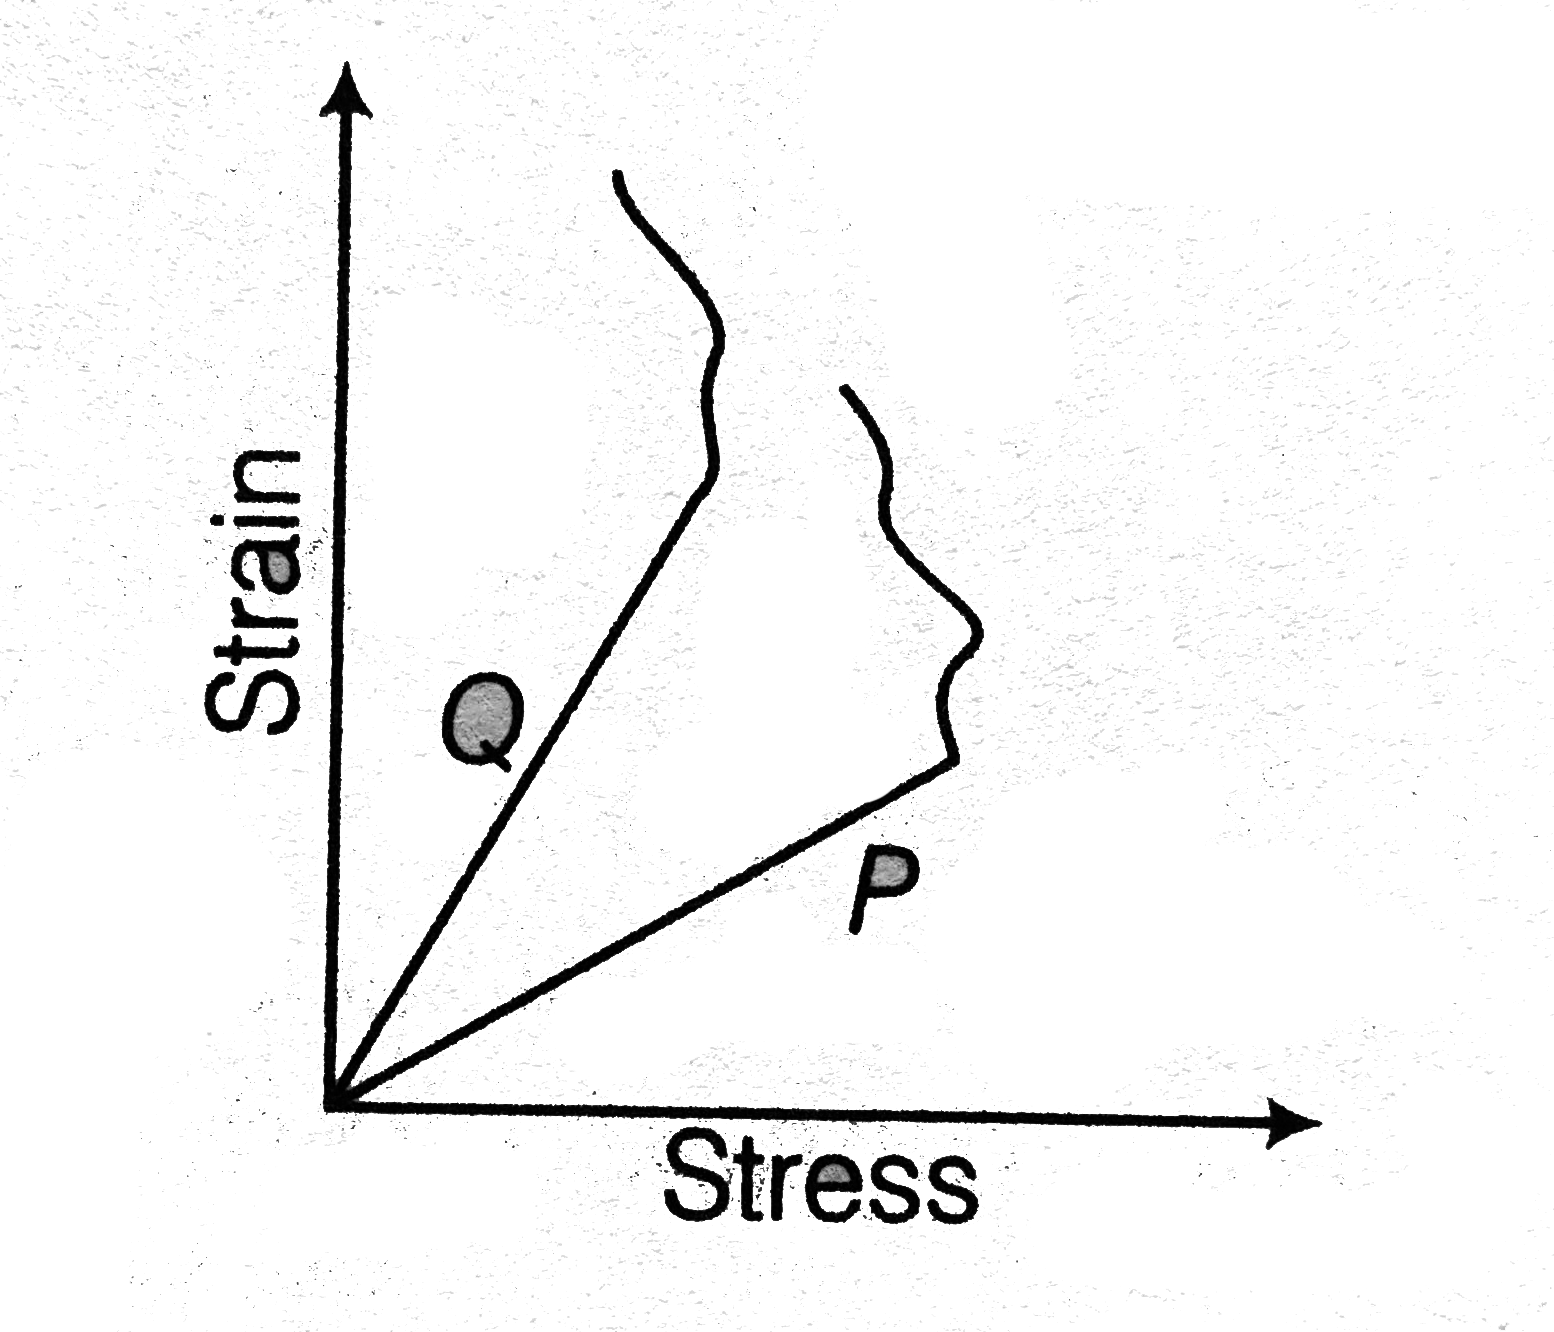 A(A) P has greater young's modulus and lesser ductilityB(B) Q has greater young's modulus and lesser ductilityC(C) P has greater young's modulus and greater ductilityD(D) Q has greater young's modulus and greater ductility
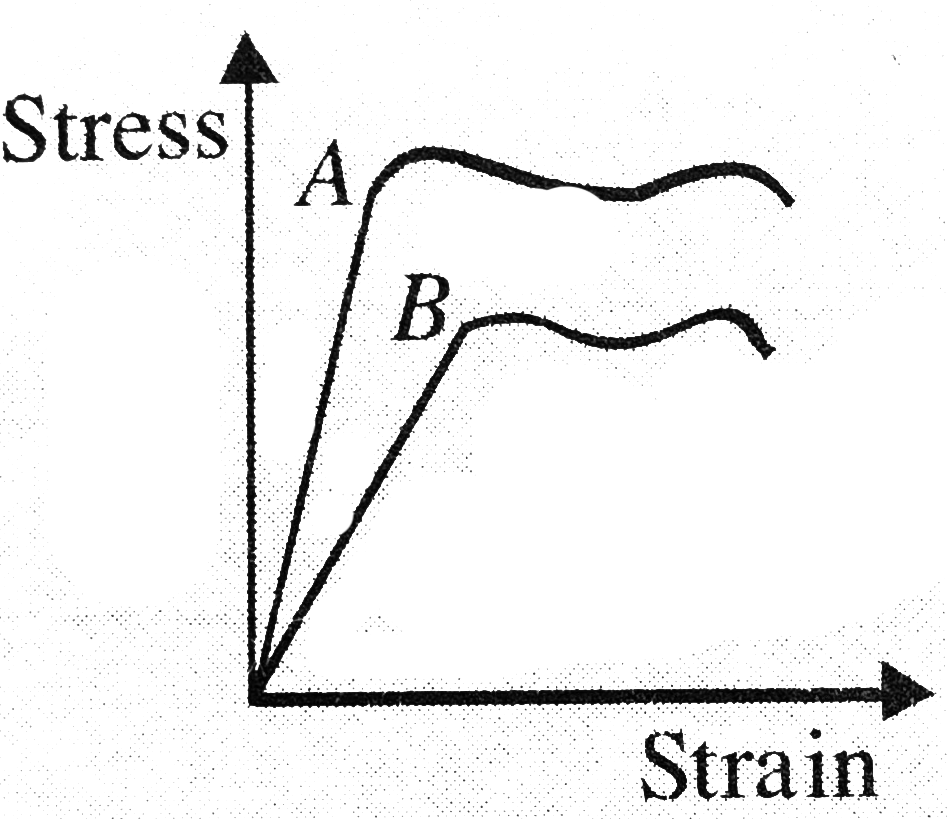
The diagram shows stress v/s strain curve for the materials A and B. From the curves we infer that
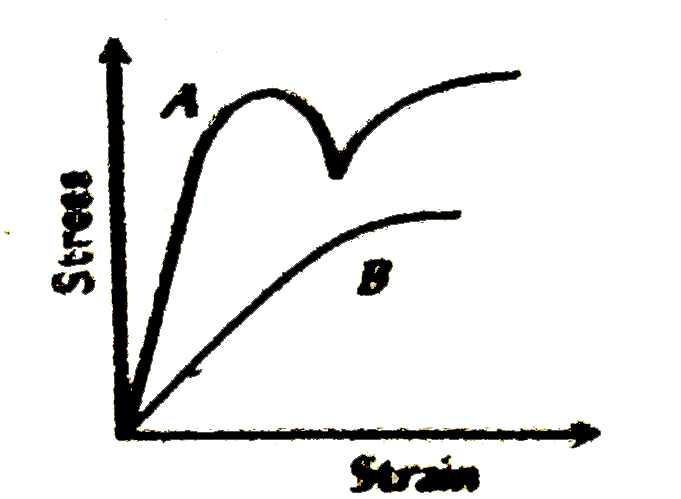 AA is brittle but B is ductileBA is ductile and B is brittleCBoth A and B are ductileDBoth A and B are brittle
The stress- strain graphs for materials A and B are as shown. Choose the correct alternative
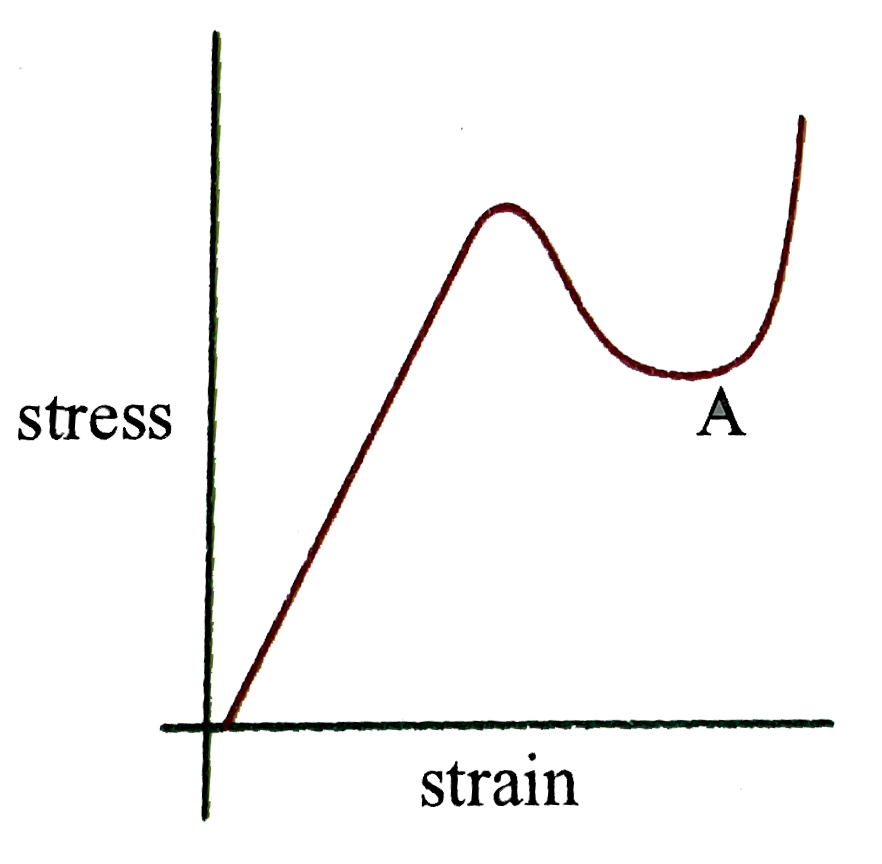
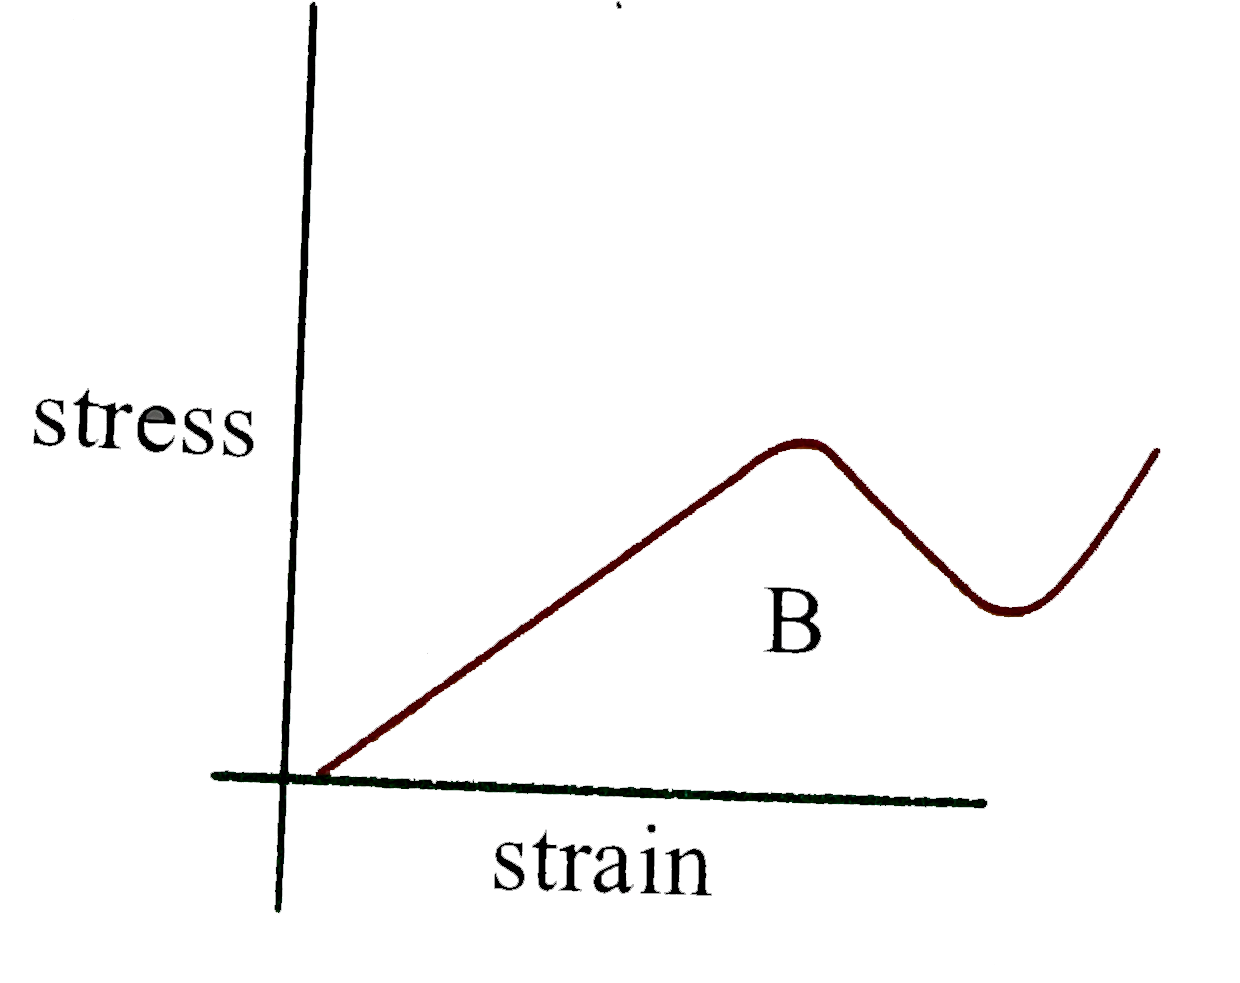 Amaterial A is stronger than material BBmaterial B is stronger than material ACYoung's modulus of A is greater than that of BDYoung's modulus of B is greater than that of A
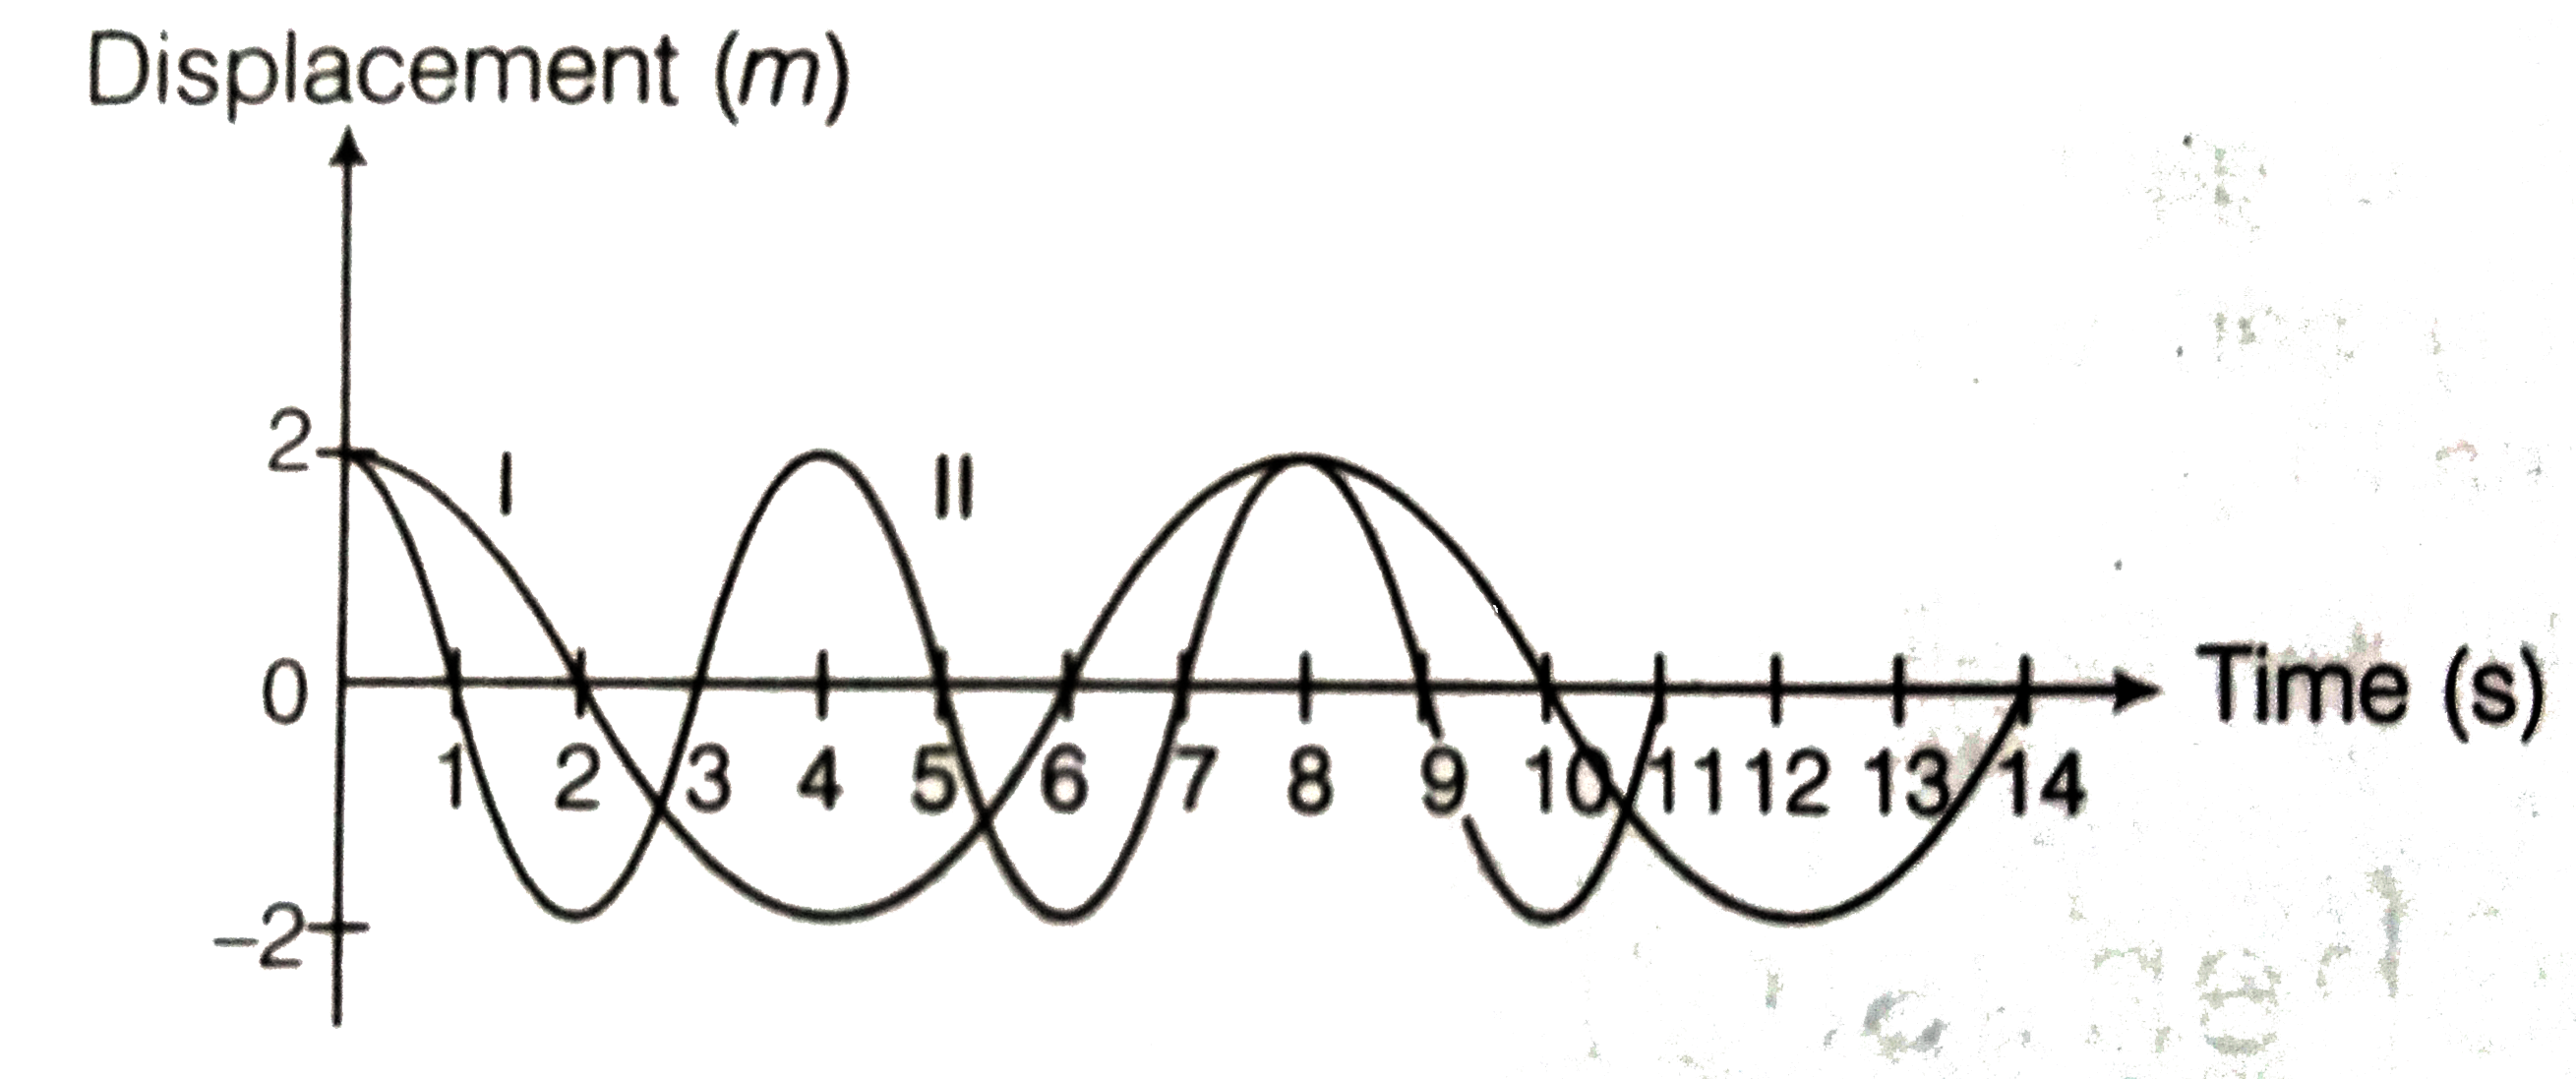
Figure shows the displacement time graphs of two simple harmonic motions I and II. From the graph it follows that
View Solution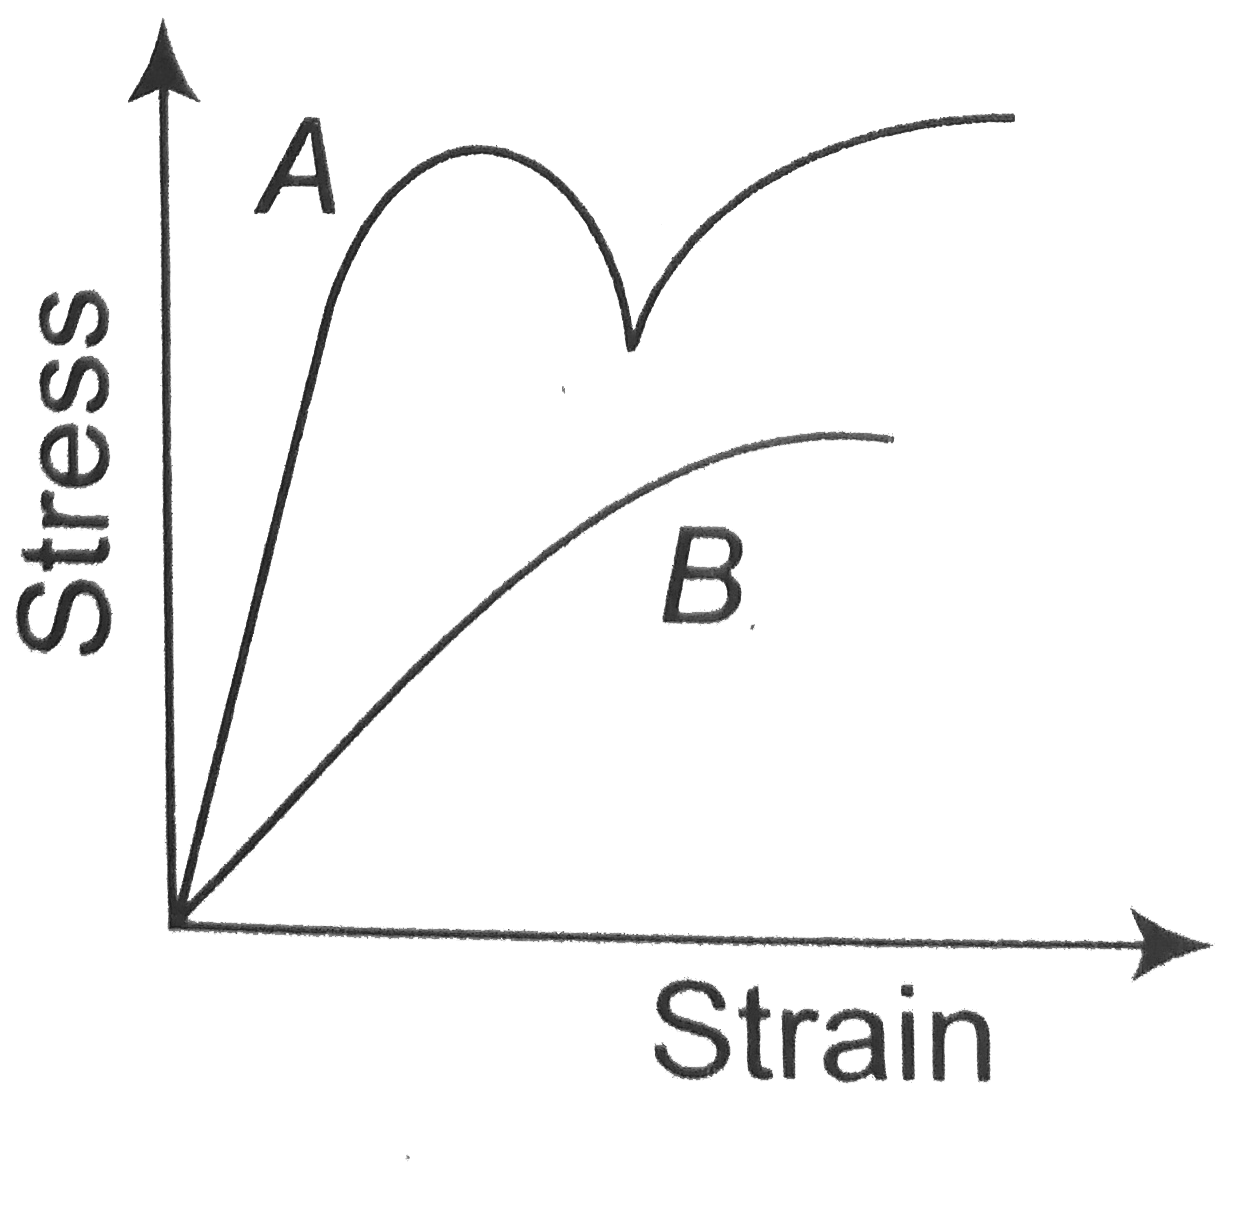
The diagram shoes stress v/s strain curve for the materials A and B. From the curves we infer that
View SolutionThe stress and strain graphs for two materials, A and B are shown here. Answer the following:
 give reasons
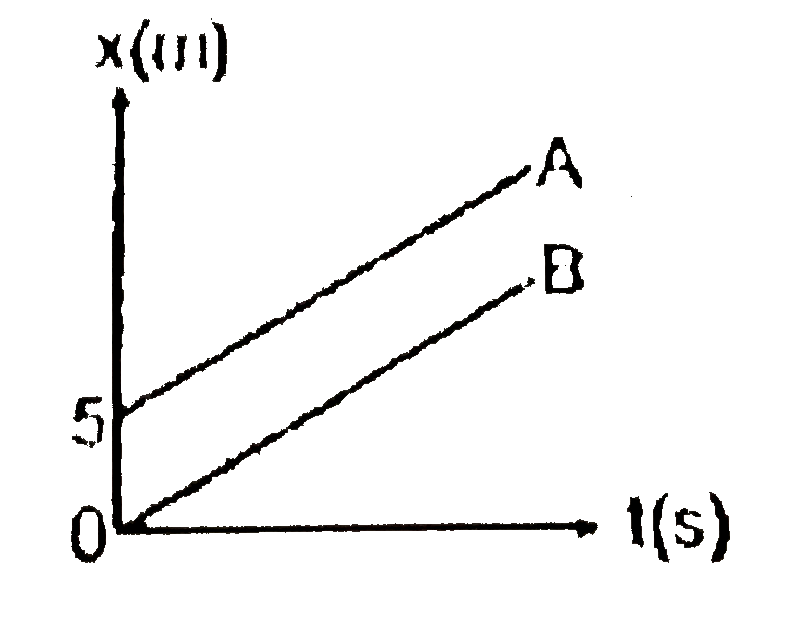
View SolutionFigure shows position-time graph of two cars A and B.
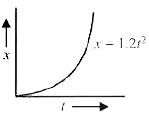
View SolutionGiven figure shows the distance-time graph of the motion of a car. It follows from the,| graph that the car is
View Solution
