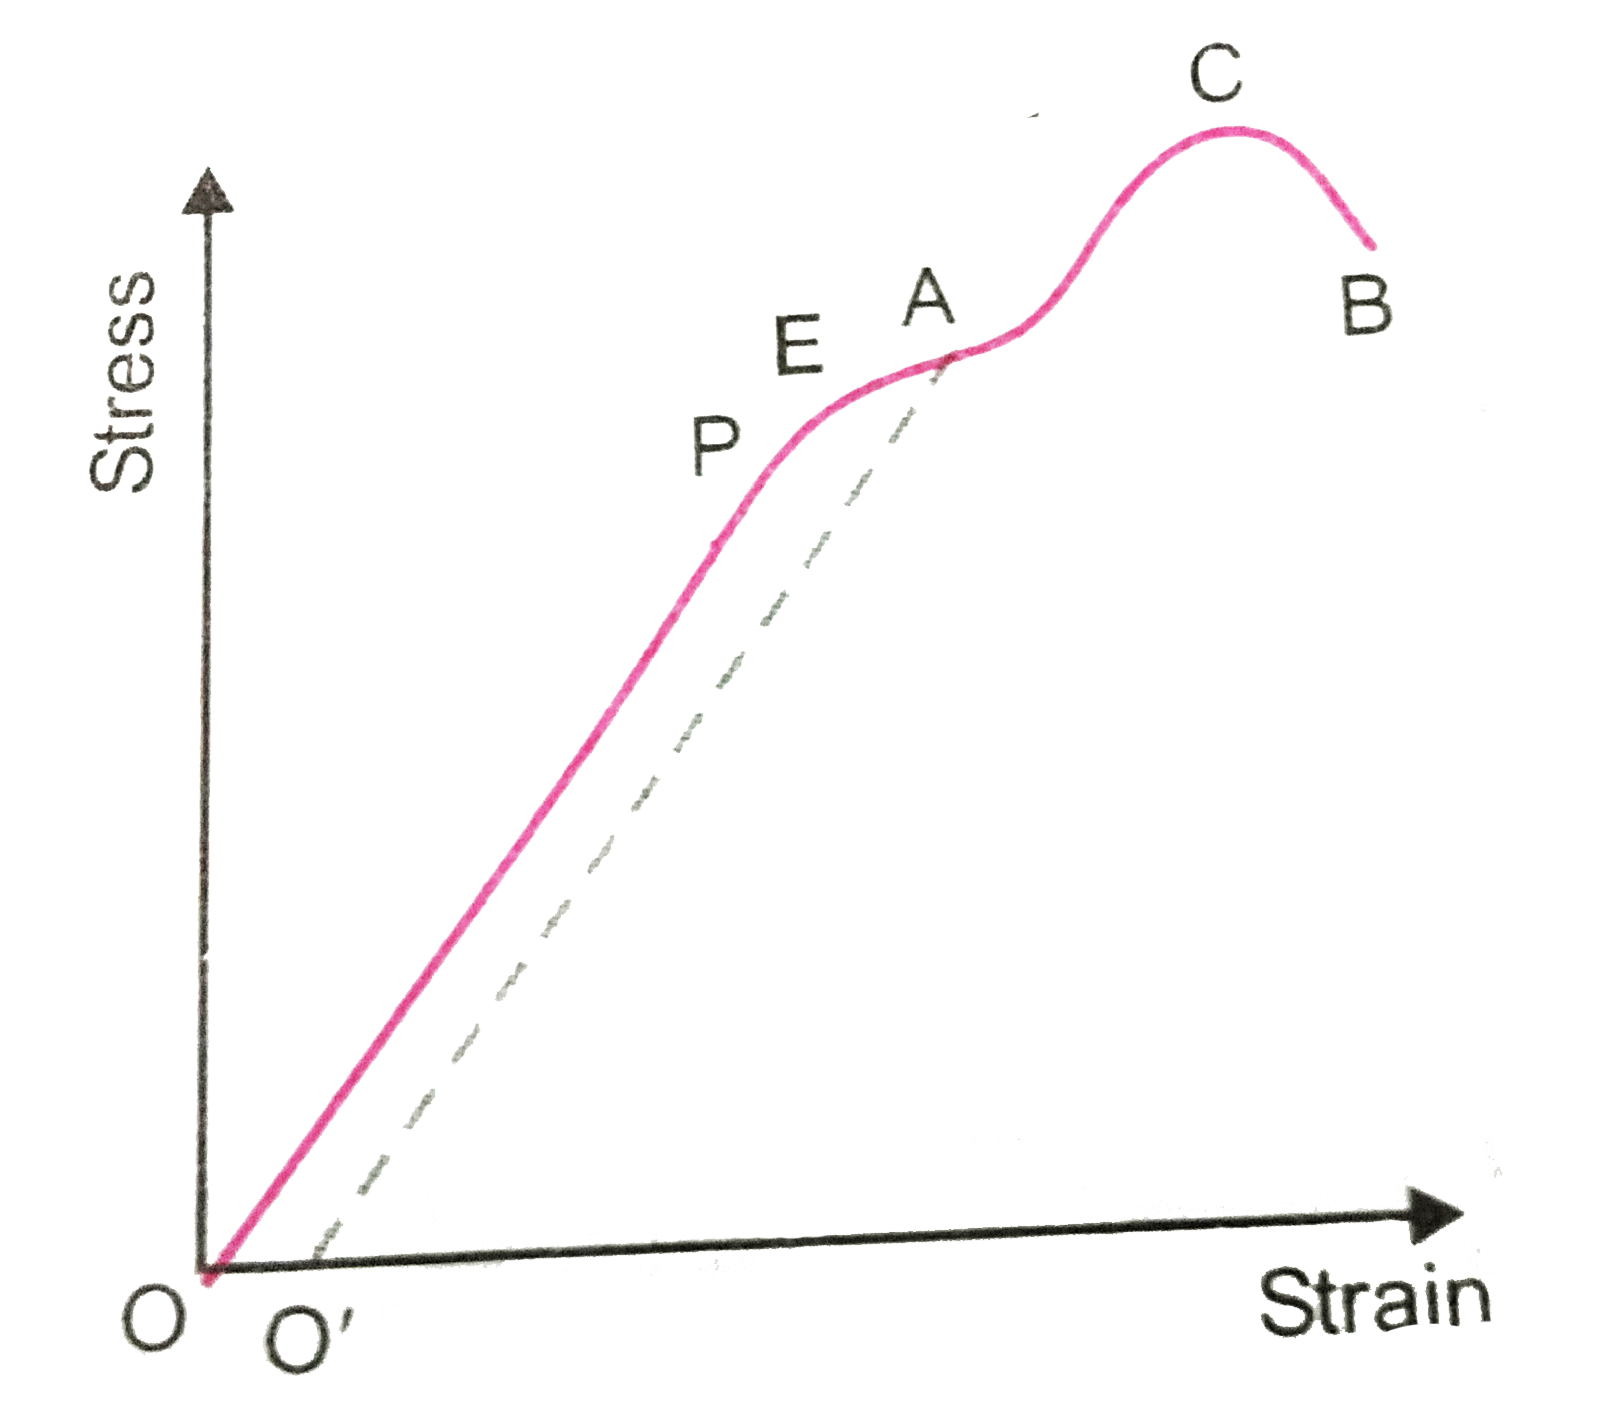
The stress strain graph for a metal wire is shown in the fig. Upto the point E, the wire returns to its original state O along the curve EPO, when it is gradually unloaded. Point B corresponds to the fracture of the wire. (a) Upto what point on the curve is Hooke's law obeyed? (this point some times called proportional limits).
(b) Which point on the curve corresponding to elastic limit or yield point of the wire?
(c ) Indicate the elastic and plastic regions of the stres-strain graph.
(d) Describe what happens when the wire is loaded upto a stress corresponding to the point A on the graph and then unloaded gradulally. In particular explain the dotted curve.
(e) What is peculiar about the portion of the stress- strain graph from C to B? Upto what stress can the wire be subjected without causing fracture?
(i) Hooke’s law is obeyed upto the point P, because upto this point, stress ∝ strain .
(ii) Point E corresponds to elastic limit (yield point) because the wire returns to original state O along EPO is it is gradually unloaded.
(iii) The elastic region is from O to E and the plastic region is from E to B.
(iv) Upto point P, stress is proportional to strain. Between P and E strain increases more rapidly than stress and Hooke’s law is not obeyed. When the wire is unloaded at any point A beyond E, the wire does not retrace the curve AEPO but follows the dashed curve AO’. When the stress becomes zero, a residual strain OO’ is left in the wire.
(v) Between C and B, the wire virtually flows out, i.e., the strain increases even the wire is being unloaded.
Similar Questions
The stress strain graph for a metal wire is shown in the fig. Upto the point E, the wire returns to its original state O along the curve EPO, when it is gradually unloaded. Point B corresponds to the fracture of the wire. (a) Upto what point on the curve is Hooke's law obeyed? (this point some times called proportional limits).

(b) Which point on the curve corresponding to elastic limet or yield point of the wire?
(c ) Indicate teh elastice and plastic regions of the stree-strain graph.
(d) Describe what happens when the wire is loaded upto a stress corresponding to the point A on the graph and then unloaded gradulally. In particular explain the dotted curve.
(e) Wht is peculiar about the protion of the stree- strain graph from C to B? Upto what stress can the wire be subjected with out causing fracture?
View SolutionDefine the terms stress and strain and also state their SI units. Draw the stress versus strain graph for a metallic wire, when stretched upto the breaking point.
View Solution
Knowledge Check
The veloctiy - time graph of a body is shown in the fig. It implies that at point B.
 AThe force is zeroBThere is a force towards motionCThere is a force which opposes motionDThere is only gravitational force
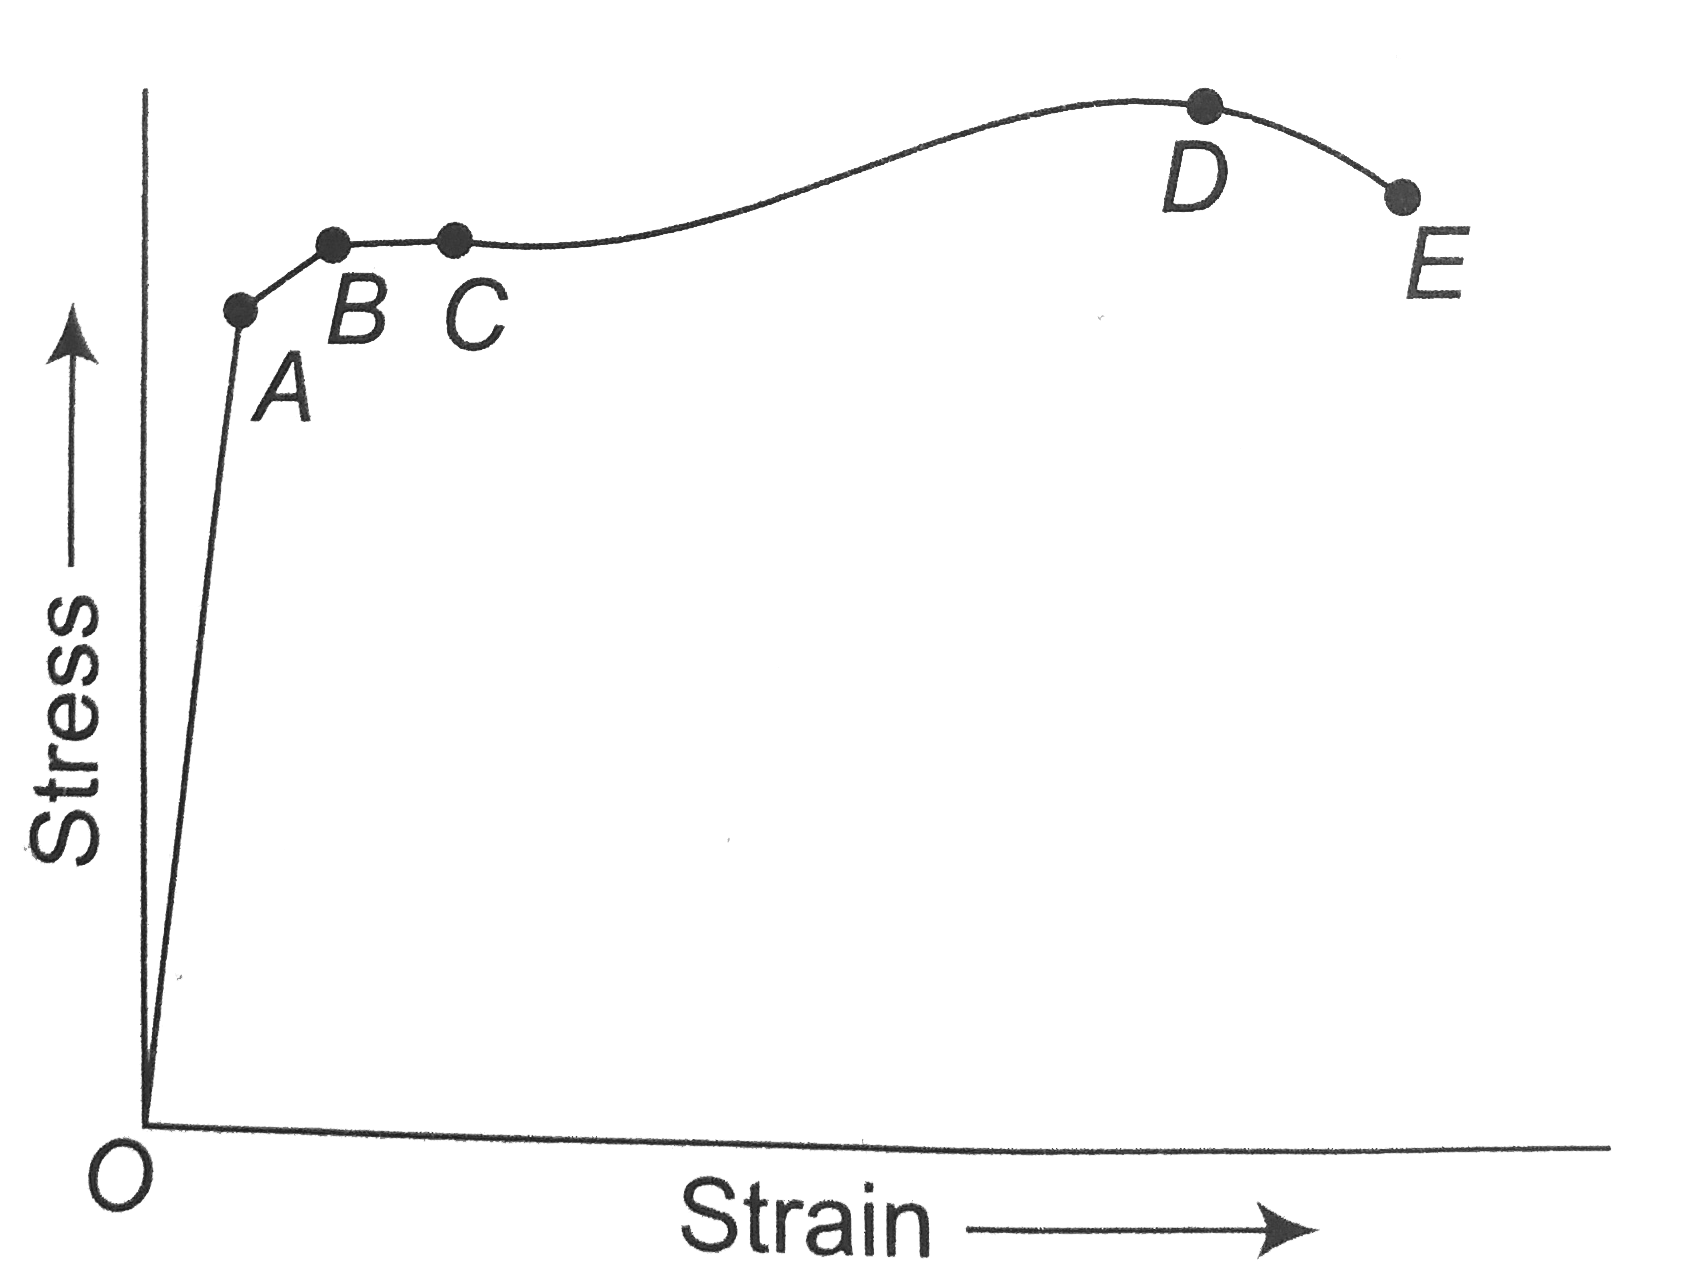
The stress strain graph for a metal wire is as shown in the figure. In the graph, the region in which Hooke's law is obeyed, the ultimate strength and fracture are represented byAOA,C,DBOB,D,ECOA,D,EDOB,C,DThe point on stress-strain graph at which the plastic flow starts is known as
Aelastic limitBneck formationCyield pointDbreaking point
Melting point of a fuse wire is
View SolutionThe point on the stress-strain curve at which the strain begins to increase even without any increase in the stress is
View Solution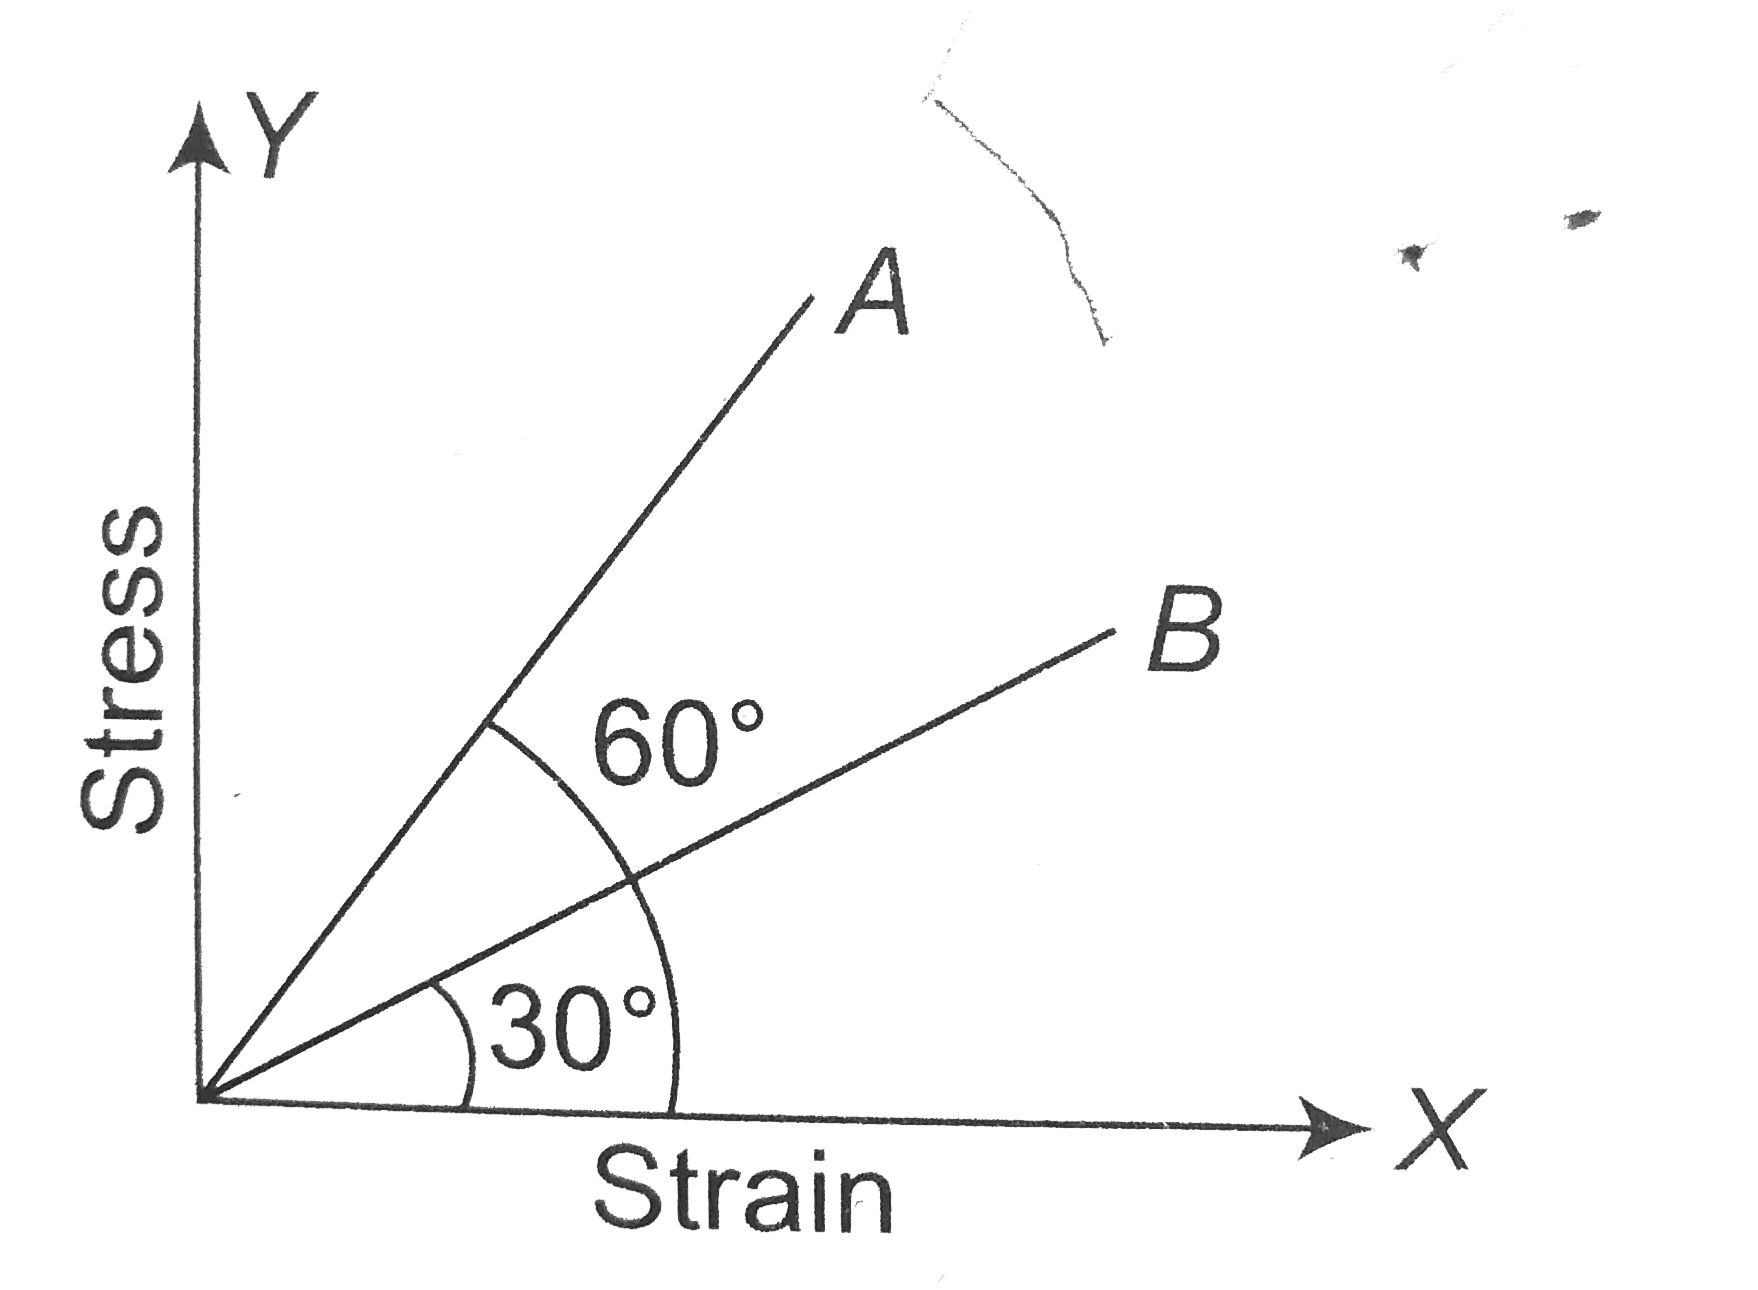
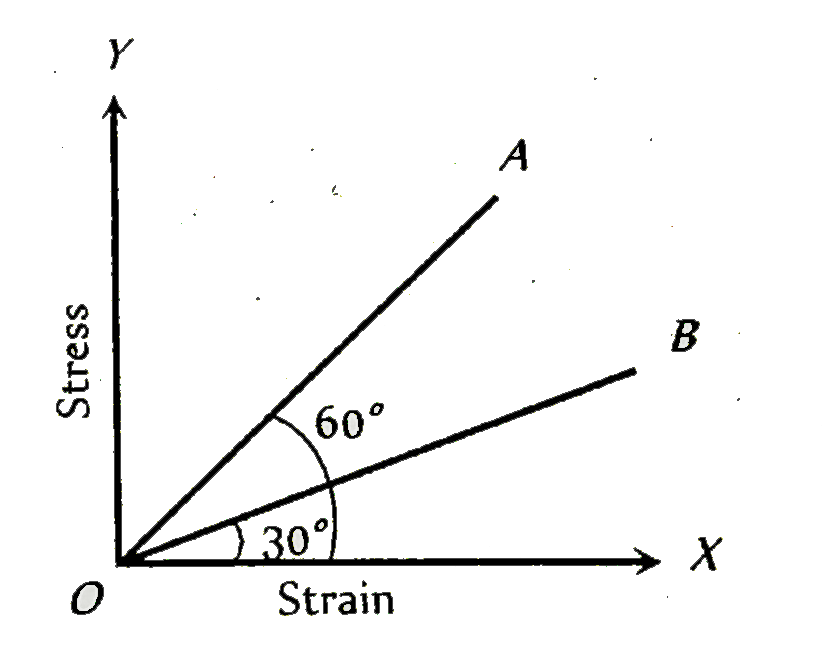
The stress versus strain graphs for wires of two materials A and B are as shown in the figure. If YA and YB are the Young's moduli of the materials then
View Solution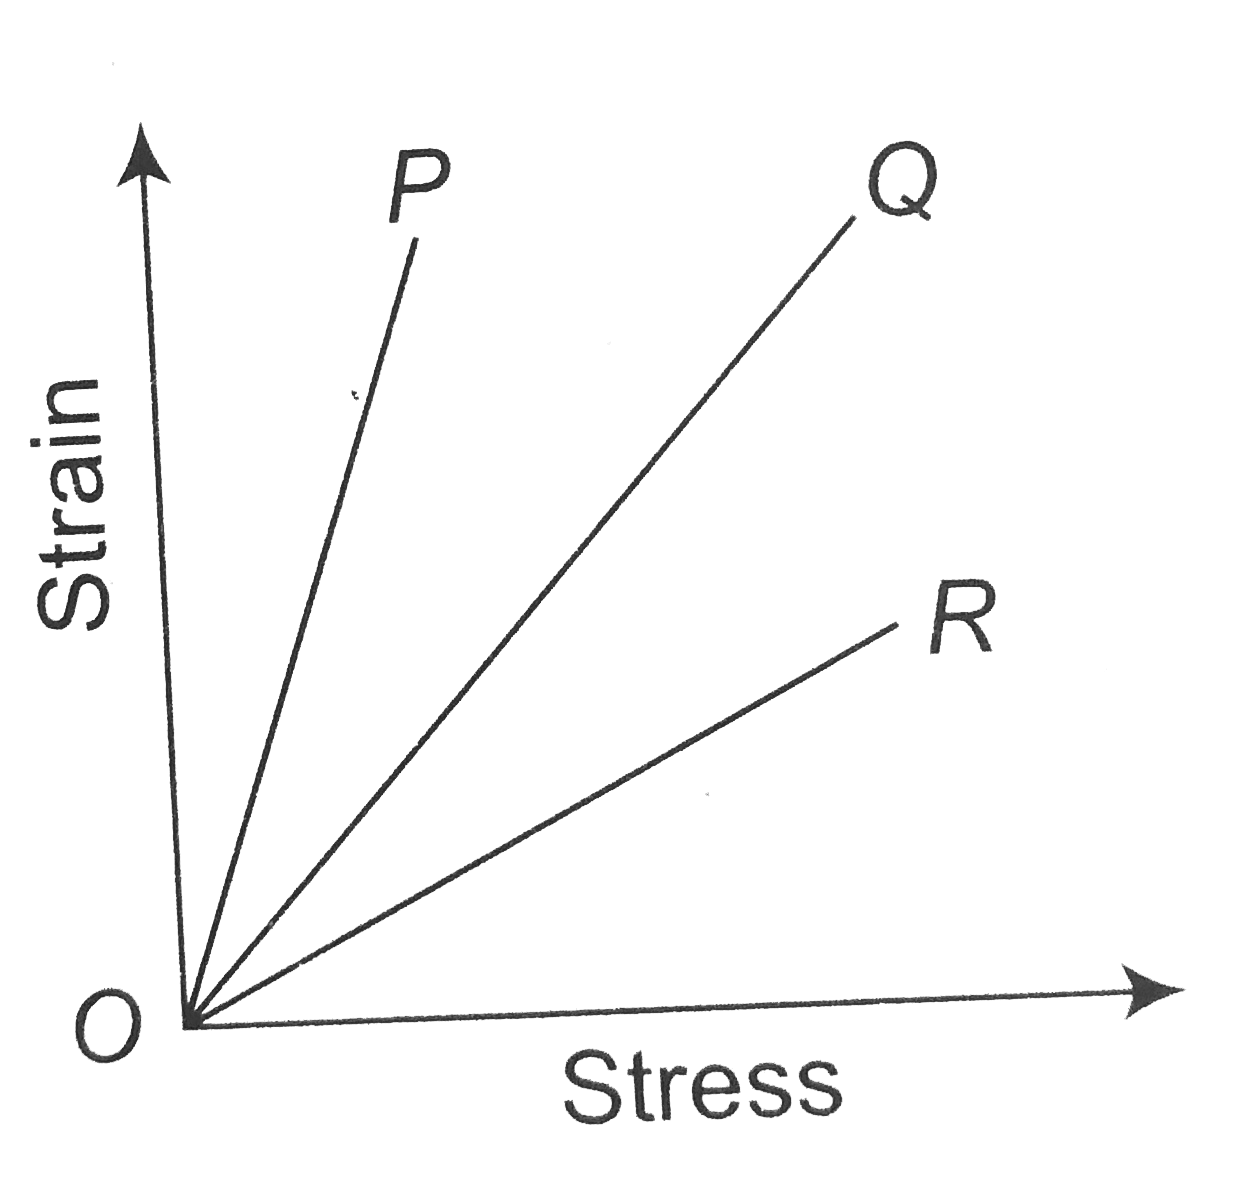
The strain stress curves of three wires of different materials are shown in the figure. P, Q and R are the elastic limits of the wires. The figure shown that
View SolutionThe stress versus strain graphs for wires of two materials A and B are as shown in the figure. If YAandYB are the younng's moduli of the materials, then
View Solution
