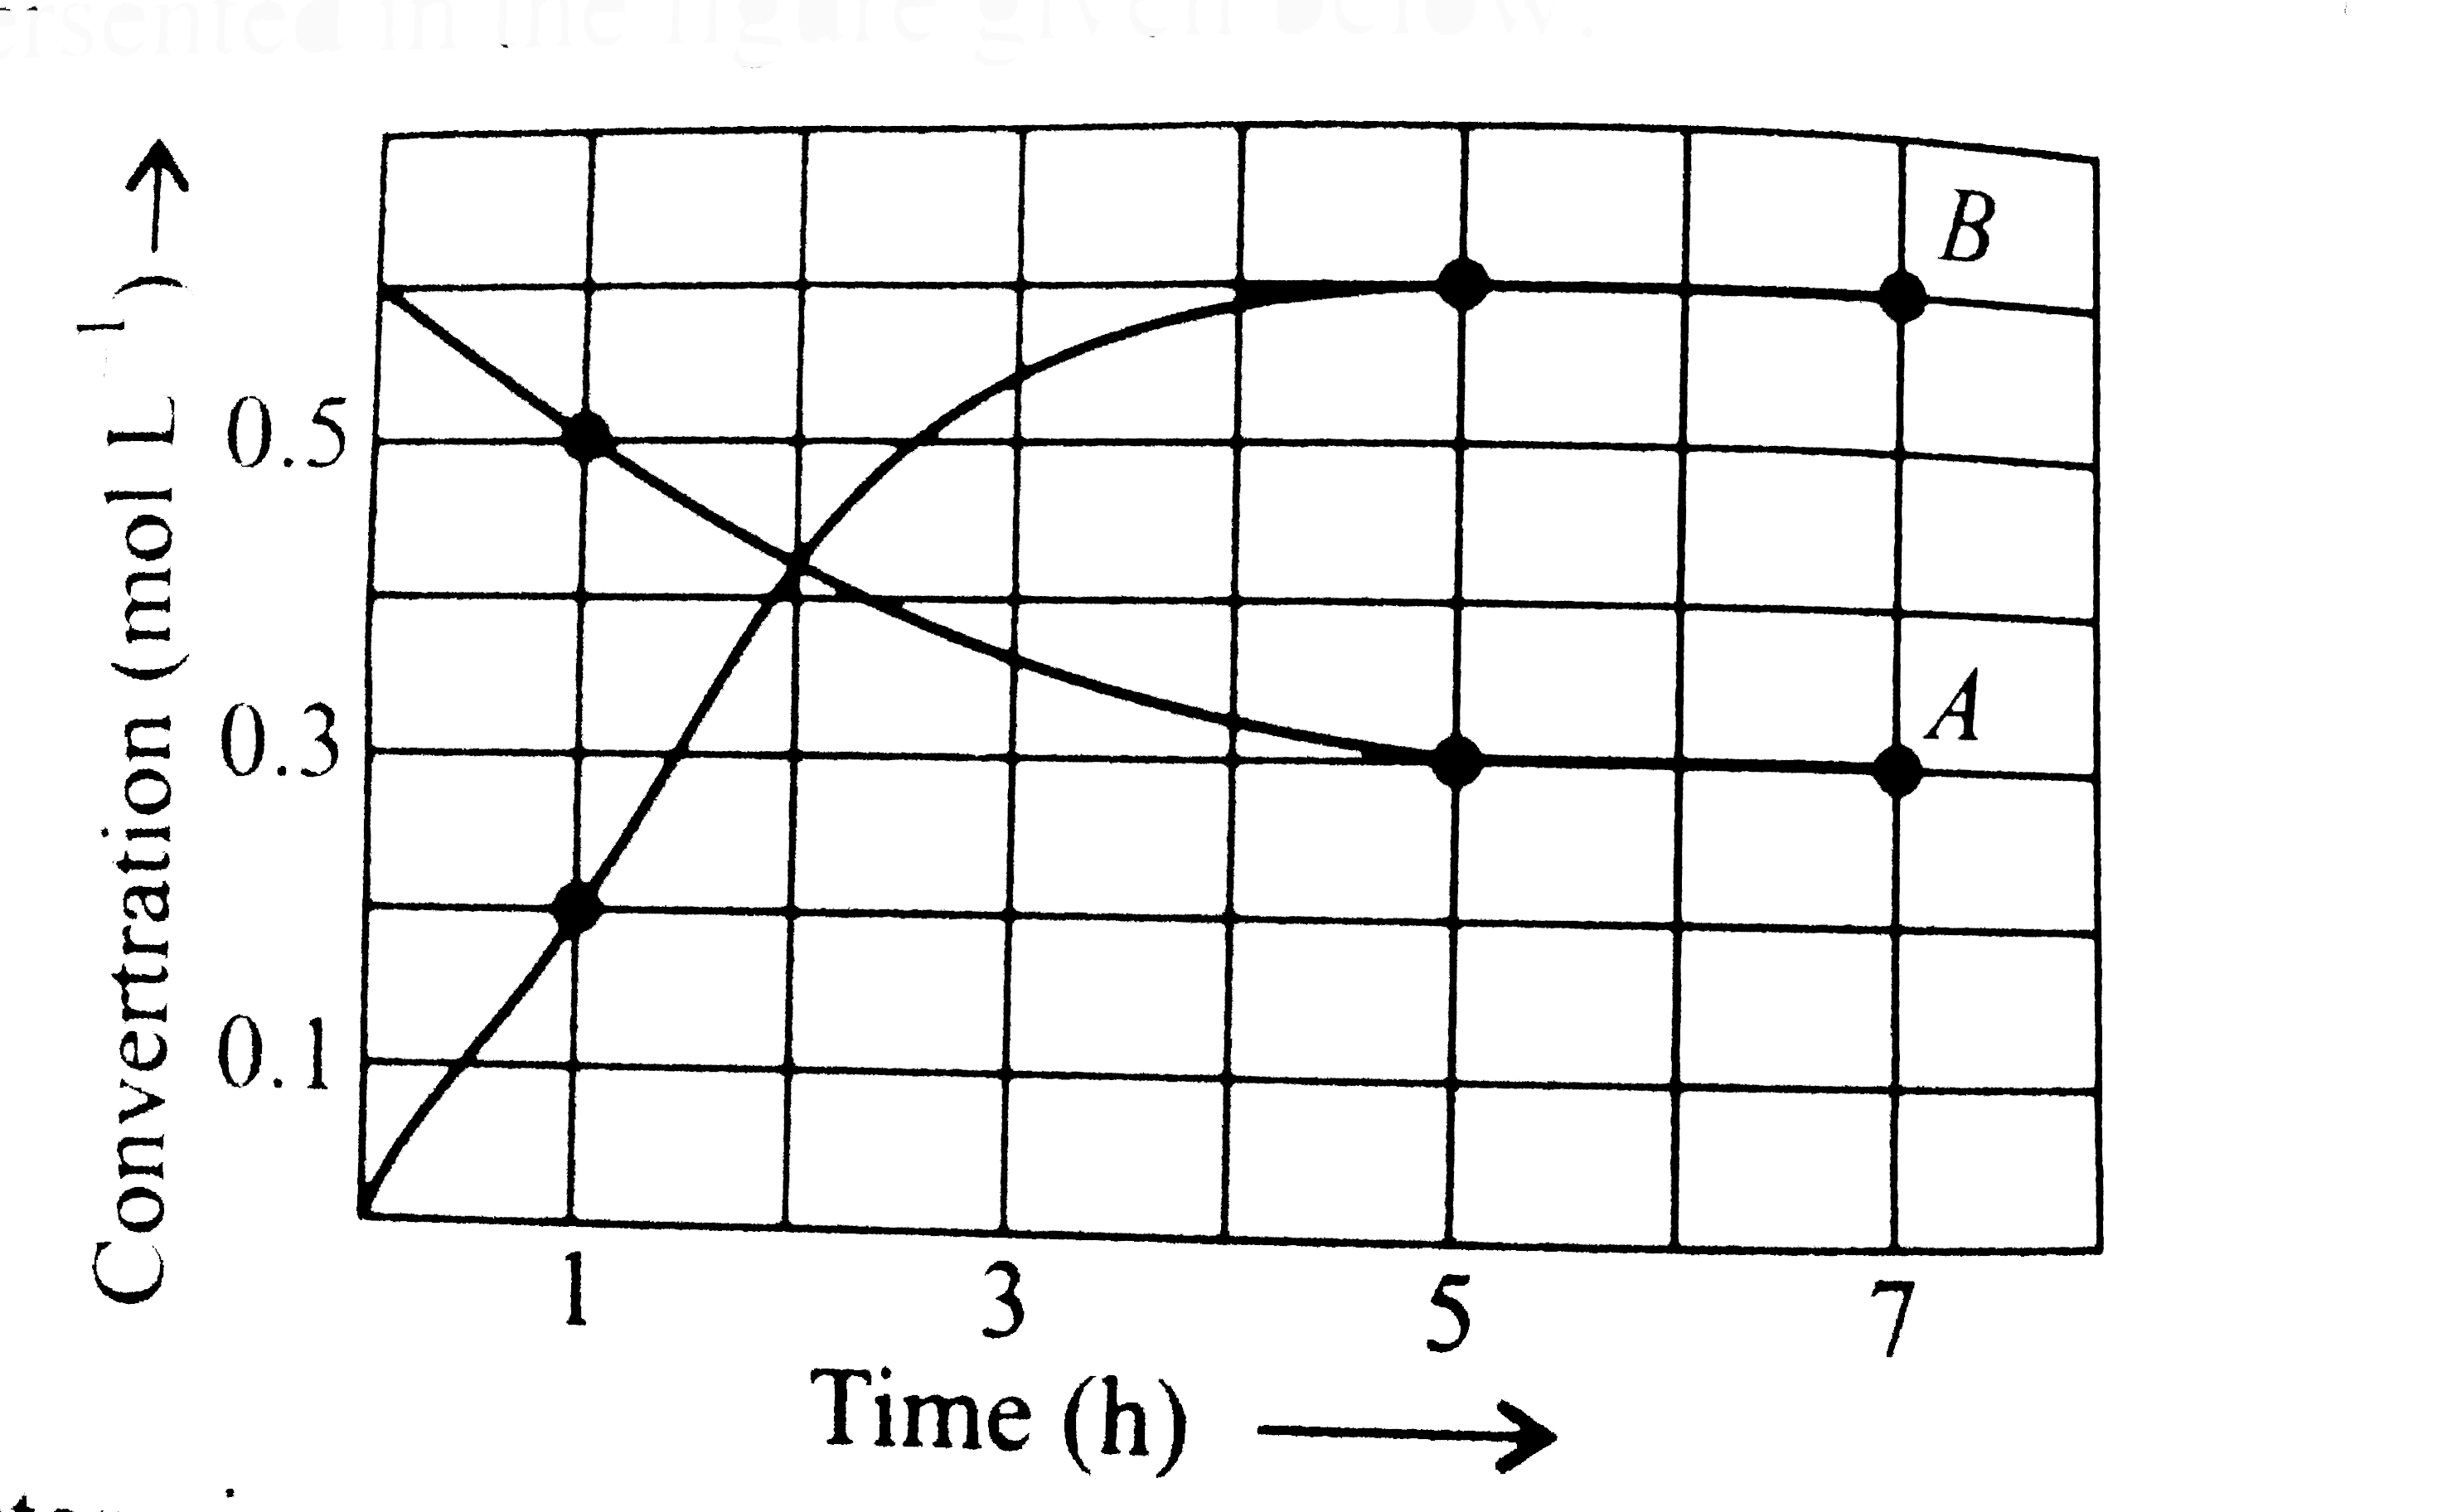
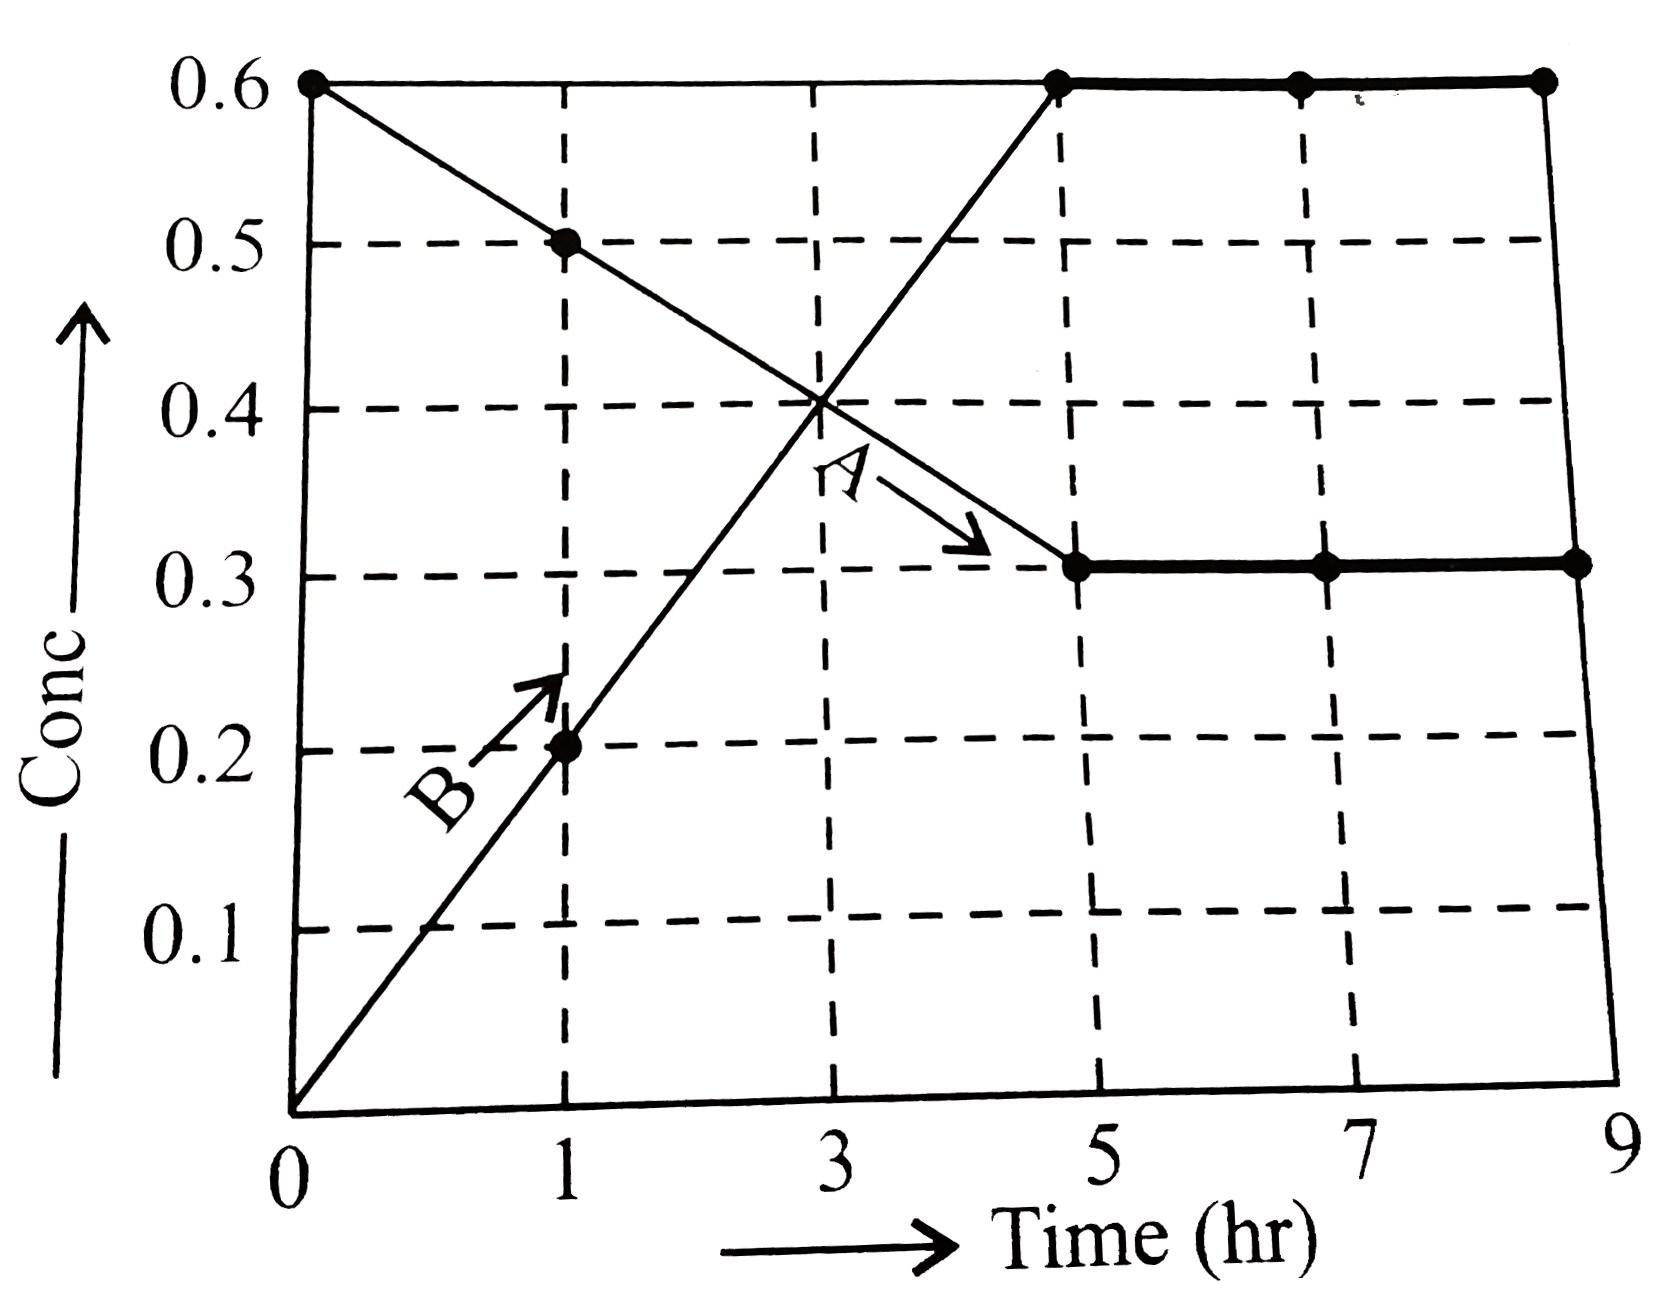
The progress of the reaction A⇔nB with time is presented in the figure given below:
Determine
a. The value of n.
b. The equilibrium constant K.
c. The initial rate of concentration of A.
2
1.2
0.5
6.67
The correct Answer is:B
At equilibrium, there is no further change in conc. Hence, concentration at equilibrium are [A]=0.3mol L−1,[B]=0.6mol L−1
∴ Equilibrium constant, K=[B]2[A]=(0.6)20.3
=1.2mol L−1.
Topper's Solved these Questions
- RATES OF REACTIONS AND CHEMICAL KINETICSBOOK - DINESH PUBLICATIONCHAPTER - RATES OF REACTIONS AND CHEMICAL KINETICSEXERCISE - Matrix Match
2 Videos
- RATES OF REACTIONS AND CHEMICAL KINETICSBOOK - DINESH PUBLICATIONCHAPTER - RATES OF REACTIONS AND CHEMICAL KINETICSEXERCISE - Integer
4 Videos
- RATES OF REACTIONS AND CHEMICAL KINETICSBOOK - DINESH PUBLICATIONCHAPTER - RATES OF REACTIONS AND CHEMICAL KINETICSEXERCISE - Selected Straight
49 Videos
- PHYSICAL AND CHEMICAL EQUILIBRIABOOK - DINESH PUBLICATIONCHAPTER - PHYSICAL AND CHEMICAL EQUILIBRIAEXERCISE - ULTIMATE PREPARATORY PACKAGE
13 Videos
- REDOX REACTIONSBOOK - DINESH PUBLICATIONCHAPTER - REDOX REACTIONSEXERCISE - Reasoning Type Questions
4 Videos
Similar Questions
The progress of the reaction A⇔nB with time is persented in the figure given below:

Determine
a. The value of n.
b. The equilibrium constant K.
c. The initial rate of concentration of A.
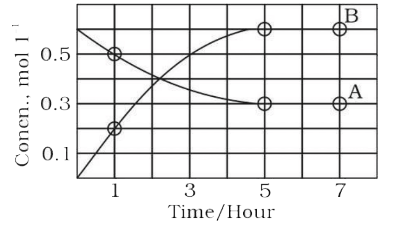
View SolutionThe progress of the reaction, A ⇌ nB with time, is presented in figure given below. Determine.
(i) The value of n,
(ii) The equilibrium constant K, and
(iii) the initial rate of conversion of A.
View Solution
Knowledge Check
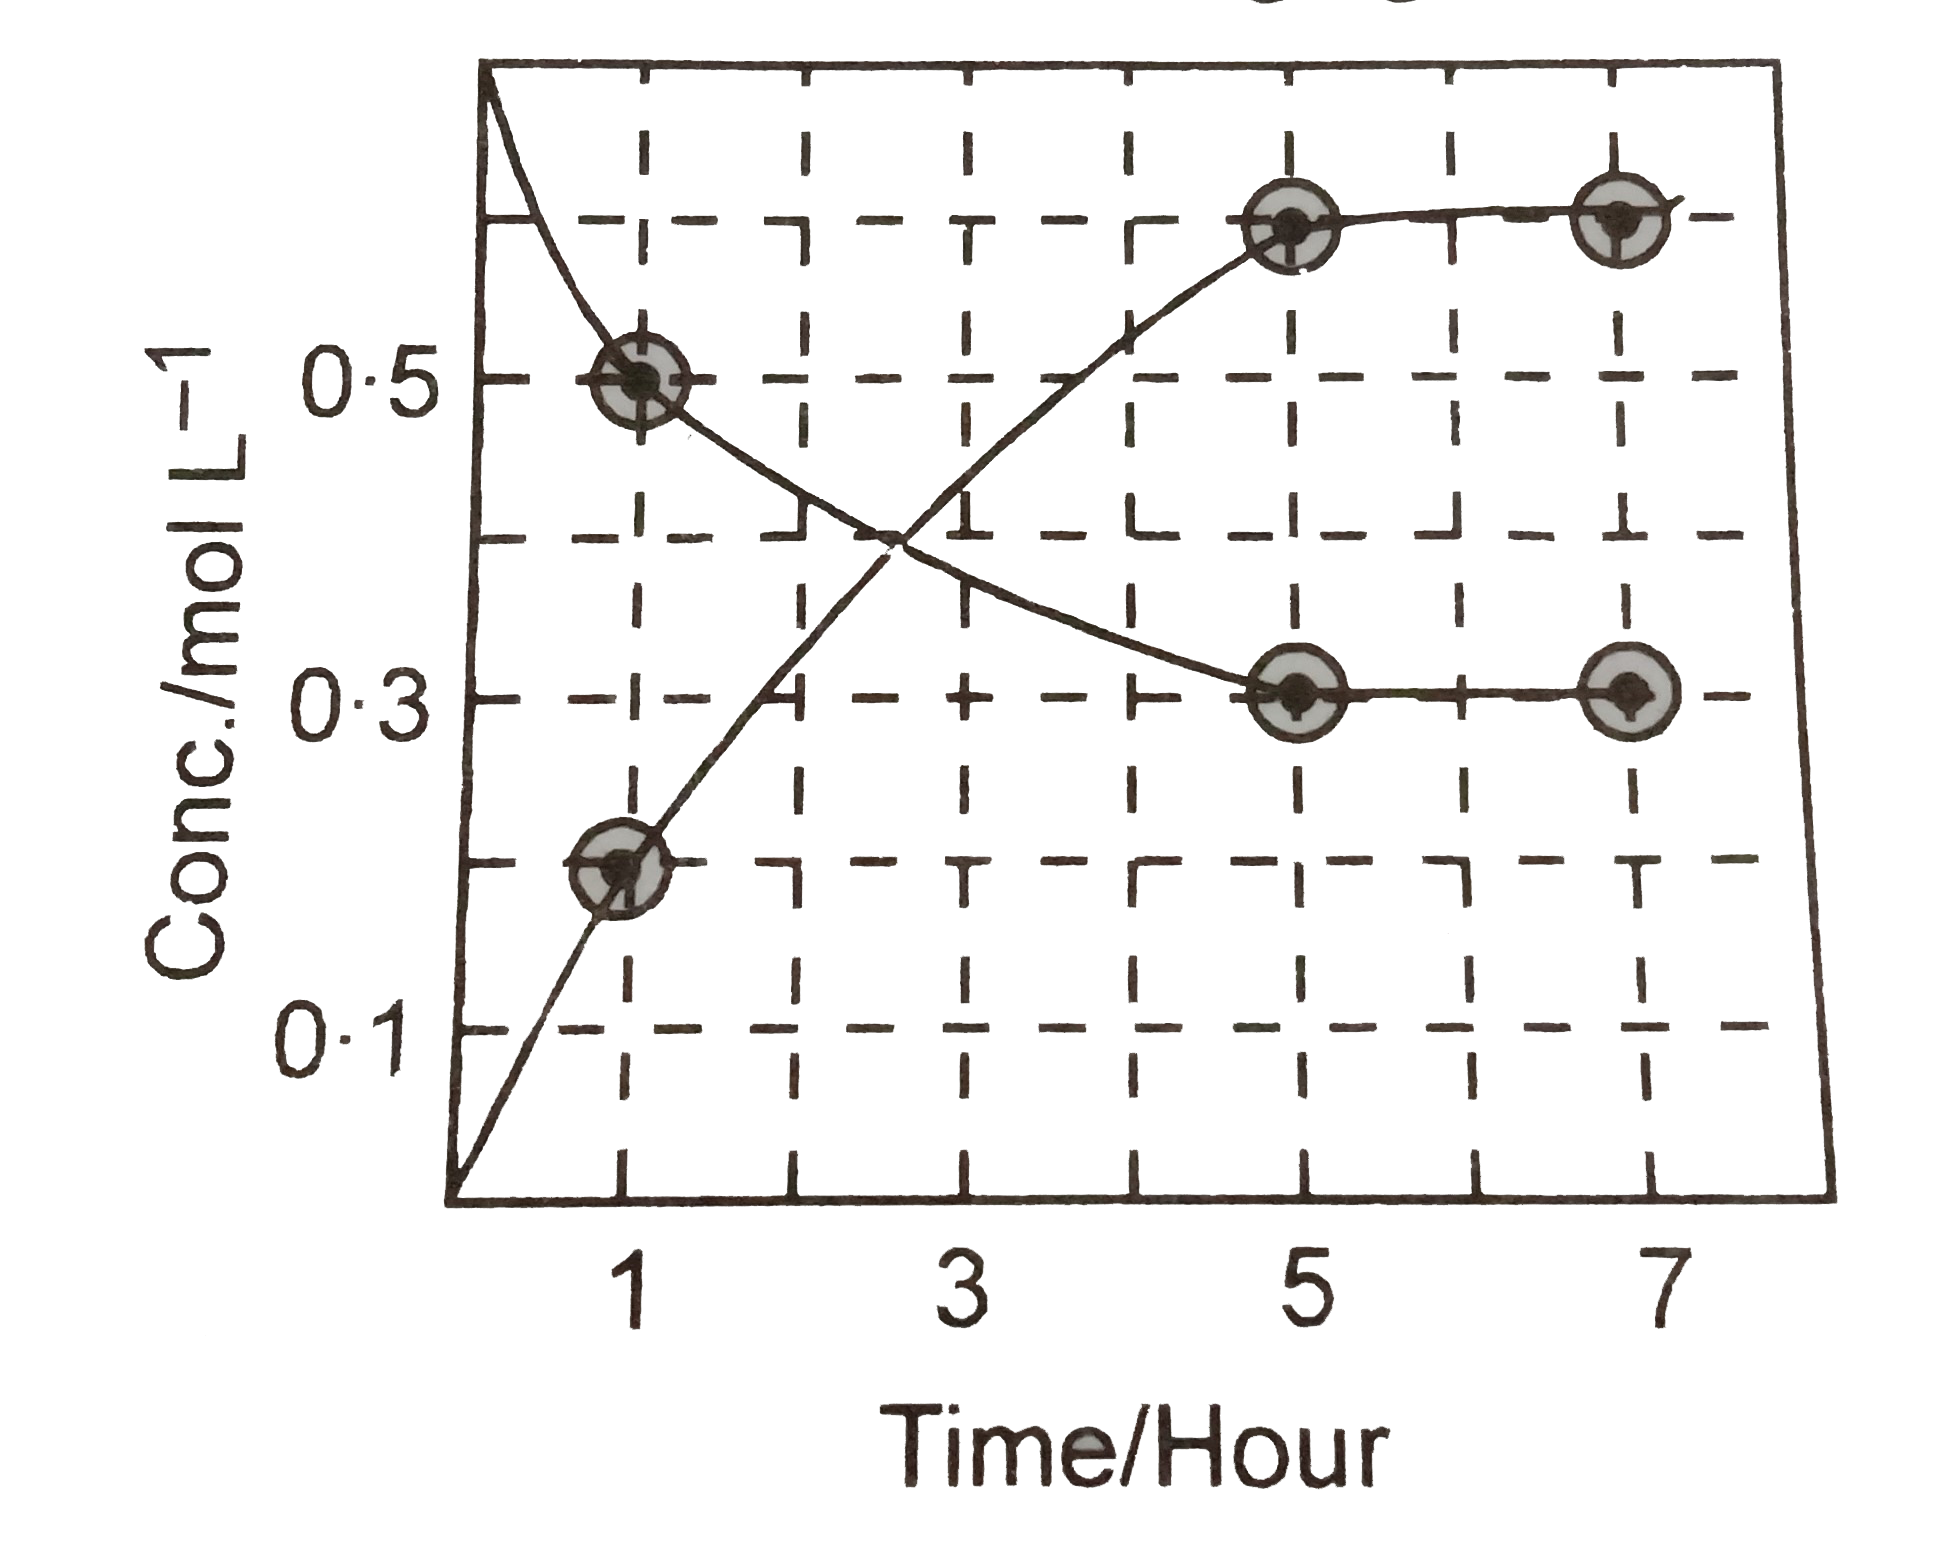
The process of the reaction A⇔nB with time is represented in the fig, given below
The value of n isA1B2C3D1.5Kp for the reaction A⇔B is 4. If initially only A is present then what will be the partial pressure of B after equilibrium ?
A1.2B0.8C0.6D1
The progress of the reaction A⇔nB , with time is presented in the figure. Determine (i) the value of n (ii) the equilibrium constant K (iii) the initial rate of conversion of A
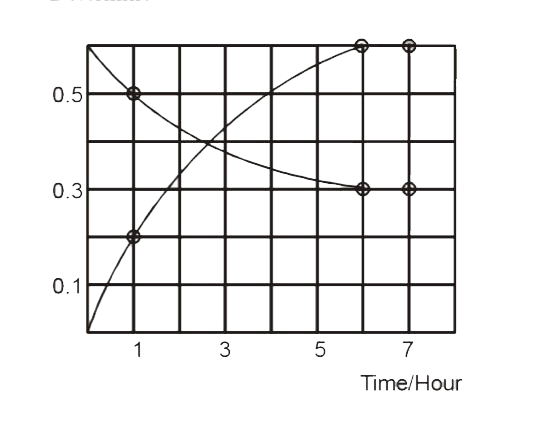
View SolutionThe progress of the reaction A⇔nB with time, is presented in figure. Determine
the value of n.
View SolutionThe progress of the reaction A⇔nB, with times is presented in the figure below.
Determine:
(a) The value of n , (b) Keq
( c) Initial rate of converison of A
View SolutionThe progress of the reaction A⇔nB with time, is presented in figure. Determine
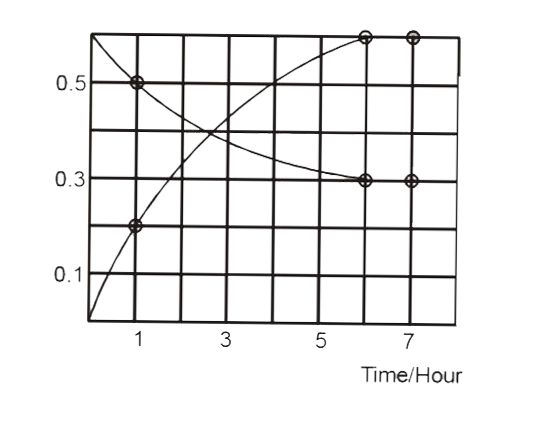
the equilibrium constant K.
View SolutionThe progress of the reaction A⇔nB with time, is presented in figure. Determine
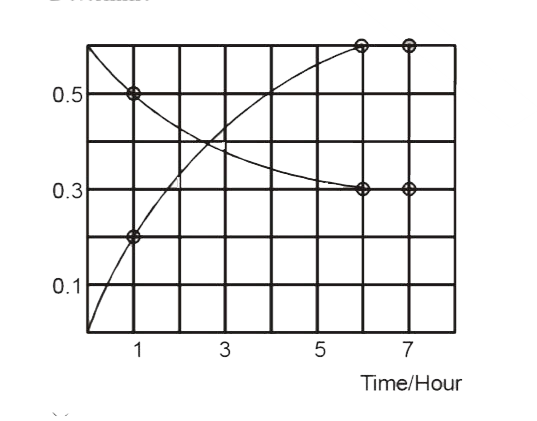
the initial rate of conversion of A.
View SolutionDetermine the values of equilibrium constant (KC)andΔGo for the following reaction :
View Solution
