A curve drawn at costant temperature is called on isotherm. This shows the relationship between :
P and 1V
PV and V
V and 1P
P and V.
The correct Answer is:D
Step by step video, text & image solution for A curve drawn at costant temperature is called on isotherm. This shows the relationship between : by Chemistry experts to help you in doubts & scoring excellent marks in Class 11 exams.
Updated on:21/07/2023Topper's Solved these Questions
- STATES OF MATTER : GASES AND LIQUIDSBook:DINESH PUBLICATIONChapter:STATES OF MATTER : GASES AND LIQUIDSExercise:Assignment (Very Short Answer Question)
Explore 24 Videos
- STATES OF MATTER : GASES AND LIQUIDSBook:DINESH PUBLICATIONChapter:STATES OF MATTER : GASES AND LIQUIDSExercise:Long Answer Question
Explore 7 Videos
- STATES OF MATTER : GASES AND LIQUIDSBook:DINESH PUBLICATIONChapter:STATES OF MATTER : GASES AND LIQUIDSExercise:Multiple Choice Question
Explore 26 Videos
- STATES OF MATTER (SOLID STATE CHEMISTRY)Book:DINESH PUBLICATIONChapter:STATES OF MATTER (SOLID STATE CHEMISTRY)Exercise:ULTIMATE PREPARATORY PACKAGE
Explore 21 Videos
- STRUCTURE OF ATOMBook:DINESH PUBLICATIONChapter:STRUCTURE OF ATOMExercise:Reason Type Questions
Explore 1 Video
Similar Questions
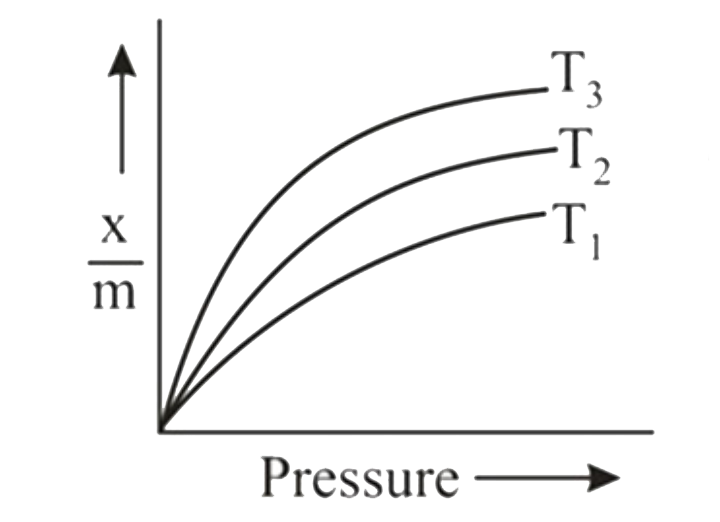
A graph of x/m vs pressure at constant temperature is called adsorption isotherm.Explain
View SolutionWhat is the relationship between oxidation and oxidising agent in a redox reaction? Write an example of a redox reaction showing the relationship between oxidation and the oxidising agent.
View Solution
Knowledge Check
A curve drawn at constant temperature is called an isotherm. This shown the relationship between :
AP and 1VBPV and VCV and 1PDP and VLichens show symbiotic relationships between
AFungus and roots of higher plantsBFungus and algaCTwo algaeDTwo fungiThe variation of extent of adsorption with pressure at a given constant temperature is given in following figure

Which of the following relation between temperature of isotherms is correct ?AT1=T2=T3BT1<T2<T3CT3<T2<T1DT1<T2>T3
Applying different potential at the ends of p-n junction , current is measured for increasing potential. Which curve shows the relationship between current and potential.
View SolutionA curve between magnetic moment and temperature of magnet is
View SolutionThe curve between adsorption and pressure at constant temperature is called as
View SolutionA diagram that shows the relationship between two variables is called
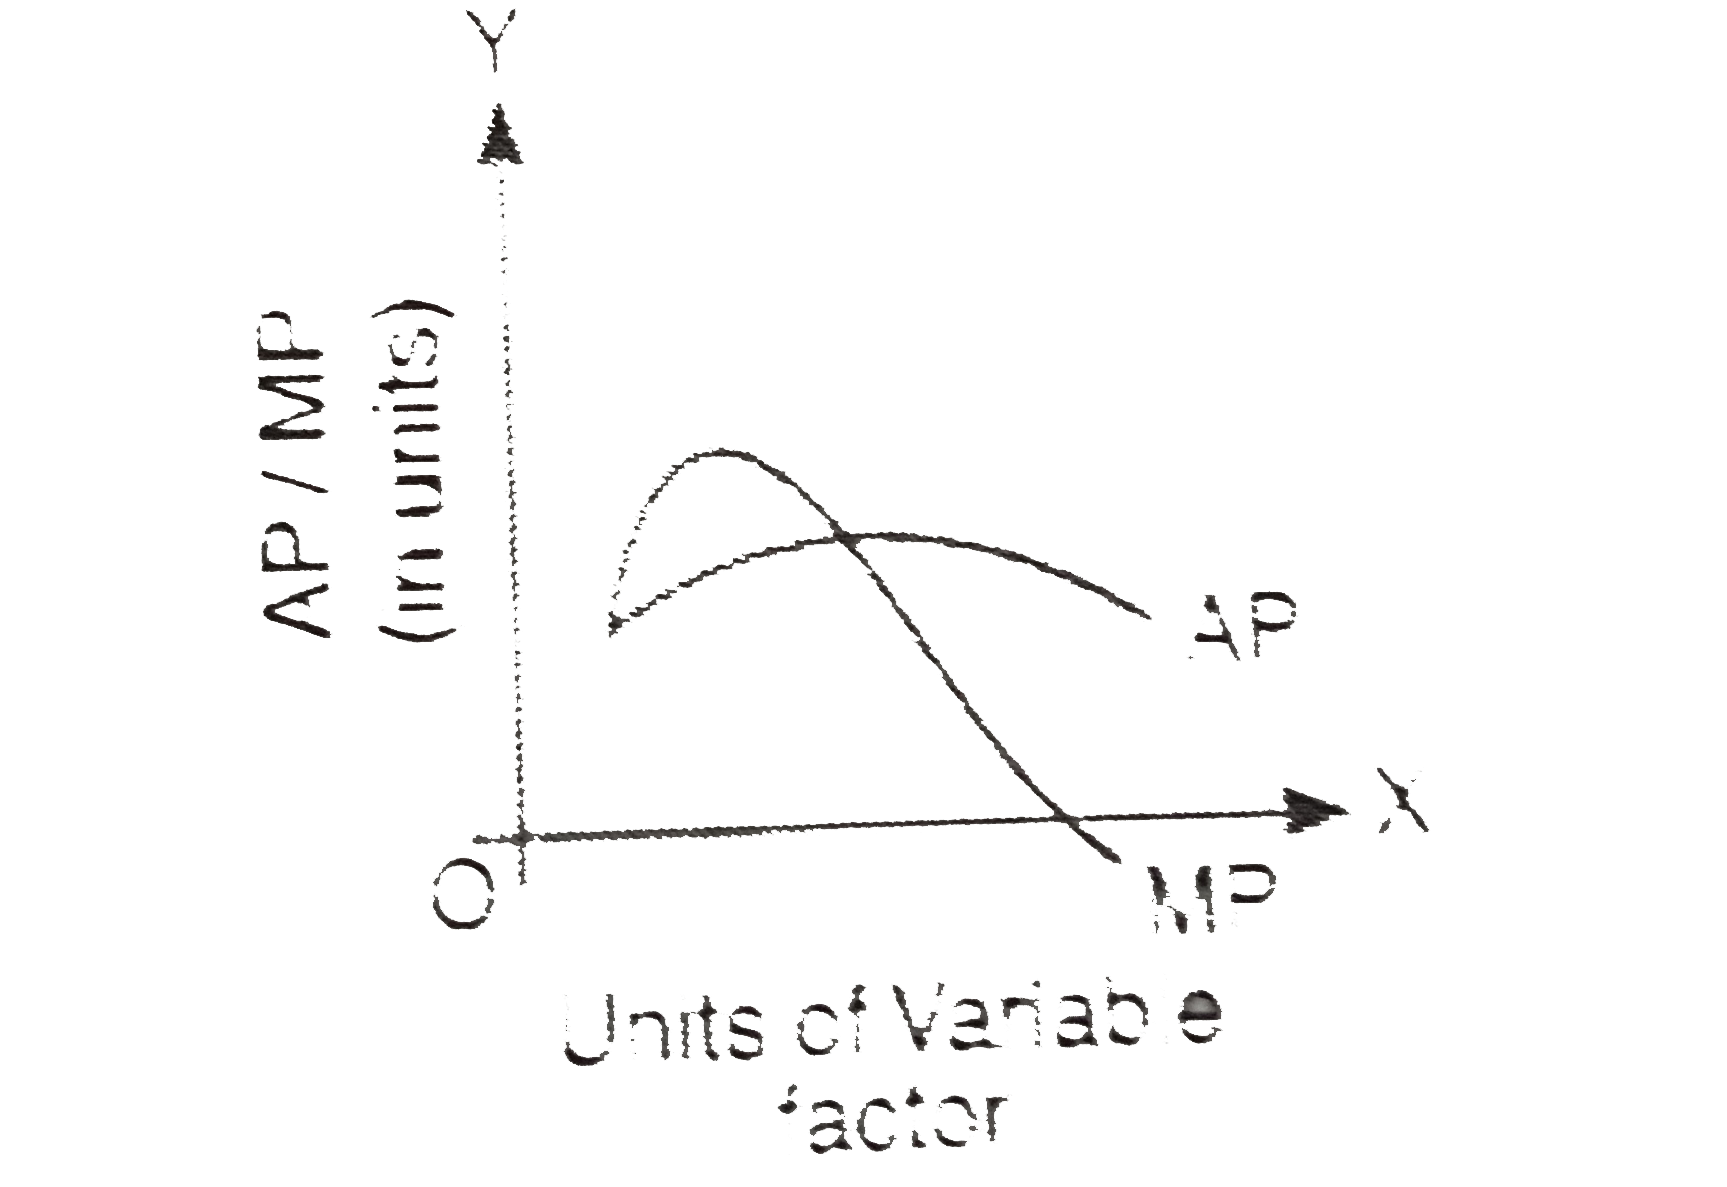
View SolutionWhich of the following is correct statement showing showing the relationship between AP and MP ?

View Solution

