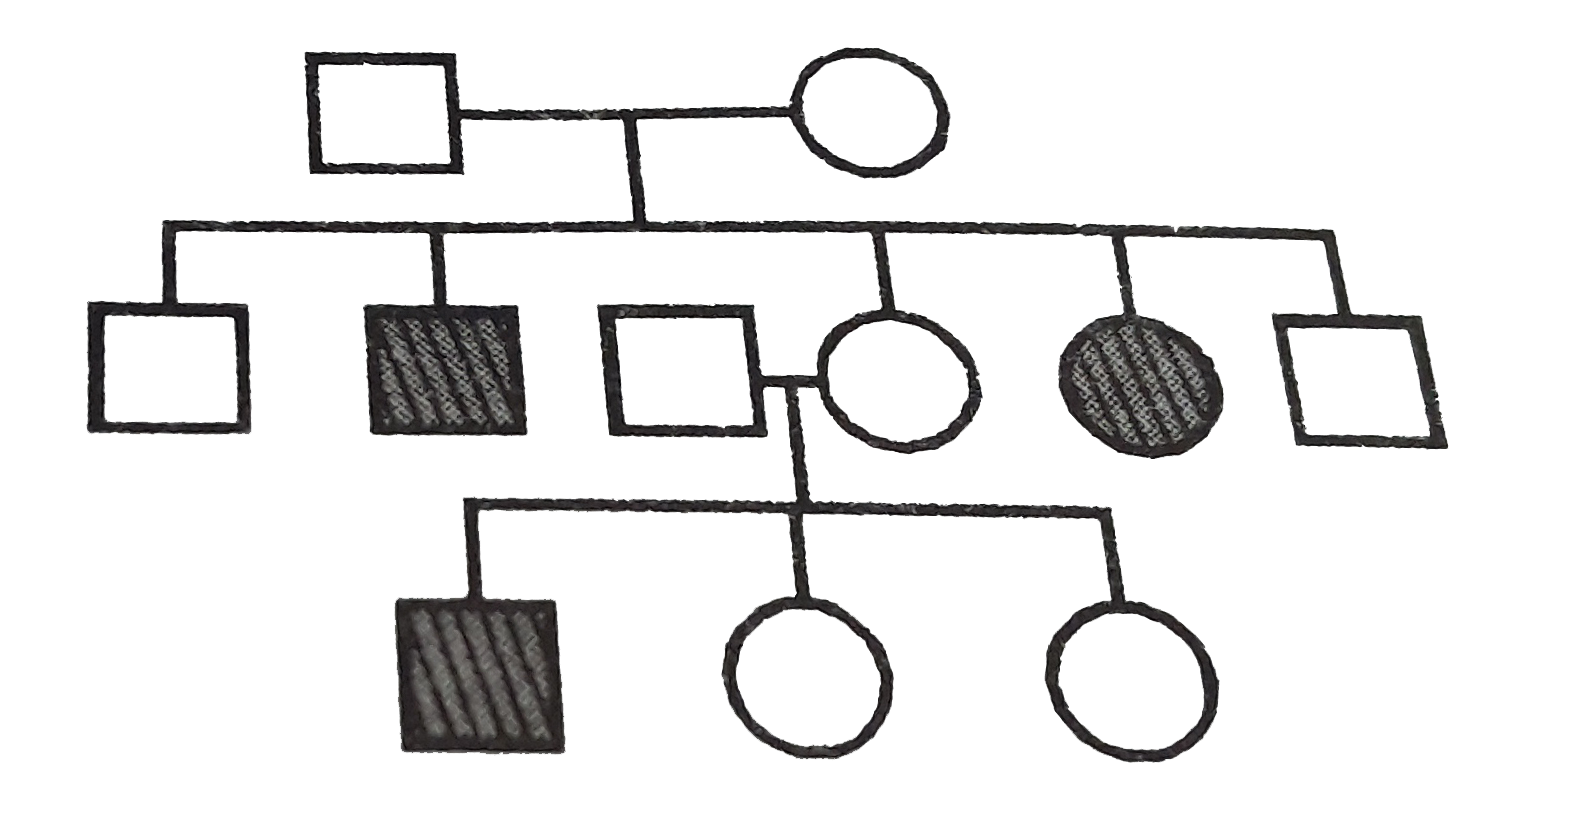
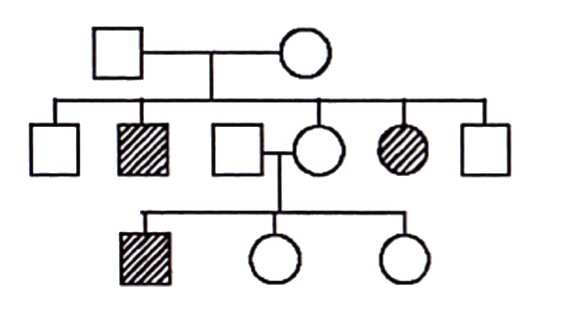
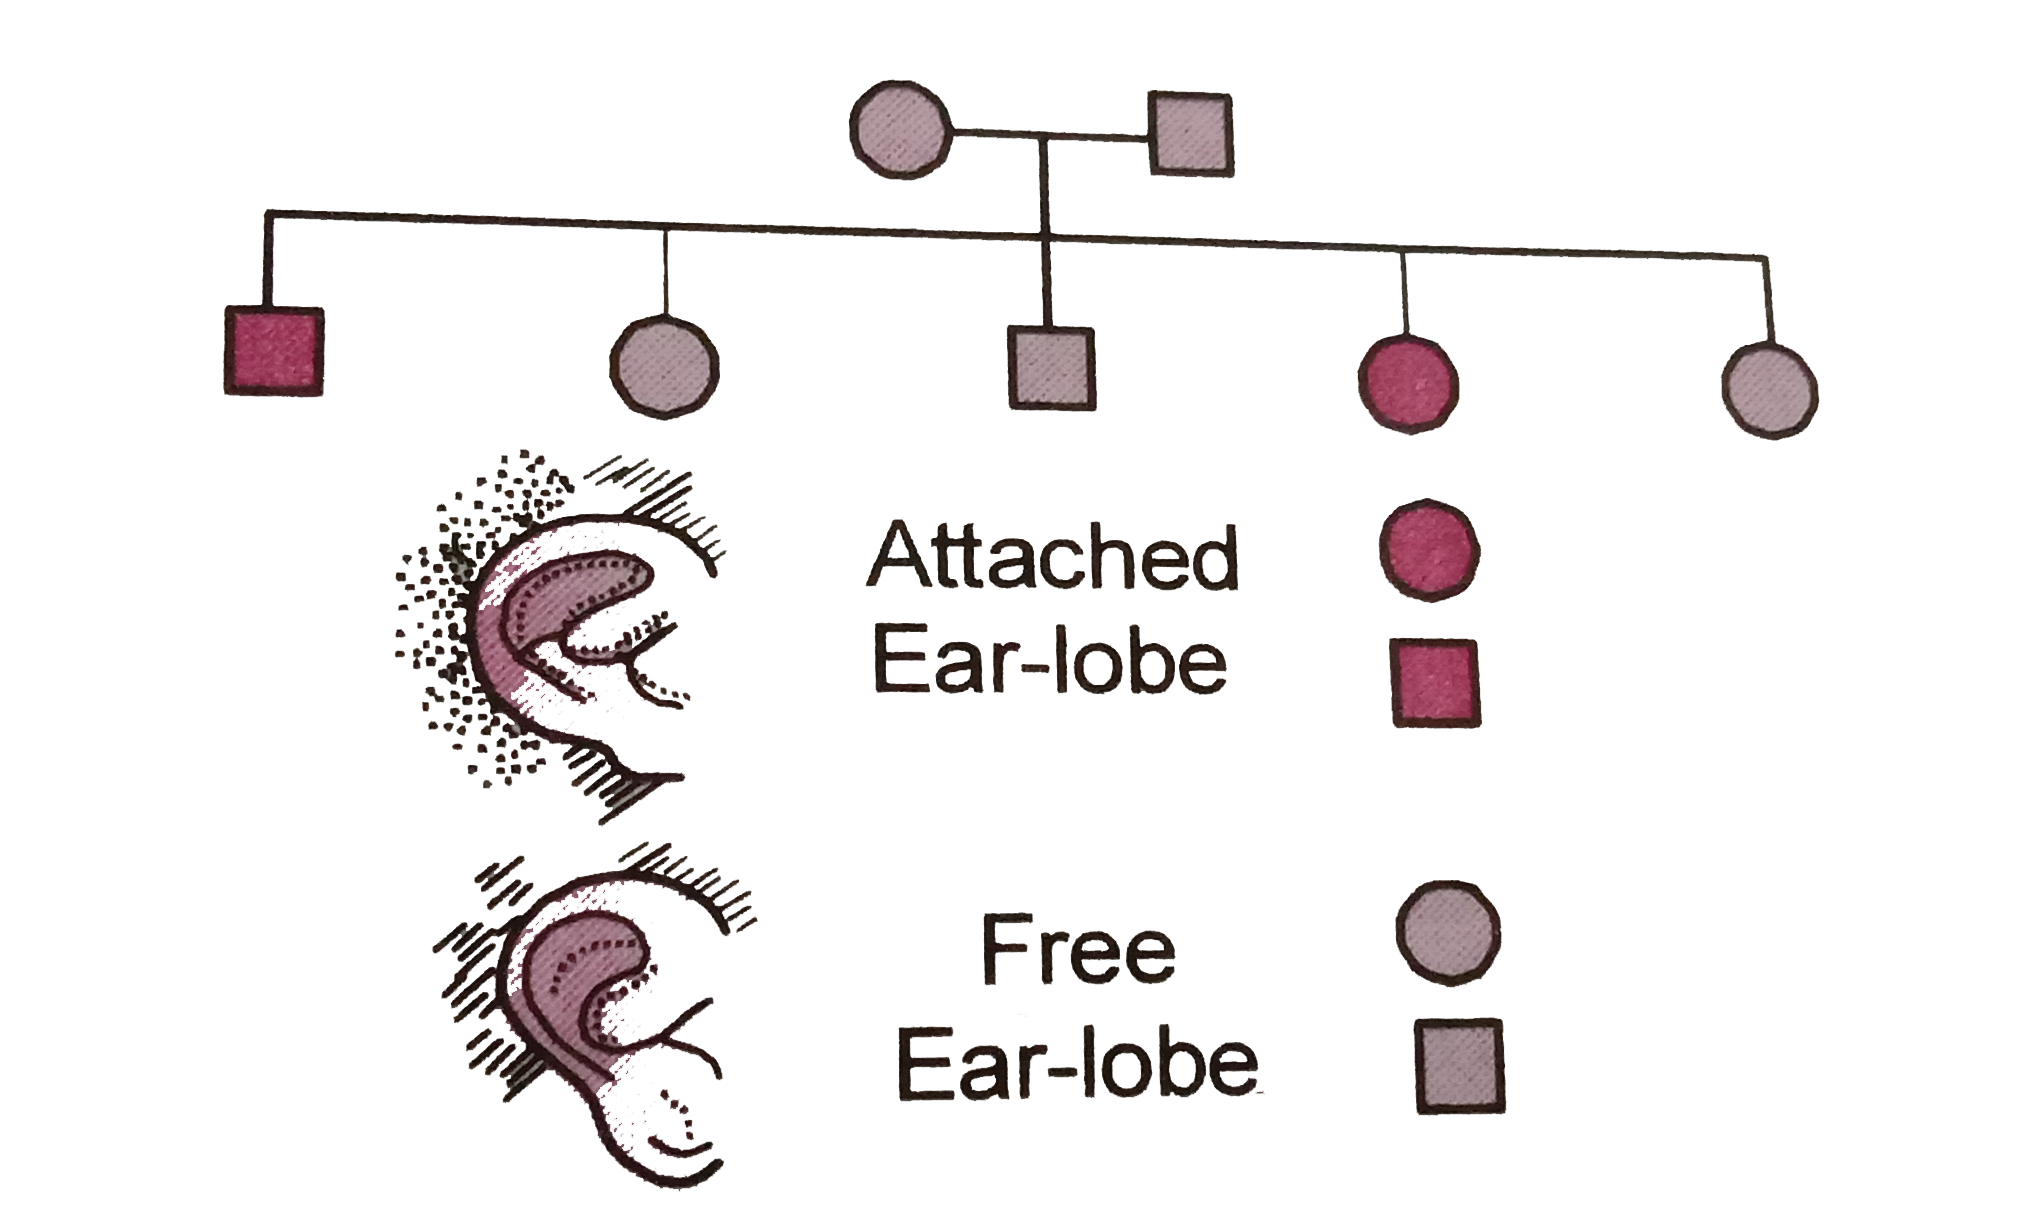
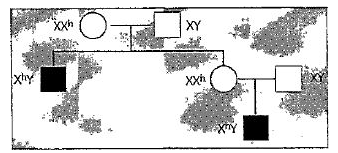
Study the pedigree chart given below : 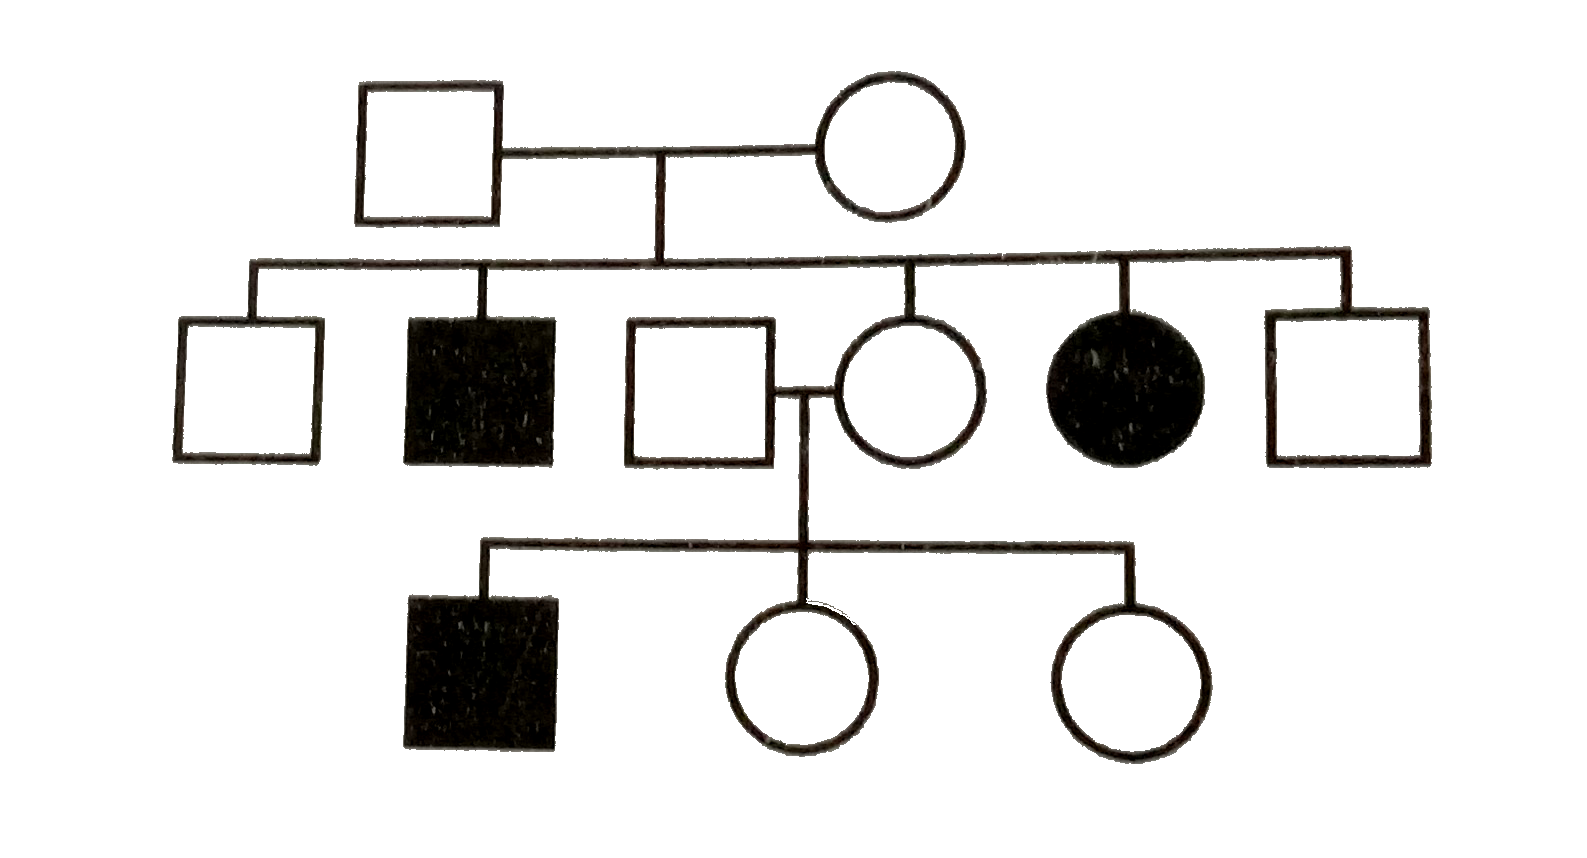
What does it know
Inheritance of a recessive sex-linked disease like haemophilia
Inheritance of a sex-linked inborn error of like phenylketonuria
Inheritance of a condition like phenylketonuria as an autosomal recessive trait
The pedigree chart is wrong as this is not possible
The correct Answer is:C
Step by step video, text & image solution for Study the pedigree chart given below : What does it know by Biology experts to help you in doubts & scoring excellent marks in Class 12 exams.
Updated on:21/07/2023Similar Questions
Knowledge Check
Study the pedigree chart given below
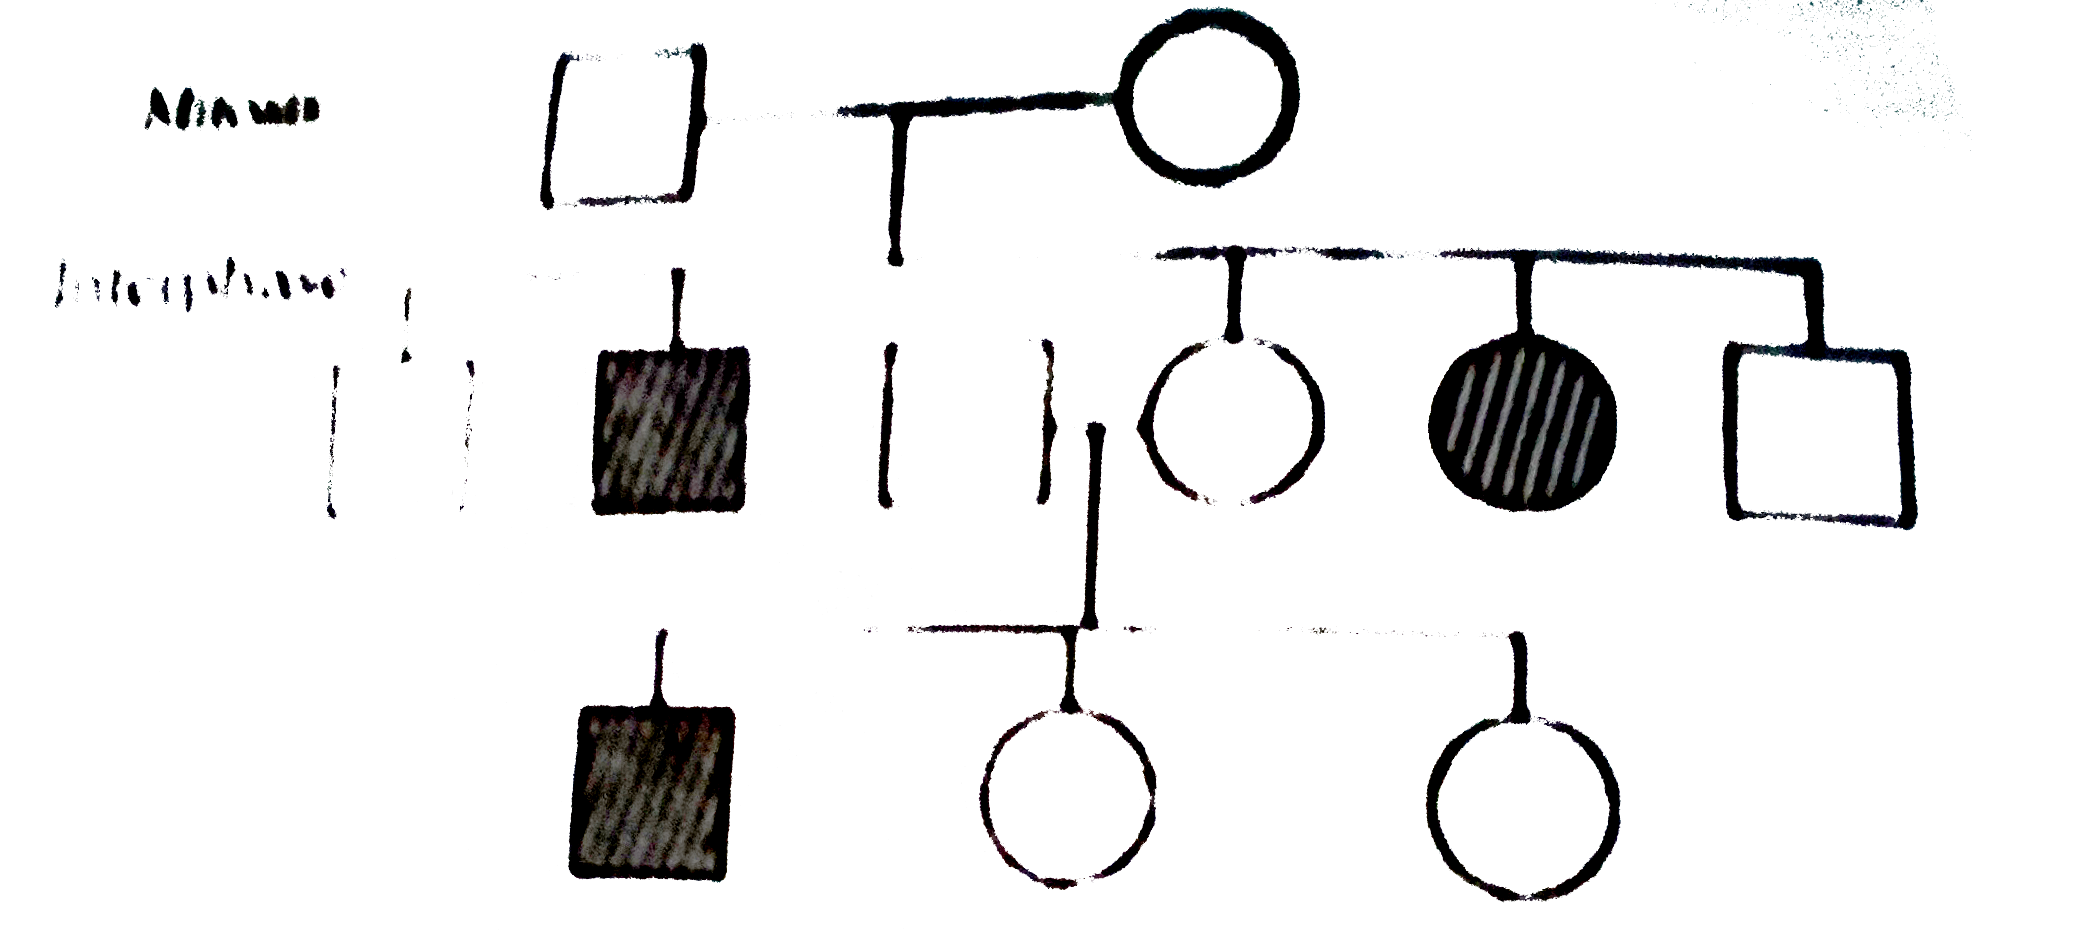
What does its showAInheritance of a sex-linked inborn error of metabolism like phenylketonuriaBInheritance of a condition like phenylketonuria as an autosomal recessive traitCThe pedigree chart is wrong as this is not possibleDInheritance of a recessive sex-linked disease like haemophiliaFrom the pedigree chart find out if
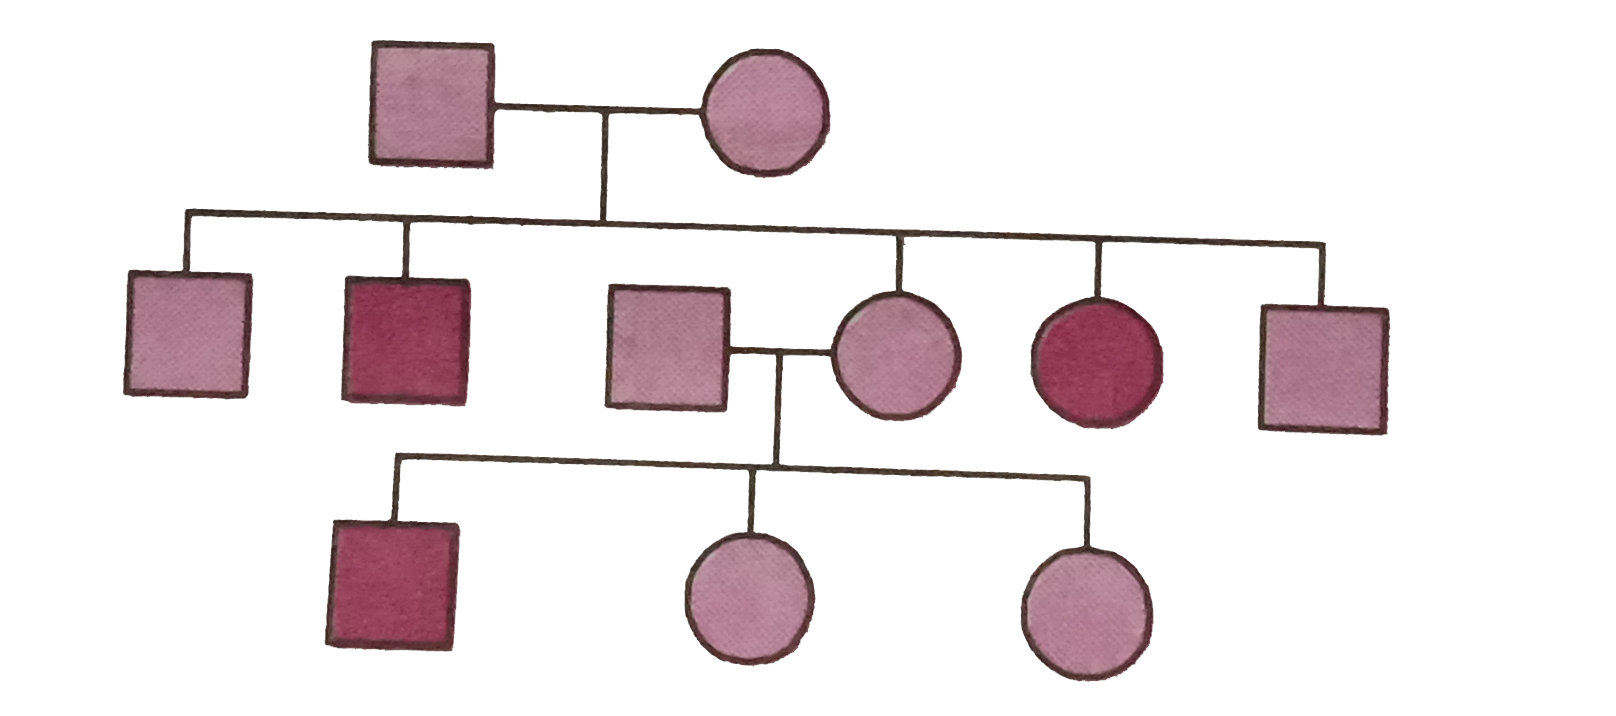
 AParents are homozygousBParents are heterozygousCParents are homozygous recessiveDTrait is Y- linked
Study the pedigree chart what does it show?
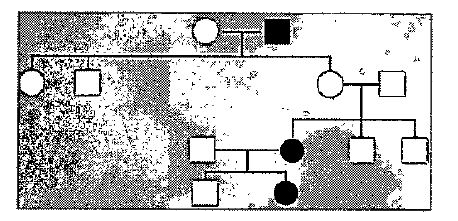
 AInheritacne of a condition like phenylketonur as an atuosomal recessive traitBInheritatacne of a resceesive sex linked disease like hamemophiliaCInheritacne of sex linked inborn error of metabolism like pheylketonuriaDPedigree chats is worng as this is not possible
Study the pedigree chart given below and find out whether the given hypothetical trait is:
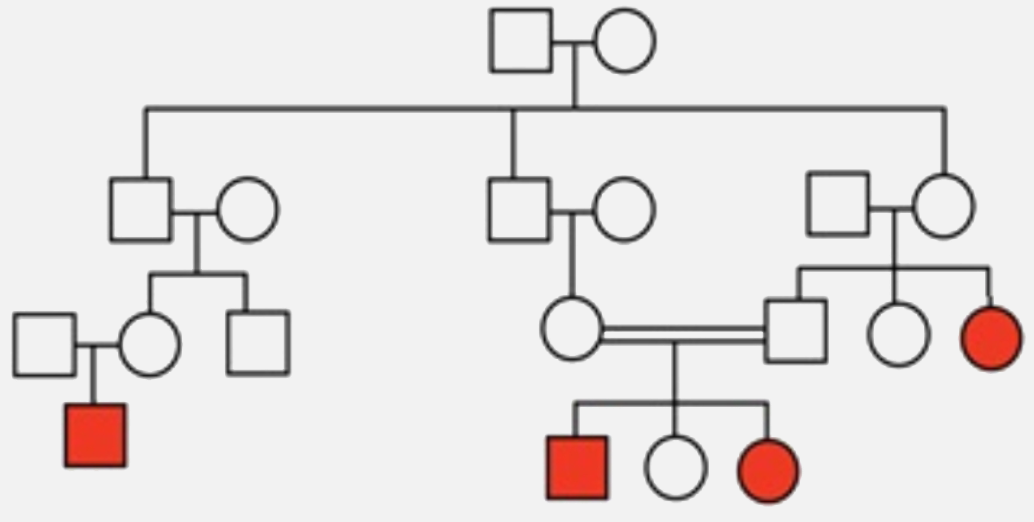
View SolutionAnalyze the pedigree chart given below and draw the conclusion for the genotype of parents undergoing consanguineous marriage.
View SolutionA couple had a son who was haemophilic along with a normal daughter.
The daughter then grew older and was married to a man who was normal. They daughter had a haemophilic son.
Study the pedigree chart given above and find out the correct analysis-
View SolutionStudy the pie chart given below and answer the question that follow
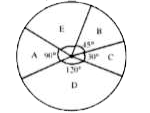
Which heads is allocated maximum funds?
View SolutionStudy the pie chart given below and answer the question that follows. The total amount collected for flood relief from different sources is shown in the pie chart-

What is the approximate ratio of collection from corporates to Central Government ?
View Solution


