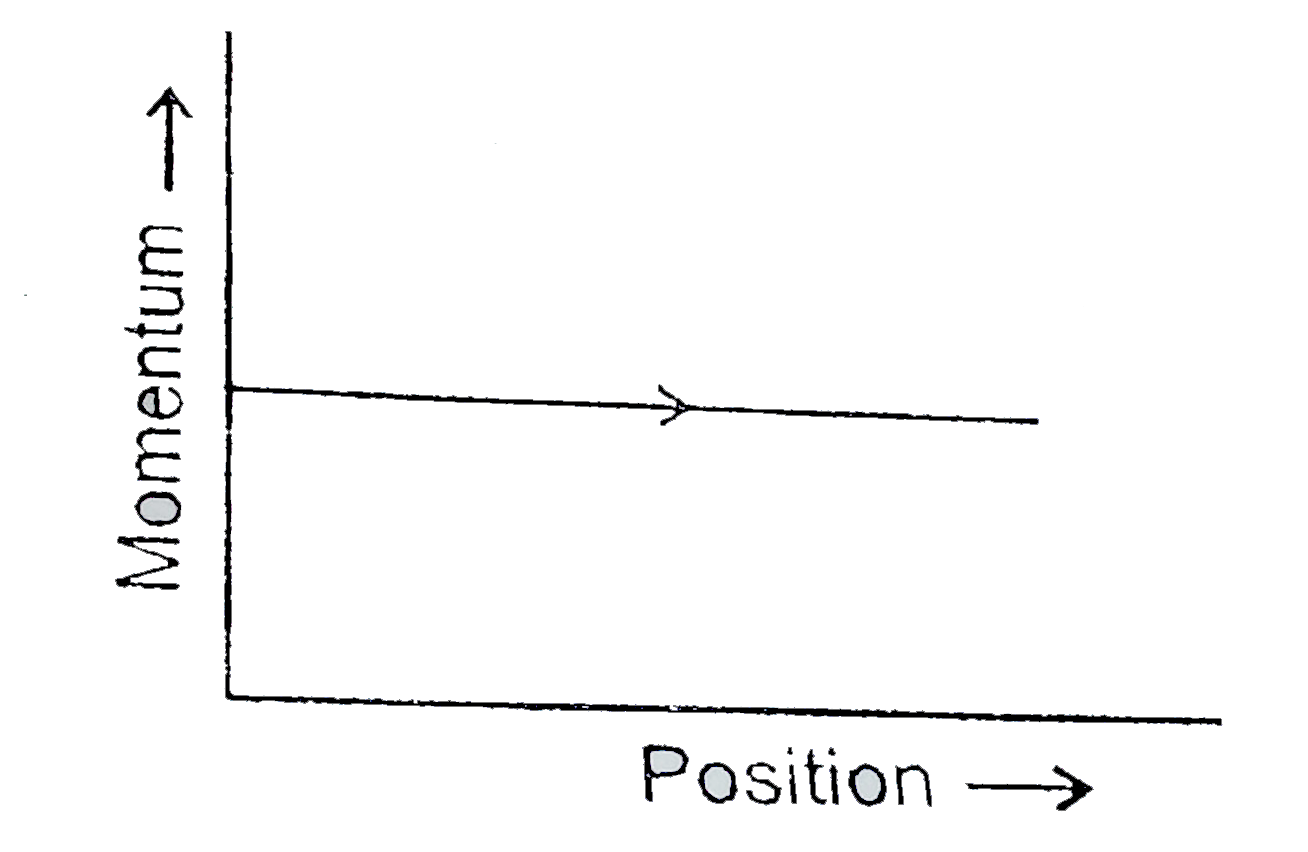
Phase space diagrams are useful tools in analysing all kond of dynamical problems. Theya re especially useful in studying the changes in motion as initial position and momentum are changed. Here we consider some simple dynamical system in one-dimelnsion. for such systeam, phase space is a plane in which position is plotted along horizontal axis and momentum is plotted along vertical axis. The phase space diagram is x(t) vs. p(t) curve in this plane. The arrow on the curve indicates the time flow. for example, the phase space diagram for a particle moving with constant velocity is a straight line as shown in the figure. We use the sign convention in which position or momentum. upwards (or to right) is positive and downwards (or to left) is negative.
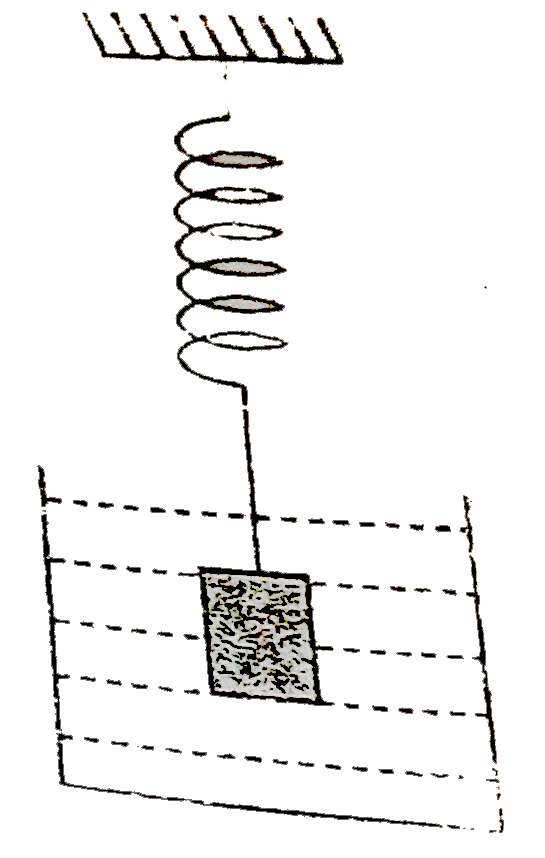
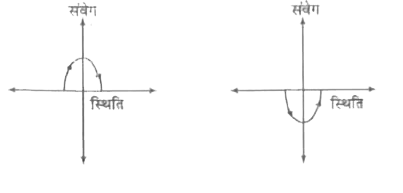
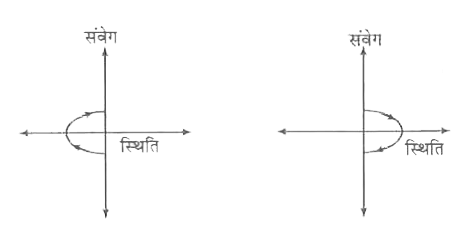
Consider the spring-mass system, with mass submerged in water, as shown in the figur, the phase diagram for one cycle of this system is :
E1=√2E2
E1=2E2
E1=4E2
E1=16E2
The correct Answer is:C
In the 1st case amplitude of SHM is a.
In the 2nd case amplitude of SHM is 2a.
Total energy =12k(amplitude)2
E1=12k(2a)2 and E2=12k(a)2 implies E1=4E2.
Similar Questions
हर प्रकार की गतिकीय समस्याओं के निश्लेषण के लिए कला-समष्टि चित्रा (Phase space diagrams) का उपयोग किया जाता है। प्रारम्भिक दशा, स्थिति व संवेग में बदलाव होने पर इनका उपयोग चालन में उत्पन्न बदलावों को समझने में बहुत उपयोगी है। यहाँ हम एकविमीय सरल गतिकीय निकायों की बात करते हैं। इनके लिए कला-समष्टि समतल है जिसमें स्थिति X-अक्ष पर तथा संबेग Y-अक्ष पर रखते हैं, तब कुला-समष्टि चित्र इस समतल में एक x(t)-p(t) वक्र होगा। वक्र पर तीर समय बढ़ने की दिशा को दर्शाता है।
उदाहरण के लिए, स्थिर वेग से चल रहे कण के लिए कला- समष्टि चित्रा है, सरल रेखा है, जिसे चित्र में दिखाया गया है। चिह्न परिपाटी में स्थिति या संवेग को ऊपर (या दाहिने) ओर धनात्मक तथा नीचे (या बाई) ओर ऋणात्मक माना जाता है।
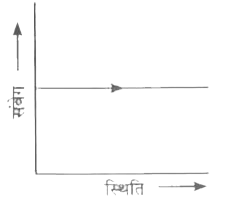
1. जमीन से ऊपर की ओर फेंकी गई गेंद का कला-समष्टि चित्रा है।
 05:49View Solution
The choice of reducing agent for metal oxide is decided by thermodynamic principles of metallurgy. ΔG must be negative. Ellingham diagram is a plot of ΔfG0 vs T for the formation of oxides of various elements. All the plots slope upwards when temperature increases. Each plot is a straight line except when some change in phase takes place. A metal will reduce the oxide of other metals which lie above it in this diagram.
ΔG0 vs T plot in the Ellingham's diagram slopes downward for the reaction.View SolutionIn case of a simple harmonic motion, if the velocity is plotted along the X-axis and the displacement (from the equilibrium position) is plotted along the Y-axis, the resultant curve happens to be an ellipse with the ratio ("major axis (along X)")/("minor axis (along Y)")=20pi What is the frequency of the simple harmonic motion?
03:35View Solutionएक कण द्रव्यमान m=5 इकाई का एकसमान गति V=3√2 से रेखा Y=X+4 के अनुदिश XY तल में घूम रहा है । मूलबिन्दु के सापेक्ष इसके कोणीय संवेग का परिमाण
03:24View SolutionIn case of a simple harmonic motion, if the velocity is plotted along the X-axis and the displacement (from the equilibrium position) is plotted along the Y-axis, the resultant curve happens to be an ellipse with the ratio =major axis along Xminor axis along Y=20π
What is the frequency of the simple harmonic motion?View SolutionIn case of a simple harmonic motion, if the velocity is plotted along the X-axis and the displacement (from the equilibrium position) is plotted along the Y-axis, the resultant curve happens to be an ellipse with the ratio:
major axis(along X)minor axis(alongY)=20π
What is the frequency of the simple harmonic motion?03:56View SolutionIn case of a simple harmonic motion, if the velocity is plotted along the X-axis and the displacement (from the equilibrium position) is plotted along the Y-axis, the resultant curve happens to be an ellipse with ratio: ("major axis(along X)")/("major axis (along Y)")=20pi What is the frequency of the simple harmonic motion ?
05:25View SolutionWhat is change of phase? Discuss different types of change of phase with respect of P-T diagram.
08:47View Solution
