निम्नलिखित बान-ग्राफ का अध्ययन करें और प्रश्नों का उत्तर दें। बार-ग्राफ में वर्ष 1975 से 1987 तक प्रतिशत में मुद्रा-स्फीति की वार्षिक दर प्रतिशत में दी गई है ?
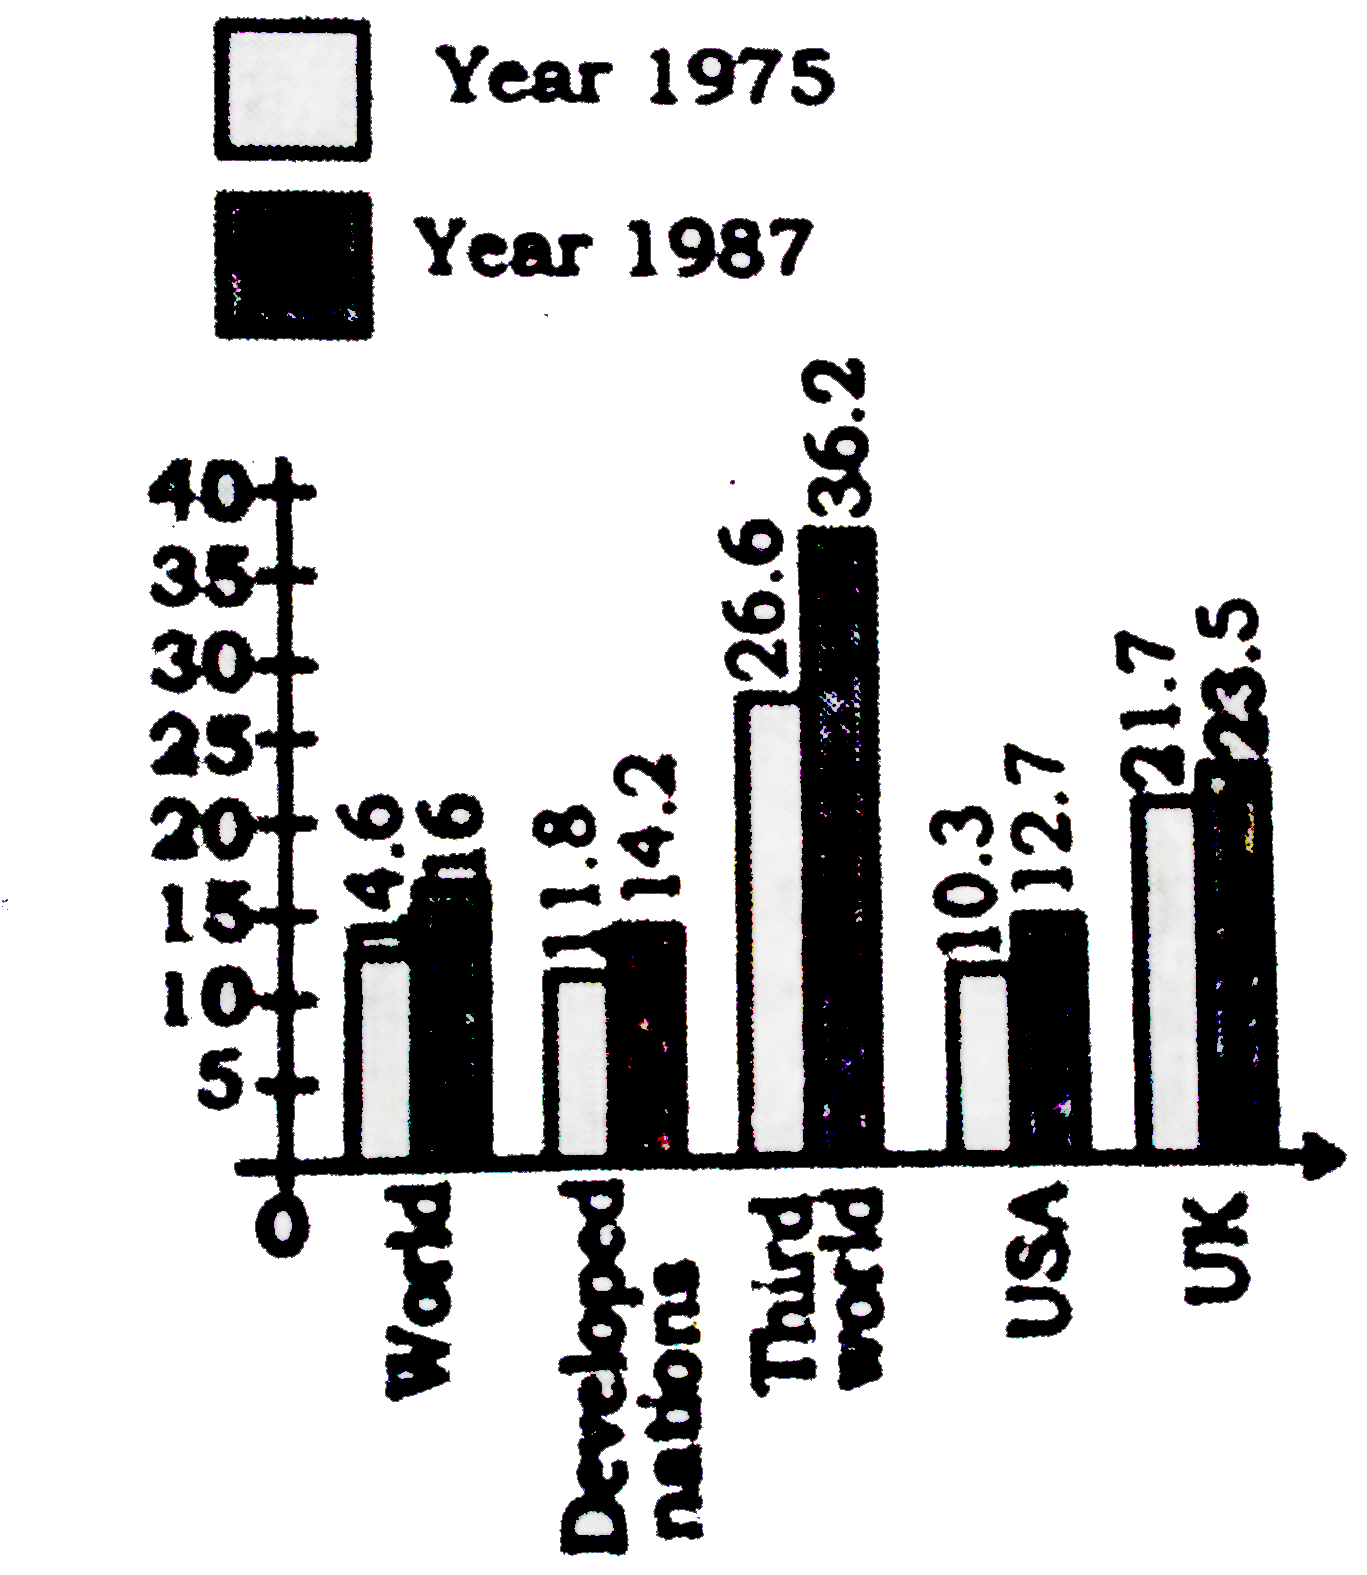
मुद्रास्फीति के परिवार की निम्नतम दर इन में से कहाँ थी ?
विकसित देशों में
यू.के.
विश्व में
तीसरी दुनिया में
From graph it is clear that minimum charge of rate is for world =16−14.6=1.4
Similar Questions
In the following table, the production of various crops (in tonnes) is given from 2015 to 2019. Study the table and answer the question that follows:
दी गयी तालिका में, 2015 से 2019 तक विभिन्न फसलों का उत्पादन (टन में ) दिया गया है | इस तालिका का अध्ययन करें तथा फिर पूछे गए प्रश्न का उत्तर दीजिए |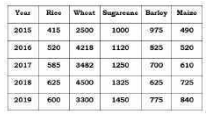 The percentage growth of maize in the year 2019 over the year 2015 is: (correct to one decimal place)
वर्ष 2019 में वर्ष 2015 की तुलना में मक्का के उत्पादन में कितने प्रतिशत की वृद्धि हुई है ? ( दशमलव के एक स्थान तक )
View SolutionStudy the graph and answer the questions based on the graph:
आरेख का अध्ययन करें और आरेख के आधार पर प्रश्नों के उत्तर दें: What was the percentage decline in the production from Friday to Saturday?
शुक्रवार से शनिवार तक उत्पादन में कितने प्रतिशत की गिरावट रही?
View SolutionStudy the given chart carefully and answer the question accordingly:
दिए गए चार्ट का ध्यानपूर्वक अध्ययन करें और उसके अनुसार प्रश्न का उत्तर दें: In which of the following years was the percentage increase in production from the previous year, the maximum among the given years?
पिछले वर्ष की तुलना में निम्नलिखित वर्षों में से किस वर्ष में उत्पादन में अधिकतम प्रतिशत वृद्धि हुई?
View SolutionStudy the given chart and answer the following questions:
दिए गए चार्ट का अध्ययन करें और निम्नलिखित प्रश्नों के उत्तर दें: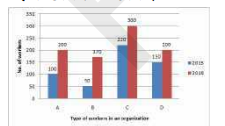 The percentage increase in the number of workers in 2018 is maximum as compared to that is
2015 in case of workers of type:
2018 में श्रमिकों की संख्या में प्रतिशत वृद्धि 2015 की तुलना में अधिकतम है, जो कि किस प्रकार के श्रमिकों के मामले में है?
View SolutionStudy the chart and answer the questions:
In which of the given years is the percentage increase in the number of hotels in comparison to the previous year, is the maximum?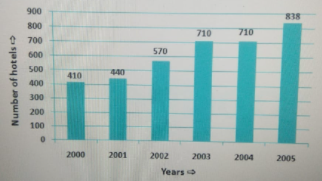
चार्ट का अध्ययन करें और प्रश्नों का उत्तर दें:पिछले वर्ष की तुलना में होटलों की संख्या में किस वर्ष में अधिकतम प्रतिशत वृद्धि हुई है?
View Solutionनीचे दिया गया दण्ड आलेख वर्ष 1993 में एक परिवार की आय का विभिन्न मदों पर व्यय एवं बचत को दर्शाता है। आलेख का ध्यानपूर्वक अवलोकन कीजिए तथा उत्तर दीजिए: 1993 में व्यय की गयी पारिवारिक आय (प्रतिशत में) Percentage of expenditure on cloths is how much more than saving percentage ? कपड़े पर व्यय का प्रतिशत, बचत प्रतिशत से कितना अधिक है?
View SolutionThe following figure shows the number of students (in thousands) admitted and passed out per your in a college during years 2000 to 2004, study the figure and answer the questions : : निम्नलिखित आकृति में किसी कॉलेज में वर्ष 2000 से वर्ष 2004 तक प्रति वर्ष भर्ती हुए और उर्तीण हुए छात्रों की संख्या (हजार में) दर्शायी गई है। आकृति का अध्ययन कर प्रश्नों के उत्तर दीजिए : The percent increase in the number of students admitted in the year 2003 over that in 2001 is वर्ष 2001 की तुलना में वर्ष 2003 में भर्ती हुए छात्रों की संख्या में हुई प्रतिशत वृद्धि कितनी है ?
View SolutionThe following figure shows the number of students (in thousands) admitted and passed out per your in a college during years 2000 to 2004, study the figure and answer the questions :
: निम्नलिखित आकृति में किसी कॉलेज में वर्ष 2000 से वर्ष 2004 तक प्रति वर्ष भर्ती हुए और उर्तीण हुए छात्रों की संख्या (हजार में) दर्शायी गई है। आकृति का अध्ययन कर प्रश्नों के उत्तर दीजिए :
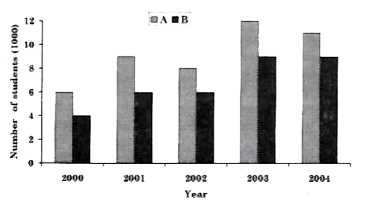
In which of the two years, the pass percentage of students was between 60 to 70 ?
कौन-से दो वर्षों में छात्रों का उत्तीर्ण प्रतिशत 60 से 70 के बीच थी?
View Solution
