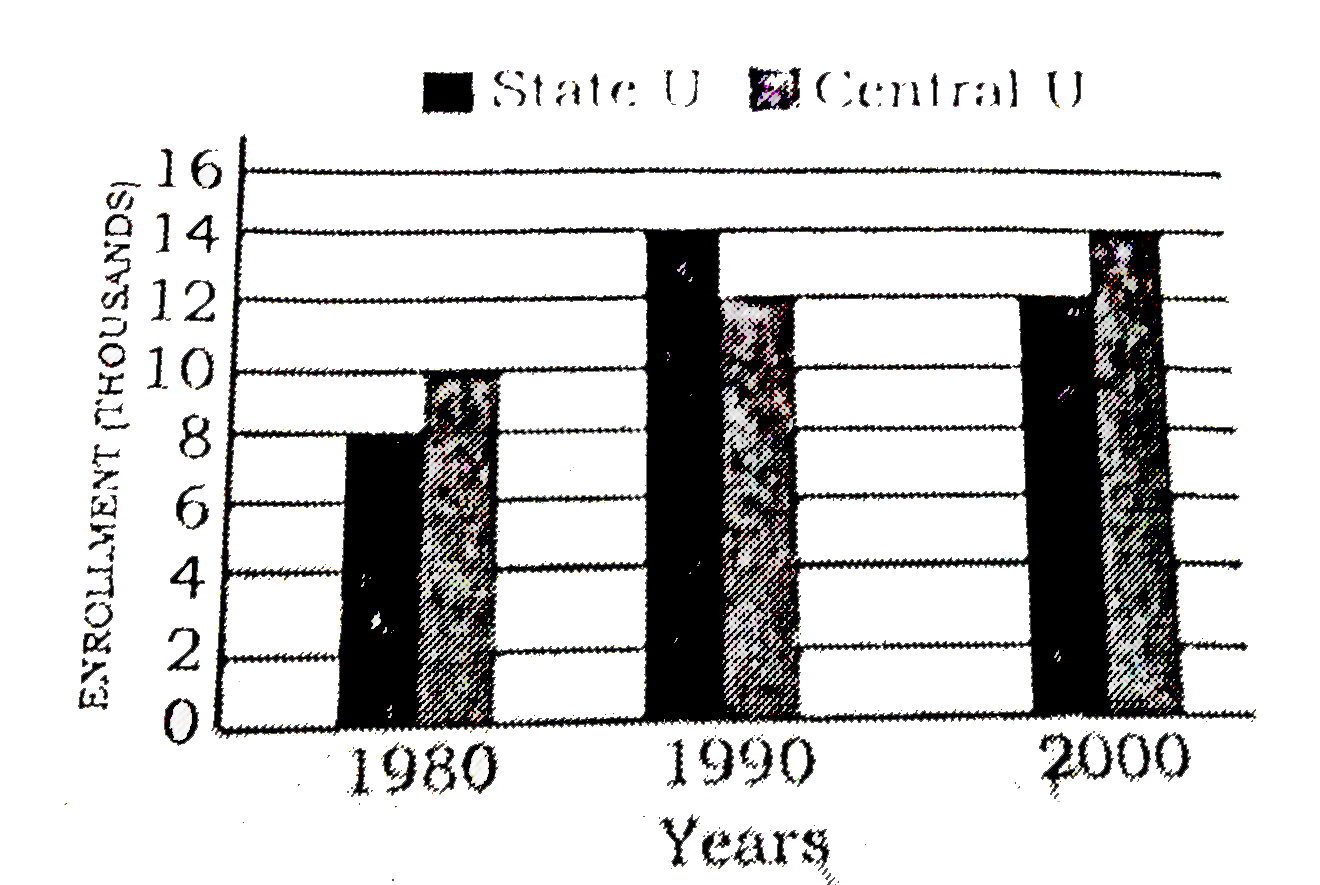
निर्देश (220-223) : निम्नलिखित बार ग्राफ को ध्यान से पढिये और प्रश्नों के उत्तर दीजिये ।

वर्ष 1980 और 2000 में राज्य विश्वविधालय और केन्द्र विश्वविधालय में हुए कुल नामांकन का अनुपात बताइये ?
Total enrollments in 1980,2000 at state
University =8+12=20
Total enrollments in 1980,2000 at state university =8+12=20
Total enrollments in 1980,2000 at central university=10+14=24
Required ratio =20:24=5:6
Similar Questions
The area of the shaded part in the figure given below is ______.
 02:03View Solution
The inequation represented by the graph given below is :
02:10View SolutionThe inequation that best describes the graph given below is _________
02:17View SolutionThe inequation that best describes the following graph is _________
02:10View SolutionWhich inequations represent the shaded region in the given figure
04:23View SolutionIn Fig, find the value of x.
ltimg src="https://d10lpgp6xz60nq.cloudfront.net/physics_images/PS_MATH_IX_C12_S01_032_Q01.png" width="80%"gt01:13View SolutionMatch the followings (column I with column II)
ltimg src="https://d10lpgp6xz60nq.cloudfront.net/physics_images/NCERT_BIO_XI_C03_E01_011_Q01.png" width="80%"gt03:12View SolutionMatch column I with column II:
ltimg src="https://d10lpgp6xz60nq.cloudfront.net/physics_images/NCERT_BIO_XI_C18_E01_003_Q01.png" width="80%"gt05:46View Solution

