निर्देश :- दंड आलेख को ध्यान से पढ़कर प्रश्नो के उत्तर दे लगातार वर्षो में जुलाई से नवंबर से दौरान एक परिवार द्वारा बिजली की खपत ।

इन दो वर्षो के बीच किस महीने में यूनिट खपत का अंतर सर्वाधिक रहा ?
october
August
November
July
Difference in units consumed in 2012 and 2013
Difference in July=600-550=50 un its
Difference in August =700-500=200 units
Difference in September =400-400=0 units
Difference in October =350-300=50 units
Diffference in November 500-200=300 units
In November it is largest
Topper's Solved these Questions
Similar Questions
सरल करें: 1+11+22+31+45
View SolutionA एक काम को 6 दिनों में तथा B उसी काम को 9 दिनों में कर सकता है दोनों मिलकर उस काम को कितने दिन में पूरा करेंगे ?
View SolutionHow many lines of symmetry does the above figure have ?
View SolutionWhich of the following are correct chain isomers of butane ? (i)
View SolutionDetermine the point of symmetry of a regular hexagon.
View SolutionDtermine the images of the following figure about the given line :
View SolutionMatch the following Column A to Column B

View SolutionMatch the following Column A to Column B

View SolutionMatch the following Column A to Column B

View SolutionThe inequation represented by the graph given below is :
View SolutionThe inequation that best describes the graph given below is _________
View SolutionThe inequation that best describes the following graph is _________
View SolutionWhich inequations represent the shaded region in the given figure
View Solutionनिम्नलिखित प्रश्नों में से किसी एक प्रश्न का उत्तर लगभग 90 शब्दों में लिखिए कवि बैरागी माँ से किस प्रकार के वरदान की अपेक्षा रखते हैं
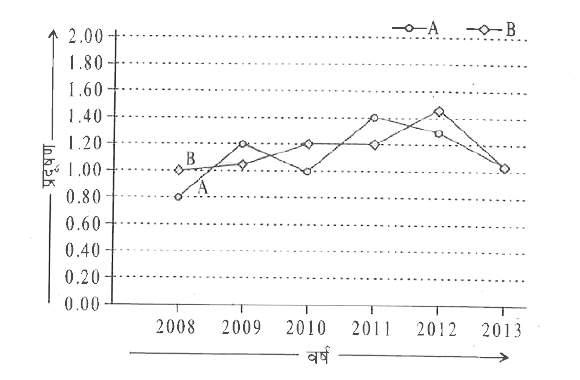
View Solutionनिचे दिये गये ग्राफ में दो प्रकार के वाहनों A व B के छ वर्षो के प्रदूषण का आंकड़ा दिया गया है ।A घरेलू वाहनों तथा B व्यावसायिक वाहनों को दर्शाता है ,तो ग्राफ का अध्ययन क्र आगे दिये गये प्रशनो के उत्तर दीजिए|
A का प्रदूषण किन -किन वर्षो में B के प्रदूषण से कम रहा है ?

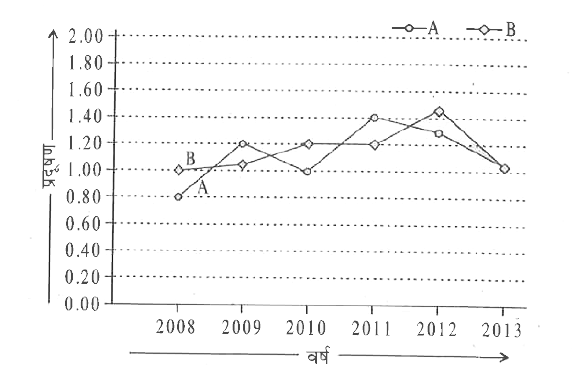
View Solutionनिचे दिये गये ग्राफ में दो प्रकार के वाहनों A व B के छ वर्षो के प्रदूषण का आंकड़ा दिया गया है ।A घरेलू वाहनों तथा B व्यावसायिक वाहनों को दर्शाता है ,तो ग्राफ का अध्ययन क्र आगे दिये गये प्रशनो के उत्तर दीजिए|
दिये गये वर्षो में से कितने वर्षो में B का प्रदूषण A के प्रदूषण से कम रहा है ?

View Solution
