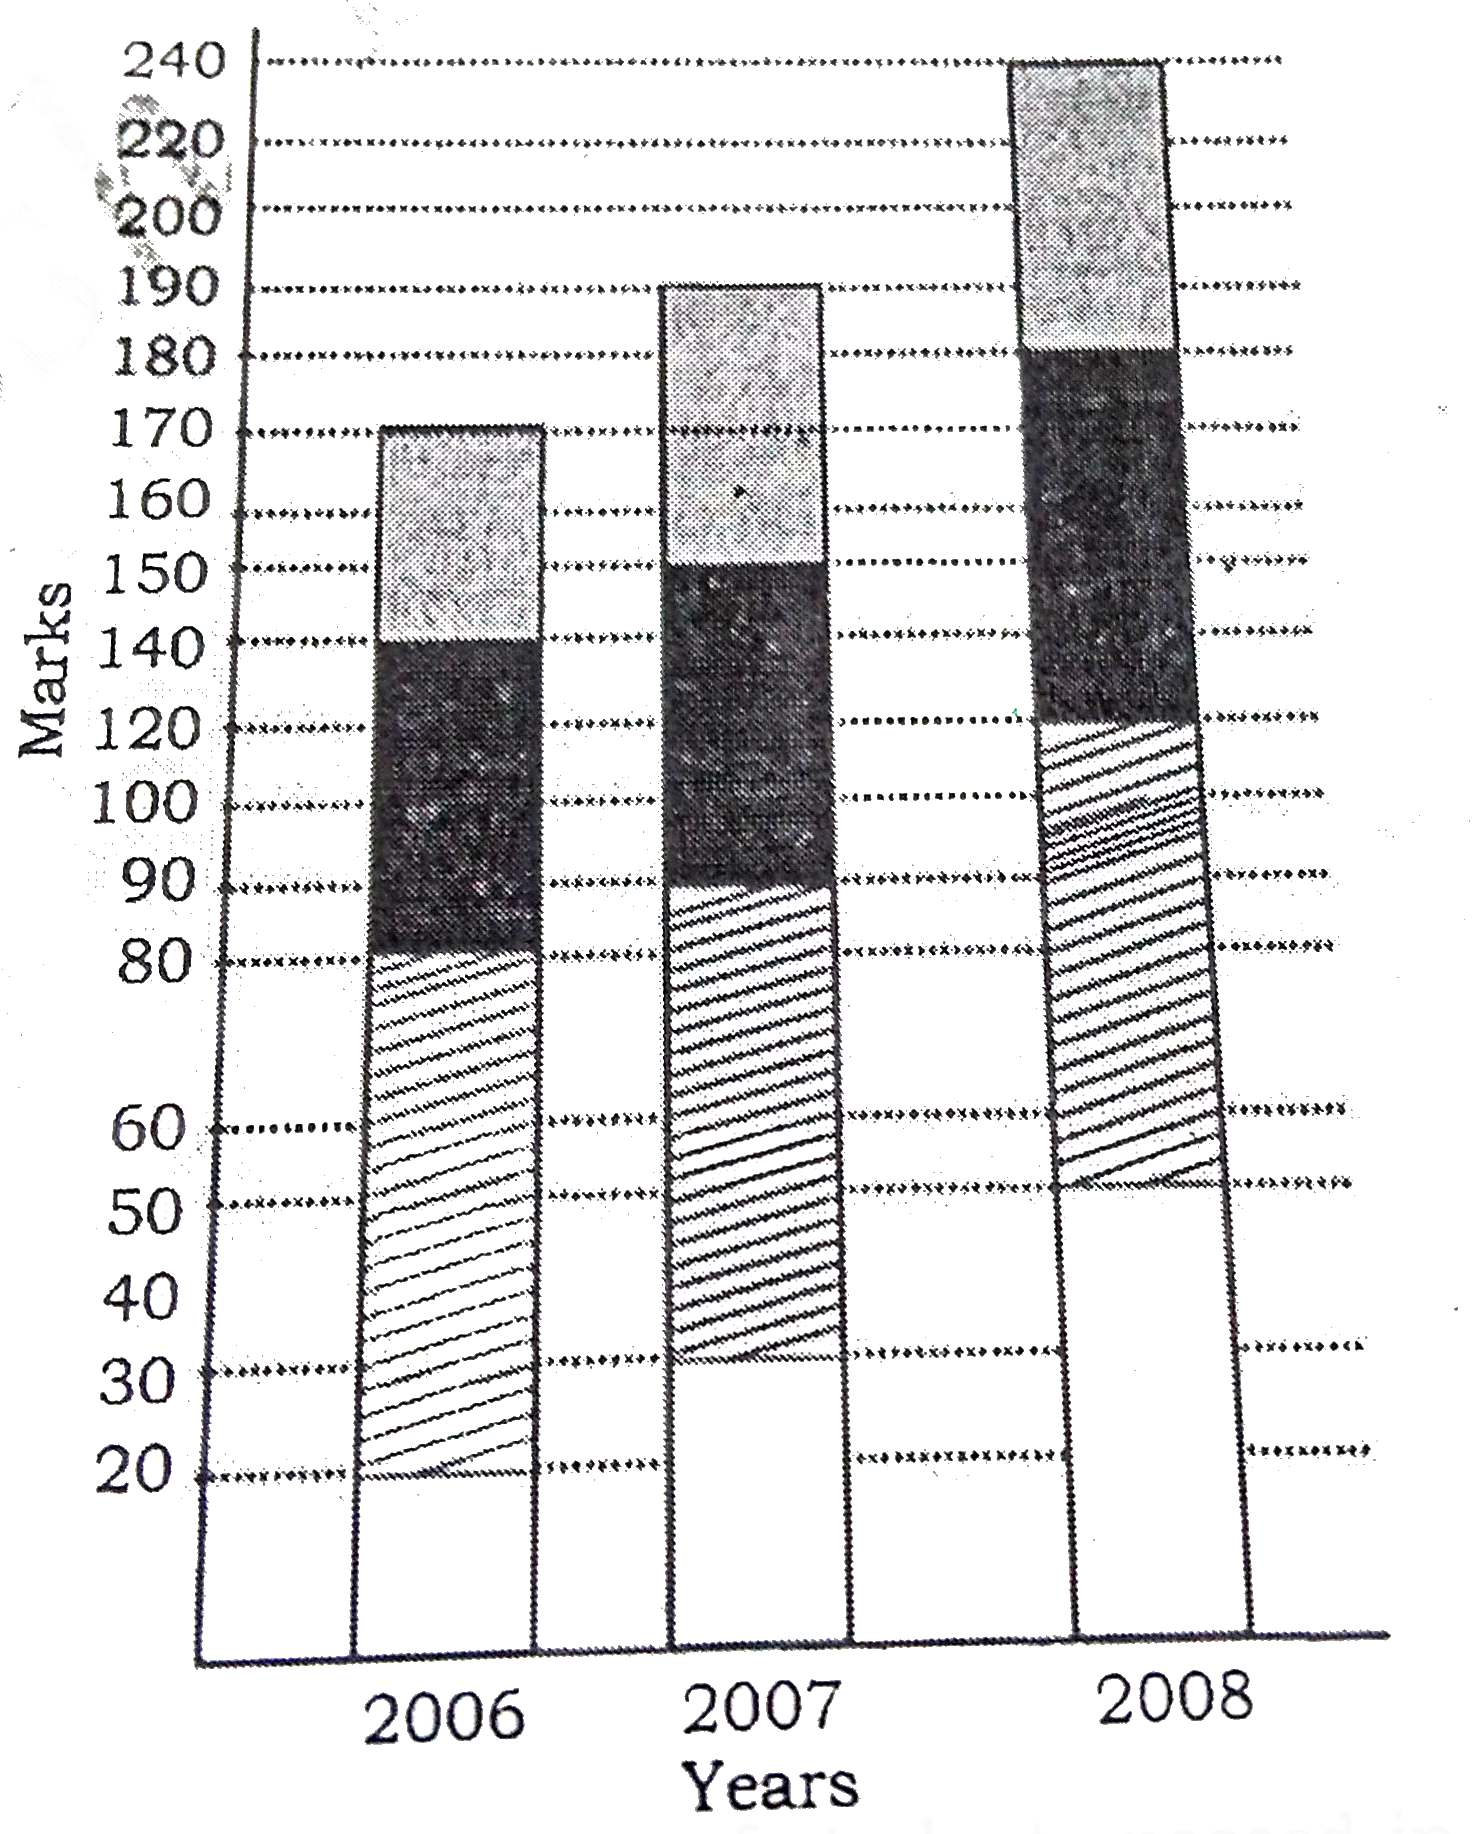
The subdivided bar diagram given below depicts the result of B com students of a college for 3 years Study the graph and answer the given questions

वर्ष 2008 में उत्तीर्ण छात्रो का % बताये ।
3313%
82617%
75%
78%
Total students in the year 2008=240
passed students =480
∴ Required percentage =180240×100=75%
Topper's Solved these Questions
Similar Questions
सरल करें: 1+11+22+31+45
View SolutionA एक काम को 6 दिनों में तथा B उसी काम को 9 दिनों में कर सकता है दोनों मिलकर उस काम को कितने दिन में पूरा करेंगे ?
View SolutionThe subdivided bar diagram given below depicts the result of B com students of a college for 3 years Study the graph and answer the given questions

वर्ष 2007 में प्रथम श्रेणी में पास होने वाले छात्रों का % बताये ।
View SolutionThe subdivided bar diagram given below depicts the result of B com students of a college for 3 years Study the graph and answer the given questions

किस वर्ष में वाणिज्य विषय का सर्वश्रेष्ठ परिणाम रहा ।
View SolutionDetermine the point of symmetry of a regular hexagon.
View SolutionDtermine the images of the following figure about the given line :
View SolutionMatch the following Column A to Column B

View SolutionMatch the following Column A to Column B

View SolutionMatch the following Column A to Column B

View SolutionFind the area of figure given below.

View SolutionFind the perimeter of the figure given below.

View SolutionFind the area of the figure given below.

View SolutionThe area of the shaded part in the figure given below is ______.

View SolutionThe inequation represented by the graph given below is :
View SolutionThe inequation that best describes the graph given below is _________
View Solution
