पिछले वित्त वर्ष में कार कम्पनी ने 41,800 कारे बेची। इस वर्ष 51,300 कारे बेचने का लक्ष्य है। बिक्री को कितना प्रतिशत बढ़ाना होगा ?
11922
8922
81123
22811
The correct Answer is:d
(d) Percentage Increase
=51300−4180041800×100
=950041800×100=6500418
=50022=25011=22811%
Topper's Solved these Questions
Similar Questions
रुपये 50,000 की पूंजी निवेश करके एक व्यापार शुरू करता है 3 माह के बाद B रुपये 70,000 निवेश कर उस व्यापार में शामिल हो जाता है ज्ञात करे वर्ष के अंत में उन्हें किस अनुपात में लाभ प्राप्त होगा
View Solutionदो पाइप A और B एक टैंक को क्रमश: 20 मिनट और 30 मिनट में भर सकते है । यदि दोनों पाइप एक साथ खोल दिए जाये तो टैंक को भरने में कितना समय लगेगा ?
View Solutionसमतल में गति से पिछले वर्ष आये हुए महत्वपूर्ण प्रश्न
View Solutionपिछले वर्ष के बोर्ड्स परीक्षाओ में वृत पर आधारित प्रश्न
View Solutionप्रश्नोत्तर पिछले वर्ष के
View SolutionThe following line diagram represents the yearly sales figure of a company in the years 2001-2010. Examine the diagram and answer the question. निम्नलिखित रेखा आरेख किसी कंपनी की वर्ष 2007-2010 के दौरान वार्षिक बिक्री के आंकड़ों को दर्शाता है। आरेख का अध्ययन करें और नीचे दिए गए प्रश्नों के उत्तर दें- The ratio of sales in 2002 to that in 2007 is वर्ष 2002 में बिक्री का वर्ष 2007 में बिक्री के साथ अनुपात है-
View SolutionThe following line diagram represents the yearly sales figure of a company in the years 2001-2010. Examine the diagram and answer the question. निम्नलिखित रेखा आरेख किसी कंपनी की वर्ष 2007-2010 के दौरान वार्षिक बिक्री के आंकड़ों को दर्शाता है। आरेख का अध्ययन करें और नीचे दिए गए प्रश्नों के उत्तर दें- The percentage increase in sales in the year 2005 with respect to the previous year is वर्ष 2005 में पिछले वर्ष की तुलना में बिक्री में वृद्धि का प्रतिशत है-
View SolutionThe following line diagram represents the yearly sales figure of a company in the years 2001-2010. Examine the diagram and answer the question. निम्नलिखित रेखा आरेख किसी कंपनी की वर्ष 2007-2010 के दौरान वार्षिक बिक्री के आंकड़ों को दर्शाता है। आरेख का अध्ययन करें और नीचे दिए गए प्रश्नों के उत्तर दें- ............................................................................................................................................. Total sales (in crore of Rs.) from 2005 to 2008 is वर्ष 2005 से वर्ष 2008 तक कुल बिक्री (रु. करोड में) है-
View SolutionThe ratio of income of A and B last year was 4:3, respectively. The ratios of their individual incomes of the last year and the present year are 3:4 and 5:6, respectively. If their total income for the present year is Rs. 8.04 lakh, then the income of B last year was :
पिछले वर्ष A और B की आय का अनुपात क्रमशः 4 : 3 था | पिछले वर्ष और इस वर्ष की उनकी आय का अनुपात क्रमशः 3 :4 और 5 : 6 है | यदि वर्तमान वर्ष के लिए उनकी कुल आय 8.04 लाख रुपये है, तो पिछले वर्ष B की आय कितनी थी ?
View SolutionIf the rate of interest is 20% per annum, compounded yearly and the interest on a certain sum in the second year is Rs250, then what will be the interest on the same sum in the fifth year ?
यदि ब्याज की दर प्रति वर्ष 20% है तथा चक्रवृद्धि वार्षिक है और किसी निश्चित राशि पर दूसरे वर्ष का ब्याज 250 रुपये है, तो पांचवें वर्ष में इस राशि पर ब्याज कितना होगा ?
View SolutionThe given Bar Graph presents the number of students of two schools for six years. दिया गया दंड आरेख छः वर्ष की अवधि में दो विद्यालयों में छात्रों की संख्या को दर्शाता है | In which year, the percentage increase in students in school B is the highest in comparison to its previous year? किस वर्ष में, विद्यालय B में छात्रों की संख्या में प्रतिशत वृद्धि इसके पिछले वर्ष की तुलना में सबसे अधिक रही है?
View SolutionThe given Bar Graph presents the number of students of two schools for six years. दिया गया दंड आरेख छः वर्ष की अवधि में दो विद्यालयों में छात्रों की संख्या को दर्शाता है | In which year, the percentage increase of students in school A is the highest in comparison to its previous year? किस वर्ष, विद्यालय A में छात्रों की संख्या में प्रतिशत वृद्धि पिछले वर्ष की तुलना में सर्वाधिक है ?
View SolutionThe following graph shows the sales of cars (in thousands) in four cities in 4 years. Study the graph and answer the questions.
निम्नलिखित आरेख 4 वर्षों में चार शहरों में कारों की बिक्री (हज़ार में) को दर्शाता है। इस आरेख का अध्ययन कीजिए तथा प्रश्नों के उत्तर दीजिए। Which city has the highest percentage of sales, and in which year?
किस शहर की बिक्री का प्रतिशत सबसे अधिक है तथा किस वर्ष में?
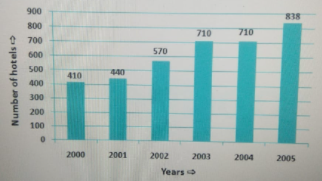
View SolutionStudy the chart and answer the questions:
In which of the given years is the percentage increase in the number of hotels in comparison to the previous year, is the maximum?
चार्ट का अध्ययन करें और प्रश्नों का उत्तर दें:पिछले वर्ष की तुलना में होटलों की संख्या में किस वर्ष में अधिकतम प्रतिशत वृद्धि हुई है?
View Solutionप्रथम 'तारसप्तक' का प्रकाशन वर्ष है
View Solutionनीचे दिया गया दण्ड आलेख वर्ष 1993 में एक परिवार की आय का विभिन्न मदों पर व्यय एवं बचत को दर्शाता है। आलेख का ध्यानपूर्वक अवलोकन कीजिए तथा उत्तर दीजिए: 1993 में व्यय की गयी पारिवारिक आय (प्रतिशत में) Percentage of expenditure on cloths is how much more than saving percentage ? कपड़े पर व्यय का प्रतिशत, बचत प्रतिशत से कितना अधिक है?
View Solution
