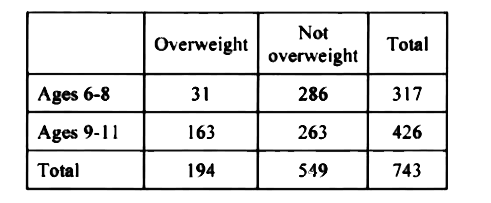
744 children from the United States, aged 6 through 11, were tested to see if they were overweight . The data are shown in the table below.

∗ According to the table, which of the following statements is most likely to be true about children between 6 and 11 years old, inclusive, in the United States ?
The probability that a 6-8 year old is overweight is greater than the probability that an overweight child aged 6-11 is less than 9 years old.
The probability that a 6-11 year old is overweight is greater than the probability that a 9-11 year old is not overweight.
The probability that an overweight 6-11 year old is at least 9 years old is greater than the probability that a 6-11 year old is not overweight.
The probability that a 6-8 year old is overweight is greater than the probability that a 9-11 year old is not overweight.
The correct Answer is:C
Step by step video, text & image solution for 744 children from the United States, aged 6 through 11, were tested to see if they were overweight . The data are shown in the table below. ** According to the table, which of the following statements is most likely to be true about children between 6 and 11 years old, inclusive, in the United States ? by Maths experts to help you in doubts & scoring excellent marks in Class 12 exams.
Updated on:21/07/2023Similar Questions
743 children from the United States, aged 6 through 11, were tested to see if they were overweight . The data are shown in the table below.

In 2014 the total population of children between 6 and 11 years old, inclusive , in the United States was about 74.3 million. If the test results are used to estimate information about children across the country, which of the following is the best estimate of the total number of children between 9 and 11 years old in the United States who were overweight in 2014 ?
View Solution743 children from the United States, aged 6 through 11, were tested to see if they were overweight . The data are shown in the table below.

Based on the data, how many times more likely is it for a 6, 7, or 8 - year - old to NOT be overweight than it is for a 9, 10, or 11 - year - old to NOT be overweight? (Round the answer to the nearest tenth.)
View Solution
Knowledge Check
A survey was conducted among a randomly chosen sample of 250 single men and 250 single women about whether they owned any dogs or cats. The table below displays a summary of the survey results.

According to the table, which of the following statements is most likely to be false?AThe porability that a woman is a cat owner is greater than the probability that a cat owner is a womanBThe probability that a dog owner is male is greater than the probability that a randomly chosen person is a cat owner.CThe probability that a woman does not own a dog or cat is greater than the probability that a man owns at least one dog and one cat.DThe probability that a cat owner is a woman is greater than the probability that a men owns a dog.The Harrisburg Recreation Center recently changed its hours to open 1 hour later and close 3 hours later than it had previously. Residents of Harrisburg age 16 or older were given a survey and 560 residents replied. The survey asked each resident his or her student status (high school, college, or nonstudent) and what he or she thought about the change in hour (approve, disapprove, or no opinion). The results are summarized in the table below.

Suppose a person will be chosen at random from these 560 residents. Which of the following values is closest to the probability that the person chosen will NOT be a high student and will NOT have replied with no opinion?A0.06B0.09C0.44D0.83One September night a family had gathered round their hearth, and piled it high with the driftwood of mountain streams, the dry cones of the pine, and the splintered ruins of great trees that had come crashing down the precipice. Up the chimney roared the fire, and brightened the room with its broad blaze. The faces of the father and mother had a sober gladness, the children laughed, the eldest daughter was the image of Happiness at seventeen, and the aged grandmother, who sat knitting in the warmest place, was the image of Happiness grown old. They had found the "herb, heart's-ease," in the bleakest spot of all New England. This family were situated in the Notch of the White Hills, where the wind was sharp throughout the year, and pitilessly cold in the winter - giving their cottage all its fresh inclemency before it descended on the valley of the Saco. They dwelt in a cold spot and a dangerous one, for a mountain towered above their heads, so steep, that the stones would often rumble down its sides and startle them at midnight.
The daughter had just uttered some simple jest that filled them all with mirth, when the wind came through the Notch and seemed to pause before their cottage - rattling the door, with a sound of wailing and lamentation, before it passed into the valley. For a moment it saddened them, though there was nothing unusual in the tones. But the family were glad again when they perceived that the latch was lifted by some traveller, whose footsteps had been unheard amid the dreary blast which heralded his approach, and wailed as he was entering, and went moaning away from the door.
Though they dwelt in such a solitude, these people held daily converse with the world. The romantic pass of the Notch is a great artery, through which the life-blood of internal commerce is continually throbbing between Maine, on one side, and the Green Mountains and the shores of the St. Lawrence, on the other. The stage-coach always drew up before the door of the cottage. The way-farer, with no companion but his staff, paused here to exchange a word, that the sense of loneliness might not utterly overcome him ere he could pass through the cleft of the mountain, or reach the first house in the valley. And here the teamster, on his way to Portland market, would put up for the night, and, if a bachelor, might sit an hour beyond the usual bedtime, and steal a kiss from the mountain maid at parting. It was one of those primitive taverns where the traveller pays only for food and lodging, but meets with a homely kindness beyond all price. When the footsteps were heard, therefore, between the outer door and the inner one, the whole family rose up, grandmother, children, and all, as if about to welcome someone who belonged to them, and whose fate was linked with theirs.
The door was opened by a young man. His face at first wore the melancholy expression, almost despondency, of one who travels a wild and bleak road, at nightfall and alone, but soon brightened up when he saw the kindly warmth of his reception. He felt his heart spring forward to meet them all, from the old woman, who wiped a chair with her apron, to the little child that held out its arms to him. One glance and smile placed the stranger on a footing of innocent familiarity with the eldest daughter. "Ah, this fire is the right thing!" cried he, "especially when there is such a pleasant circle round it. I am quite benumbed, for the Notch is just like the pipe of a great pair of bellows, it has blown a terrible blast in my face all the way from Bartlett.
"Then you are going towards Vermont?" said the master of the house, as he helped to take a light knapsack off the young man's shoulders.
"Yes, to Burlington, and far enough beyond," replied he. "I meant to have been at Ethan Crawford's tonight, but a pedestrian lingers along such a road as this. It is no matter, for, when I saw this good fire, and all your cheerful faces, I felt as if you had kindled it on purpose for me, and were waiting my arrival. So I shall sit down among you, and make myself at home."
The frank-hearted stranger had just drawn his chair to the fire when something like a heavy footstep was heard without, rushing down the steep side of the mountain, as with long and rapid strides, and taking such a leap in passing the cottage as to strike the opposite precipice. The family held their breath, because they knew the sound, and their guest held his by instinct.
"The old mountain has thrown a stone at us, for fear we should forget him," said the landlord, recovering himself. "He sometimes nods his head and threatens to come down, but we are old neighbours, and agree together pretty well upon the whole. Besides we have a sure place of refuge hard by if he should be coming in good earnest."
[From, The Ambitious Guest, Nathaniel Hawthorne]
For each word given below choose the correct meaning (as used in the passage) from the options provided:
instinct :AreasonBan innate, typically fixed pattern of behaviour in animals in response to certain stimuli.CknowledgeDnone of these
Each month. The Bureau of Labor Statistics conducts a survey called the Current Population Survey (CPS) to measure unemployement in the United States. Across the country, about 60,000 households are included in the survey sample. These households are grouped by geographic region. A summery of the January 2014 survey results for make responds in one geographica region is shown in the table below.

Q. According to data in the table, for which age group did the smallest percentage of men report that they were unemployed in January 2014?
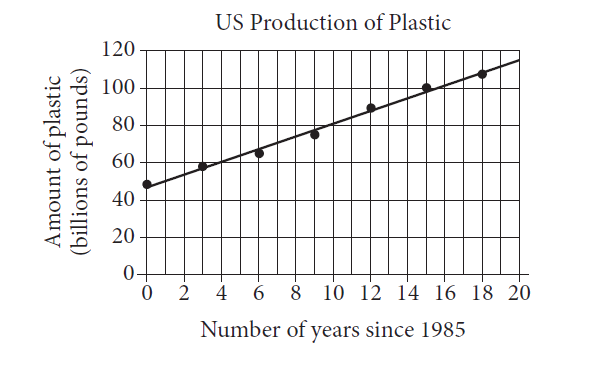
View SolutionBetween 1985 and 2003, data were collected every three years on the amount of plastic produced annually in the United States, in billions of pounds. The graph below shows the data and a line of best fit. The equation of the line of best fit is y = 3.39x + 46.89, where x is the number of years since 1985 and y is the amount of plastic produced annually, in billions of pounds.

Which of the following is closest to the percent increase in the billions of pounds of plastic produced in the United States from 2000 to 2003?
View SolutionOne September night a family had gathered round their hearth, and piled it high with the driftwood of mountain streams, the dry cones of the pine, and the splintered ruins of great trees that had come crashing down the precipice. Up the chimney roared the fire, and brightened the room with its broad blaze. The faces of the father and mother had a sober gladness, the children laughed, the eldest daughter was the image of Happiness at seventeen, and the aged grandmother, who sat knitting in the warmest place, was the image of Happiness grown old. They had found the "herb, heart's-ease," in the bleakest spot of all New England. This family were situated in the Notch of the White Hills, where the wind was sharp throughout the year, and pitilessly cold in the winter - giving their cottage all its fresh inclemency before it descended on the valley of the Saco. They dwelt in a cold spot and a dangerous one, for a mountain towered above their heads, so steep, that the stones would often rumble down its sides and startle them at midnight.
The daughter had just uttered some simple jest that filled them all with mirth, when the wind came through the Notch and seemed to pause before their cottage - rattling the door, with a sound of wailing and lamentation, before it passed into the valley. For a moment it saddened them, though there was nothing unusual in the tones. But the family were glad again when they perceived that the latch was lifted by some traveller, whose footsteps had been unheard amid the dreary blast which heralded his approach, and wailed as he was entering, and went moaning away from the door.
Though they dwelt in such a solitude, these people held daily converse with the world. The romantic pass of the Notch is a great artery, through which the life-blood of internal commerce is continually throbbing between Maine, on one side, and the Green Mountains and the shores of the St. Lawrence, on the other. The stage-coach always drew up before the door of the cottage. The way-farer, with no companion but his staff, paused here to exchange a word, that the sense of loneliness might not utterly overcome him ere he could pass through the cleft of the mountain, or reach the first house in the valley. And here the teamster, on his way to Portland market, would put up for the night, and, if a bachelor, might sit an hour beyond the usual bedtime, and steal a kiss from the mountain maid at parting. It was one of those primitive taverns where the traveller pays only for food and lodging, but meets with a homely kindness beyond all price. When the footsteps were heard, therefore, between the outer door and the inner one, the whole family rose up, grandmother, children, and all, as if about to welcome someone who belonged to them, and whose fate was linked with theirs.
The door was opened by a young man. His face at first wore the melancholy expression, almost despondency, of one who travels a wild and bleak road, at nightfall and alone, but soon brightened up when he saw the kindly warmth of his reception. He felt his heart spring forward to meet them all, from the old woman, who wiped a chair with her apron, to the little child that held out its arms to him. One glance and smile placed the stranger on a footing of innocent familiarity with the eldest daughter. "Ah, this fire is the right thing!" cried he, "especially when there is such a pleasant circle round it. I am quite benumbed, for the Notch is just like the pipe of a great pair of bellows, it has blown a terrible blast in my face all the way from Bartlett.
"Then you are going towards Vermont?" said the master of the house, as he helped to take a light knapsack off the young man's shoulders.
"Yes, to Burlington, and far enough beyond," replied he. "I meant to have been at Ethan Crawford's tonight, but a pedestrian lingers along such a road as this. It is no matter, for, when I saw this good fire, and all your cheerful faces, I felt as if you had kindled it on purpose for me, and were waiting my arrival. So I shall sit down among you, and make myself at home."
The frank-hearted stranger had just drawn his chair to the fire when something like a heavy footstep was heard without, rushing down the steep side of the mountain, as with long and rapid strides, and taking such a leap in passing the cottage as to strike the opposite precipice. The family held their breath, because they knew the sound, and their guest held his by instinct.
"The old mountain has thrown a stone at us, for fear we should forget him," said the landlord, recovering himself. "He sometimes nods his head and threatens to come down, but we are old neighbours, and agree together pretty well upon the whole. Besides we have a sure place of refuge hard by if he should be coming in good earnest."
[From, The Ambitious Guest, Nathaniel Hawthorne]
For each word given below choose the correct meaning (as used in the passage) from the options provided:
ambitious :
View Solution2500 single men and 2500 single women were asked about whether they owned any dogs or cats. The table below displays a summery of the results.

Of the people who said they had neigher dogs nor cats, 200 were selected at random, and they were asked if they had any pets at all. 43 people said they did have pets,and the remaining 157 said that they did not. Based on both the initial data given in the table, together with the new data stated in this paragraph, which of the following is most likely to be accurate?
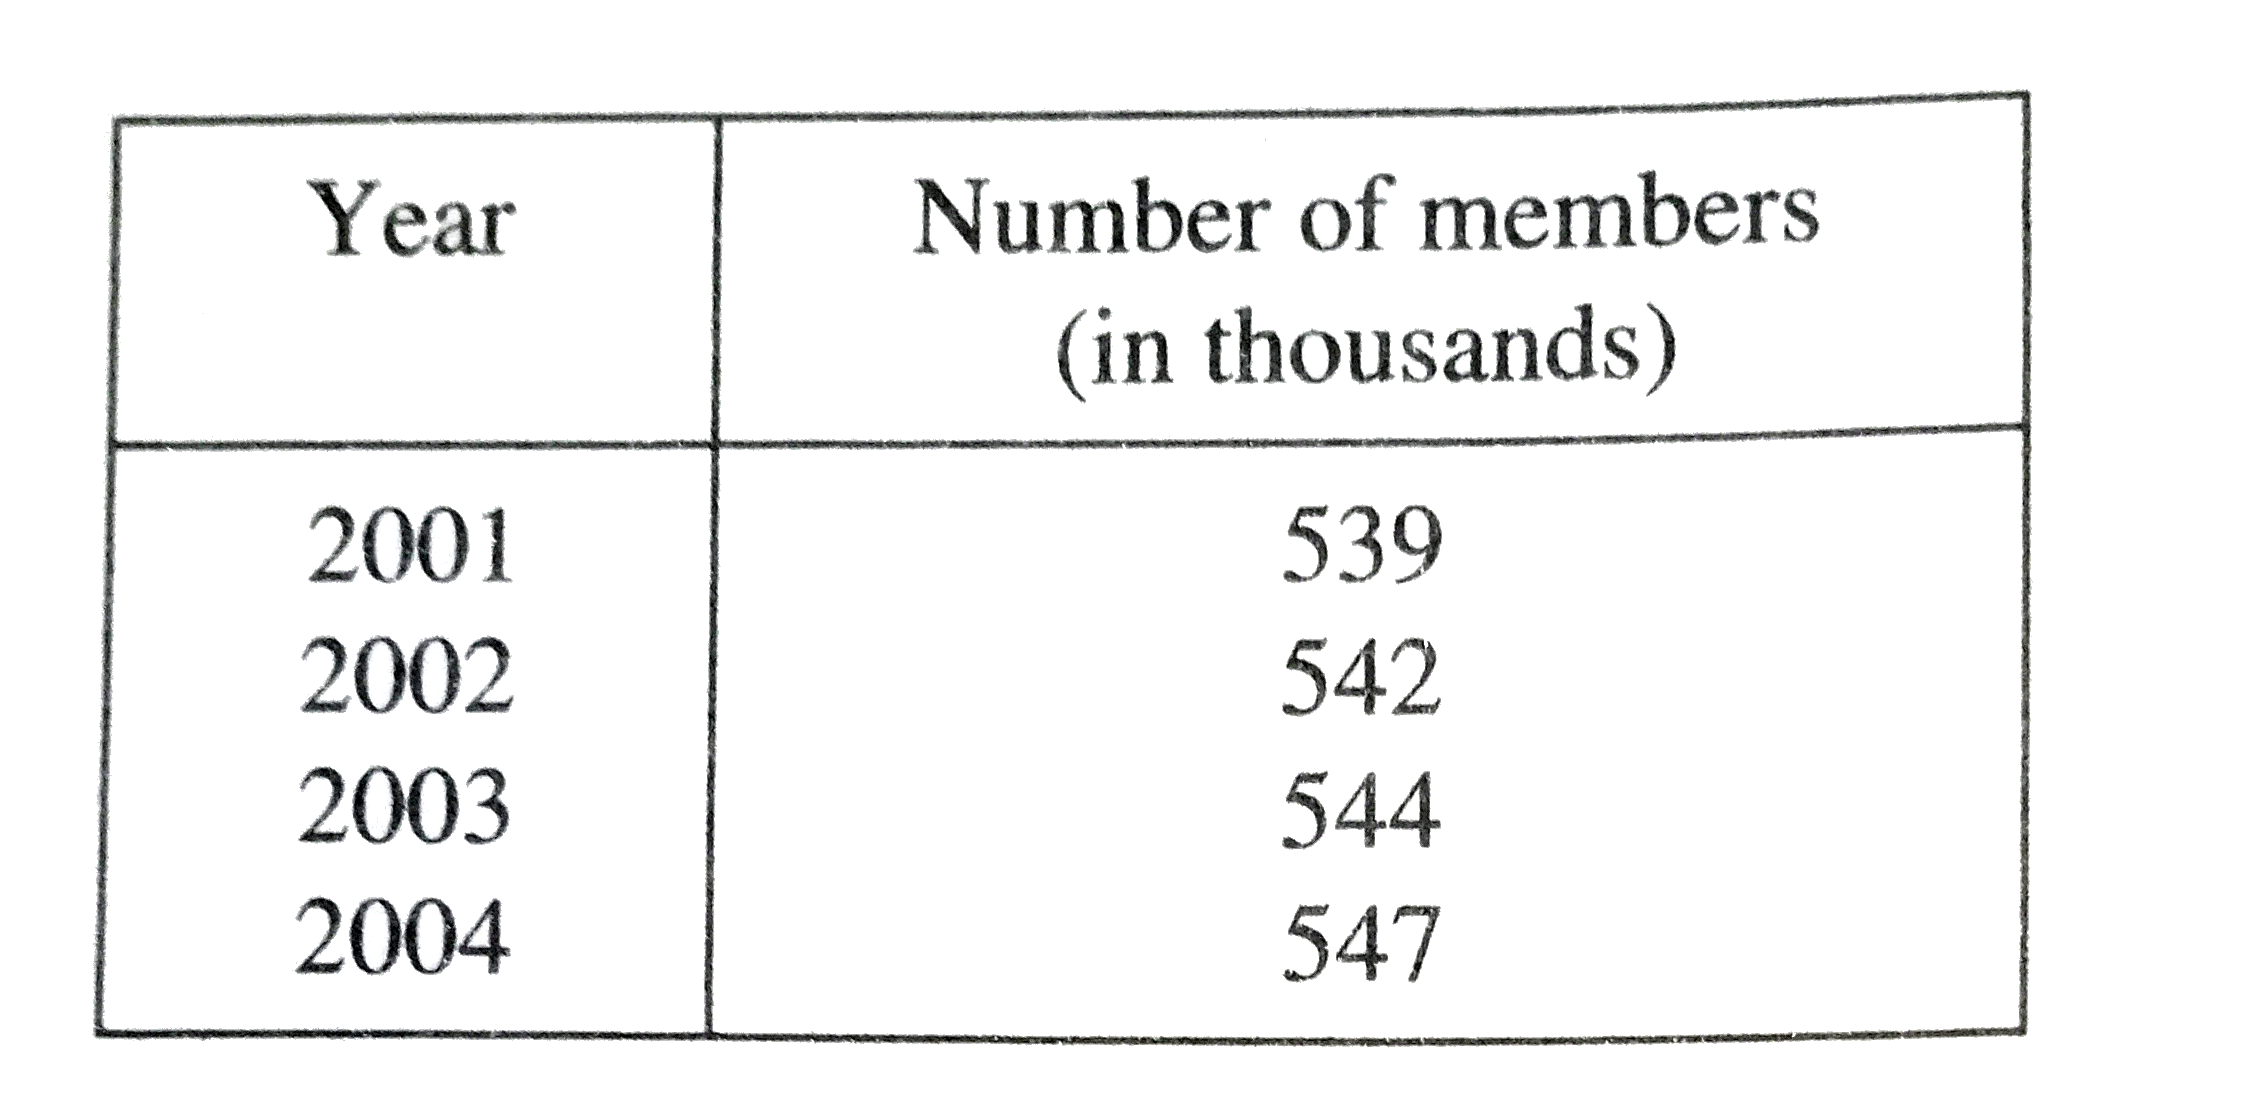
View SolutionThe table below lists the number (to the nearest 1,000) of book club members in the United States for 2001 through 2004. of the following expressions with x representing the number of years after 2001, which best models the number of book club members (in thousands) in the United States ?

View Solution
