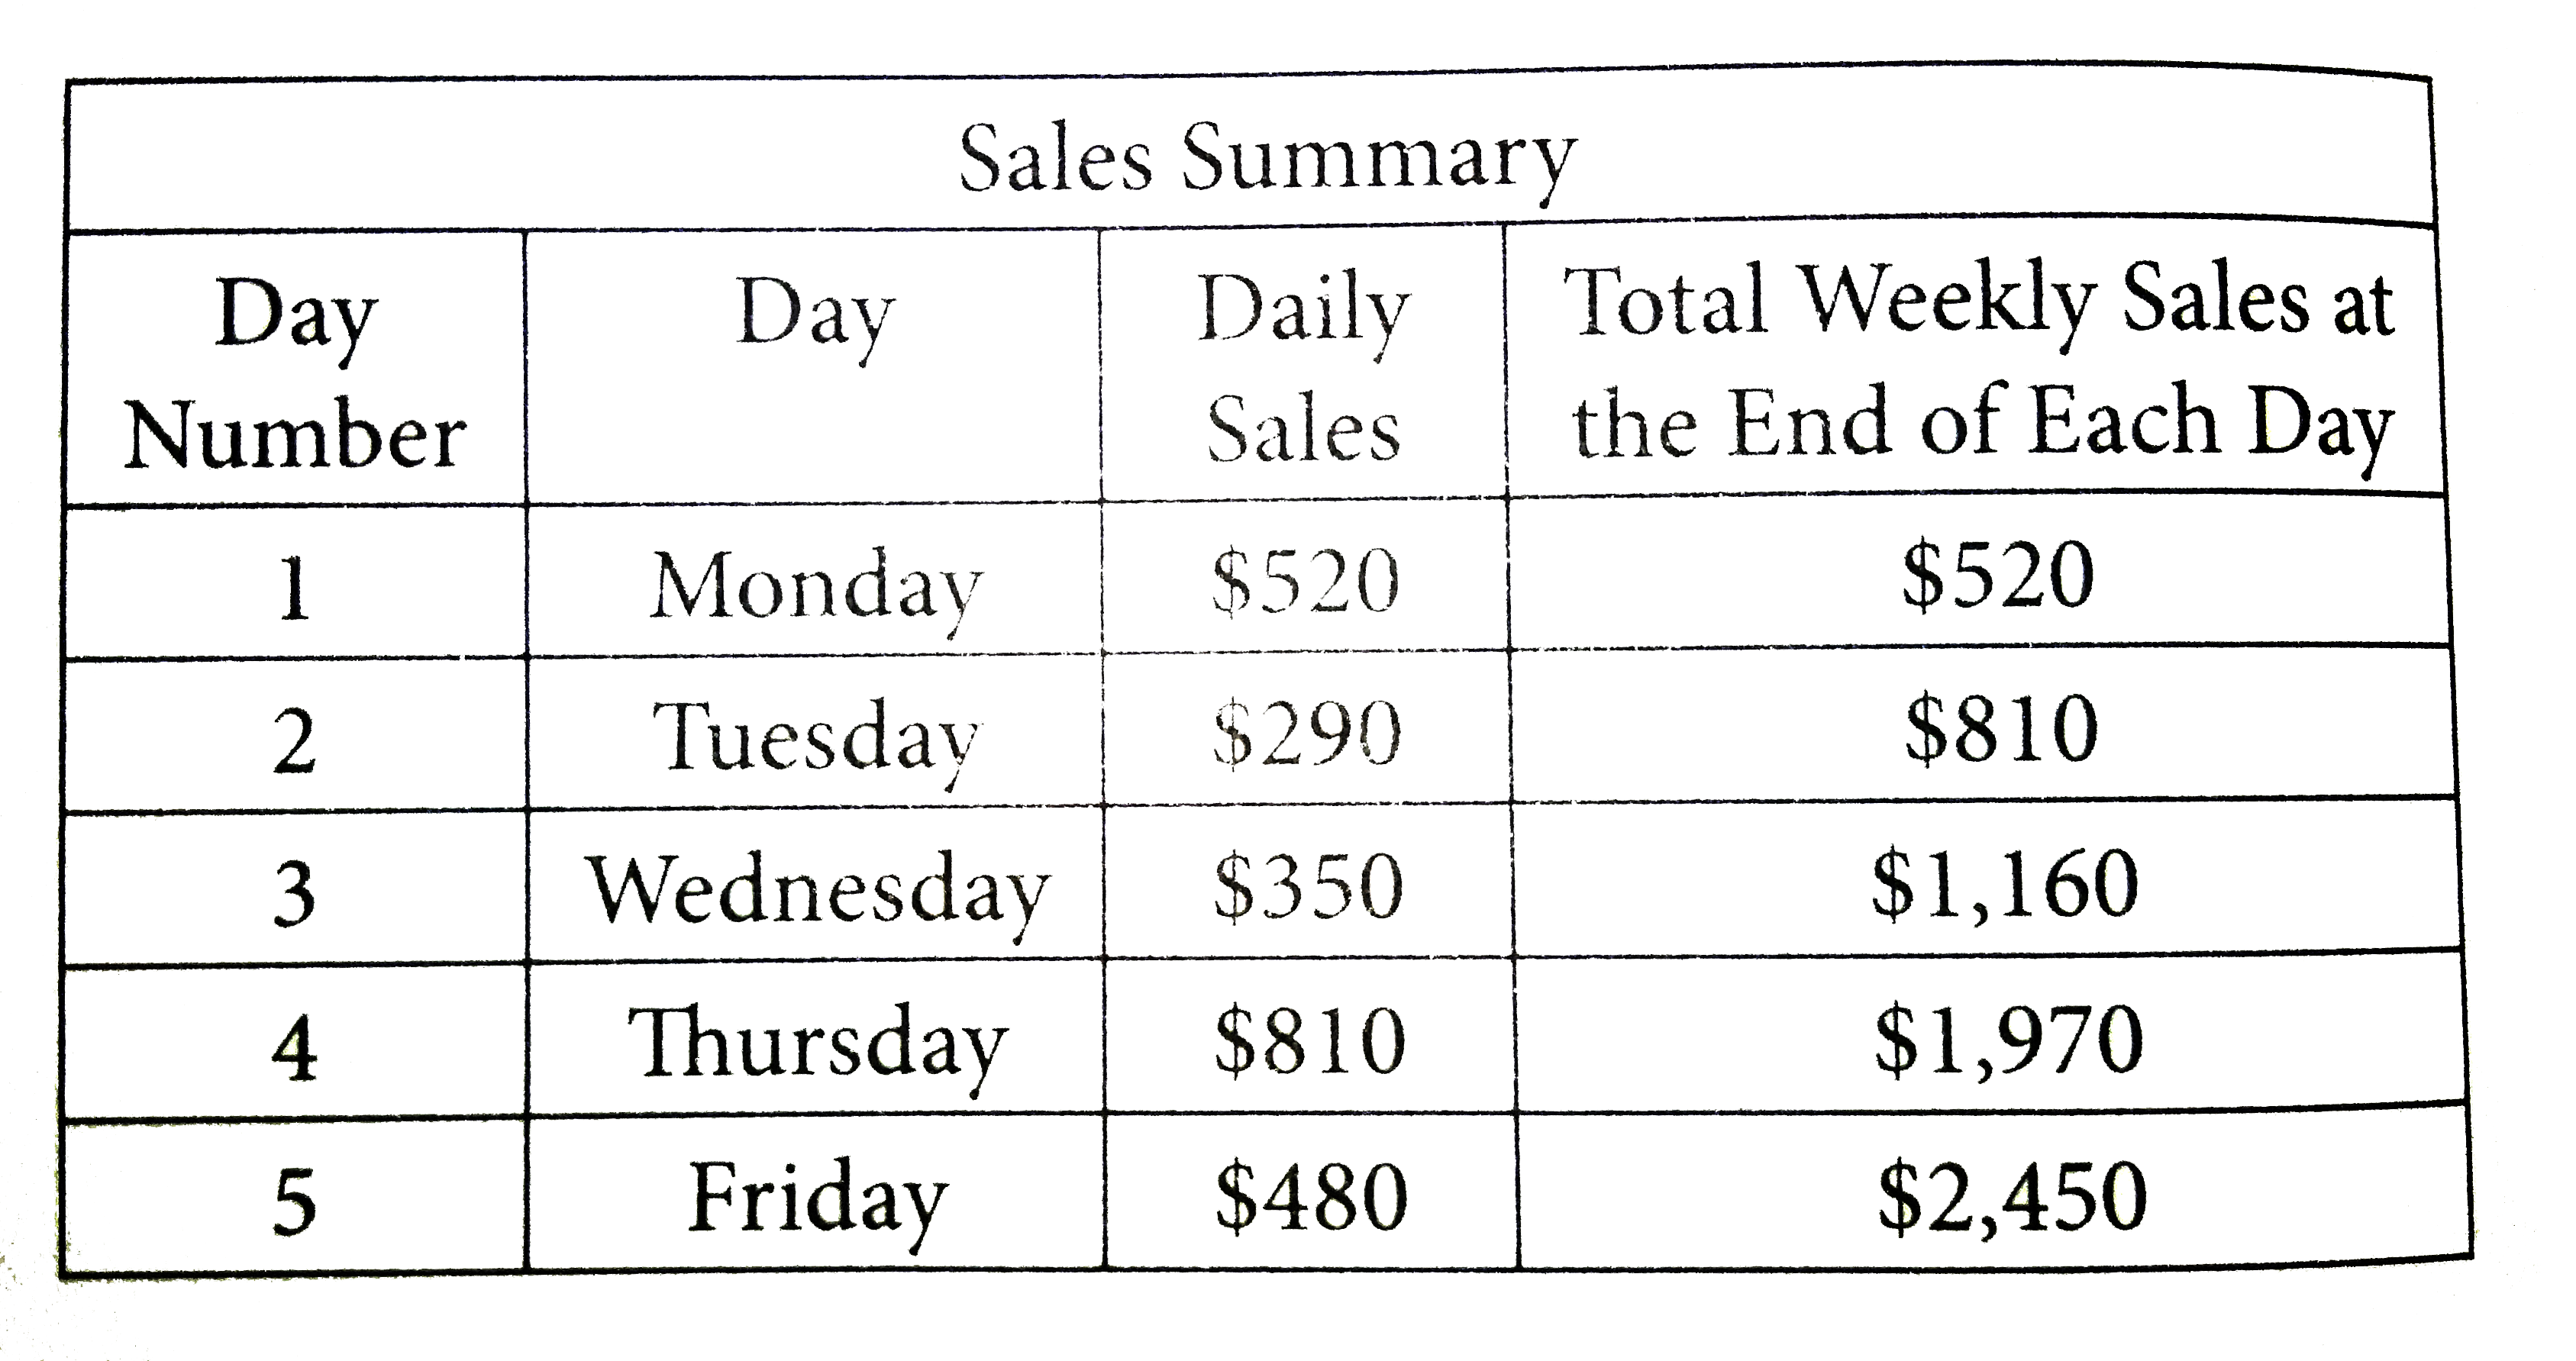
A salesperson recorded her sales during a particular 5-day work week, shown in the table above, in order to study her daily sales.
The salesperson wants to increase her averages sales per day by 20% in the following week. Given the information in the chart above, what should her daily sales average be for the following week?
The correct Answer is:588
Step by step video, text & image solution for A salesperson recorded her sales during a particular 5-day work week, shown in the table above, in order to study her daily sales. The salesperson wants to increase her averages sales per day by 20% in the following week. Given the information in the chart above, what should her daily sales average be for the following week? by Maths experts to help you in doubts & scoring excellent marks in Class 12 exams.
Updated on:21/07/2023Topper's Solved these Questions
Similar Questions
IF the function g is defined by g(x)=3x+5, what is the value of g(-5)?
View SolutionA certain homeowner uses a gas edger to clean up his lawn every time he mows. If the edger uses 160 milliliters of fuel each time, what is the maximum number of times the homeowner can edge his lawn with 8 litres of fuel?( 1 liter = 1,000 milliliters)
View SolutionThe population ,P, of town Y since 1995 can be estimated by the equation P=1.0635x+3,250, where x is the number of years since 1995 and 0≤x≤20. In the context of this equation, what does the number 1.0635 most likely represent?
View SolutionSalesperson A’s compensation for any week is Rs 360 plus 6 percent of the portion of A’s total sales above Rs. 1000 for that week. Salesperson B’s compensation for any week is 8 percent of B’s total sales for that week. For what amount of total weekly sales would both sales persons earn the same compensation?
View Solutionइलेक्ट्रोनिक सामान की दुकान सोमवार को बंद रहती है। सप्ताह के शेष 6 दिनों की औसत प्रतिदिन ब्रिकी रूपये 15640 है और मंगलवार से शनिवार की औसत बिक्री रूपये 14124 है। रविवार की बिक्री है।
View SolutionHow many lines of symmetry does the above figure have ?
View SolutionMatch the following Column A to Column B

View SolutionThe inequation represented by the graph given below is :
View SolutionThe inequation that best describes the graph given below is _________
View SolutionThe inequation that best describes the following graph is _________
View Solutionएक आटा मिल के प्रतिदिन के आटा की बिक्री का विवरण निम्नांकित है :

आटा मिल का प्रतिदिन का आटा का औसत बिक्री ज्ञात करें।
View Solutionएक विशेष सप्ताह के लिए एक दुकान से शुगर की प्रतिदिन बिक्री नीचे दी गयी है:
75 किग्रा, 120 किग्रा, 12 किग्रा, 50 किग्रा, 70.5 किग्रा, 140.5 किग्रा
शुगर की प्रतिदिन बिक्री का औसत ज्ञात कीजिए।
View Solution
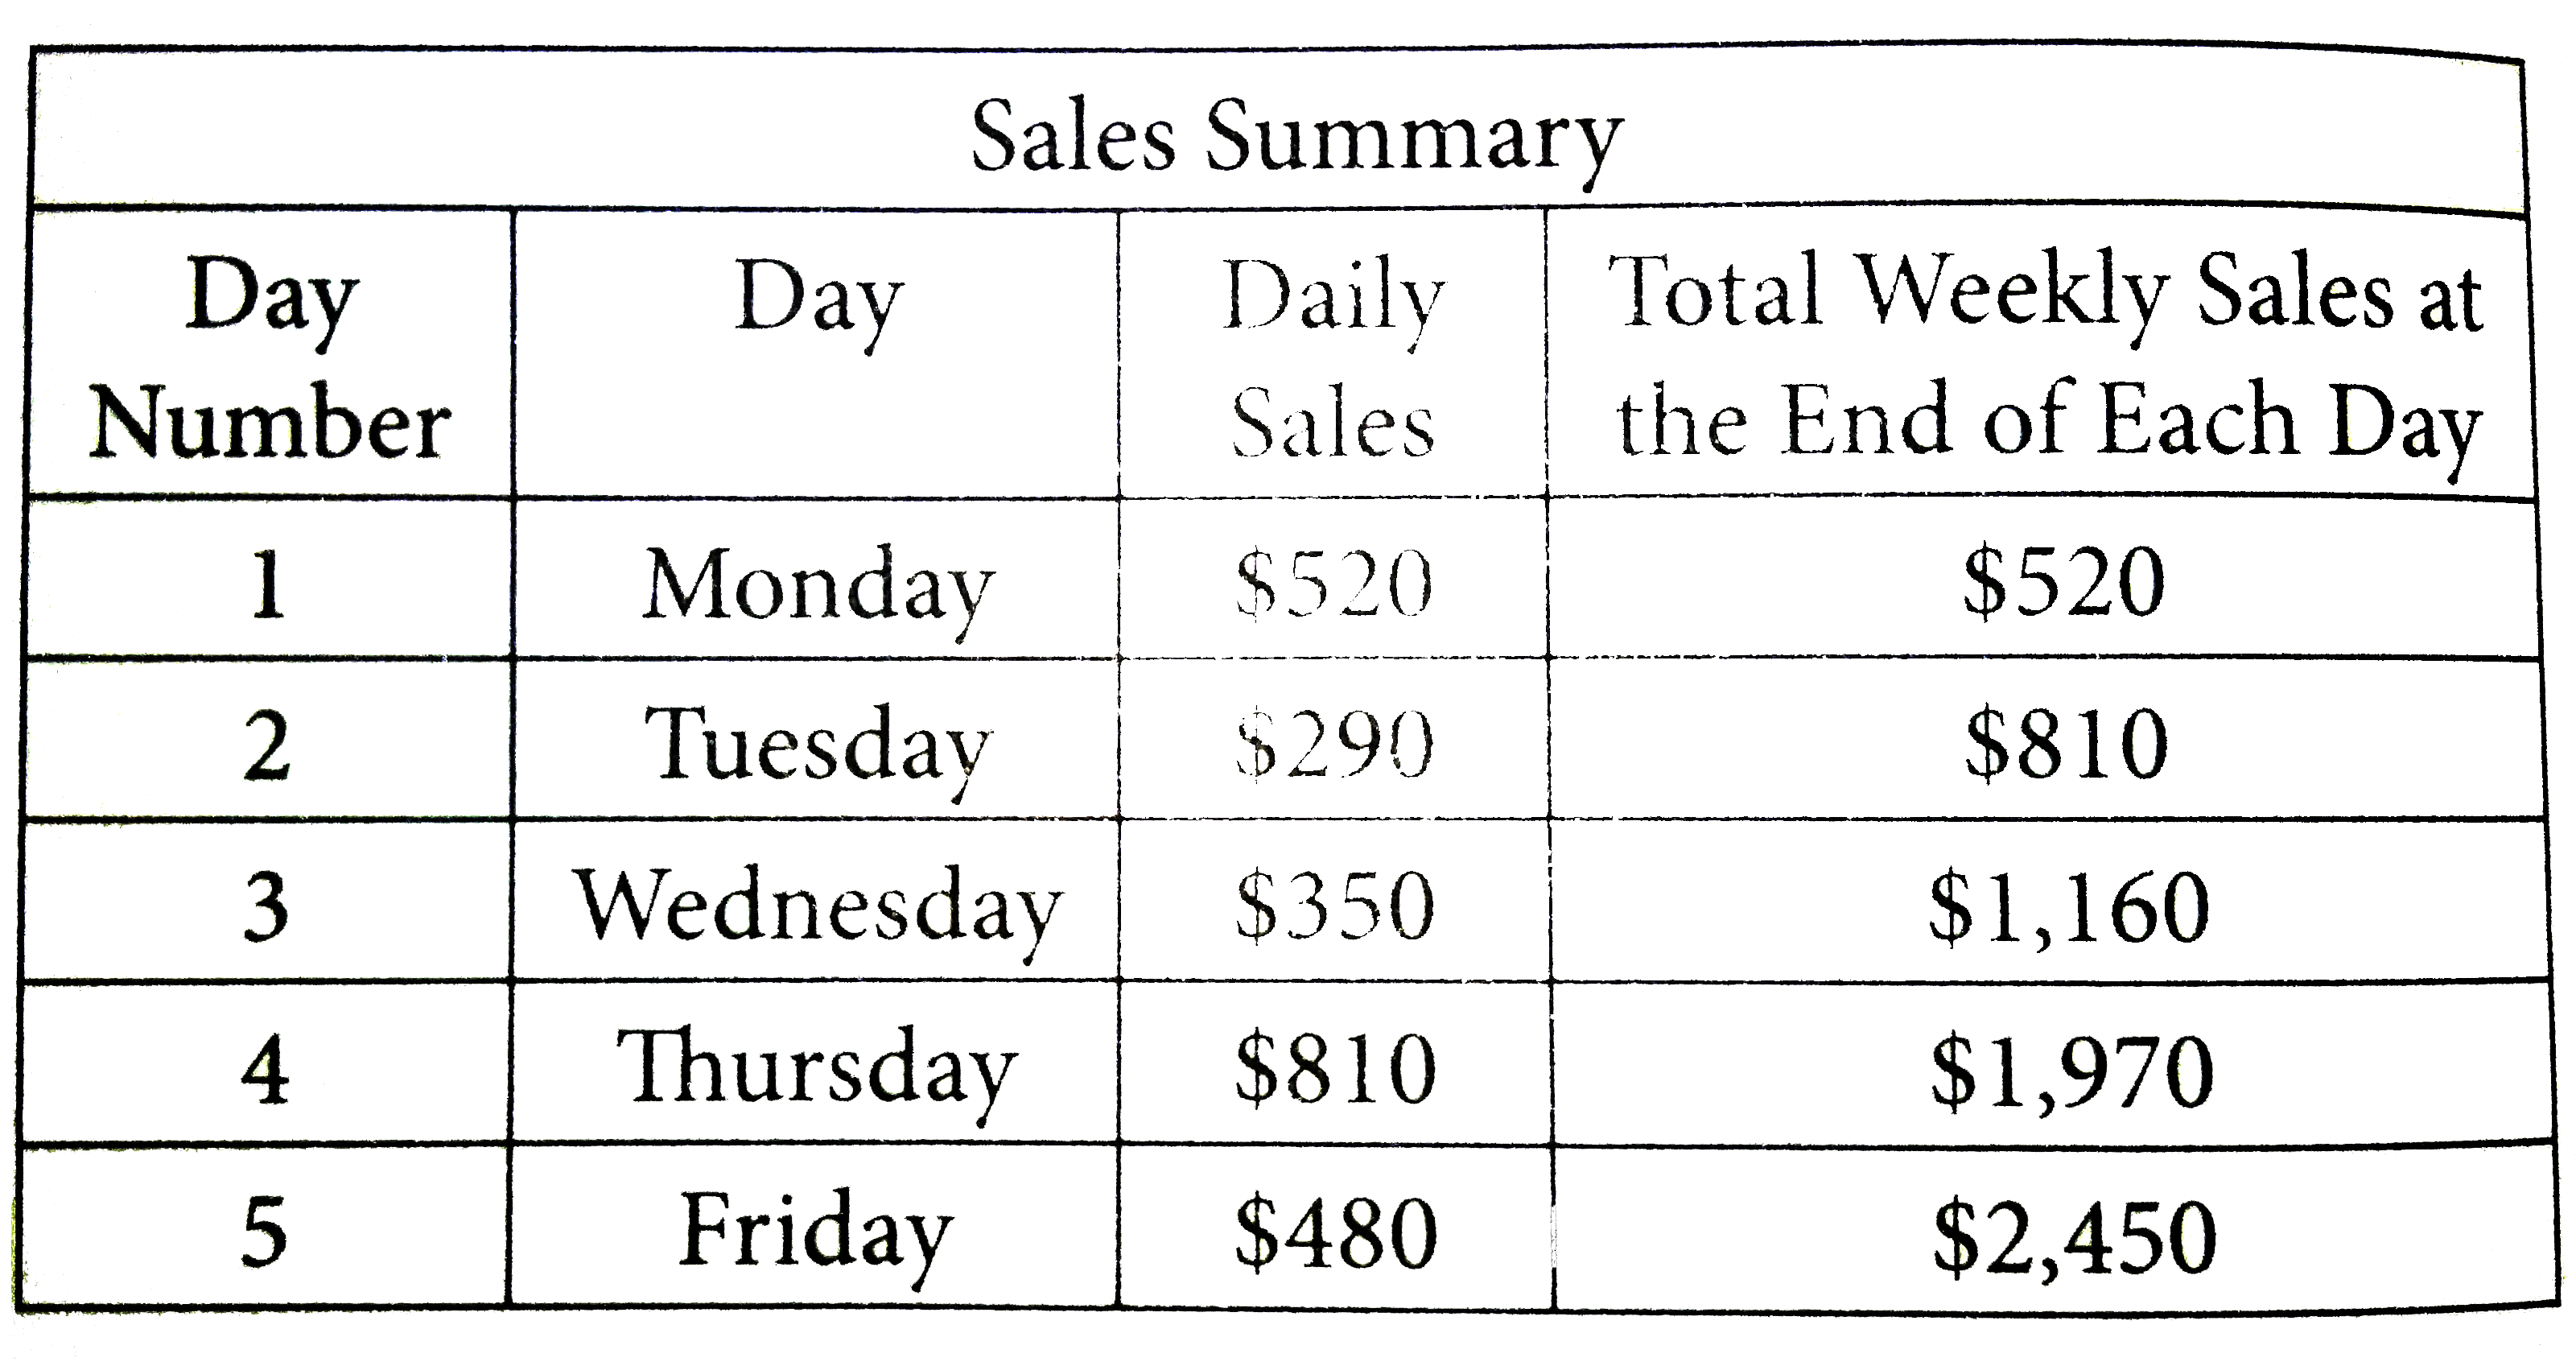
A salesperson recorded her sales during a particular 5-day work week, shown in the table above, in order to study her daily sales.
During her eight-hour shift on Wednesday, the salesperson sold items that had an average price of $8.10. To the nearest tenth of an item, what is the number of items she sold per hour on Wednesday?
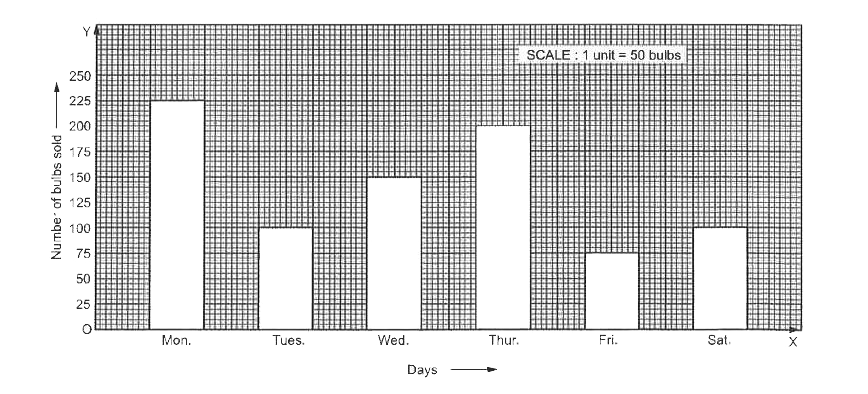
View SolutionGiven below is a graph showing the number of electric bulbs sold in a shop during a week
Read the bar graph carefully and answer the following questions
(i) On which day of the week was the sale minimum?
(ii) On which day of the week was the sale maximum
(iiI) What was the total sale during the week
(lv) What is the ratio between the minimum sale and the maximum sale

View SolutionThe daily sales of kerosene (in litres) in a ration shop for six days is given. 75, 120, 12, 50, 70.5, 140.5 What is the average daily sale?
View Solution
