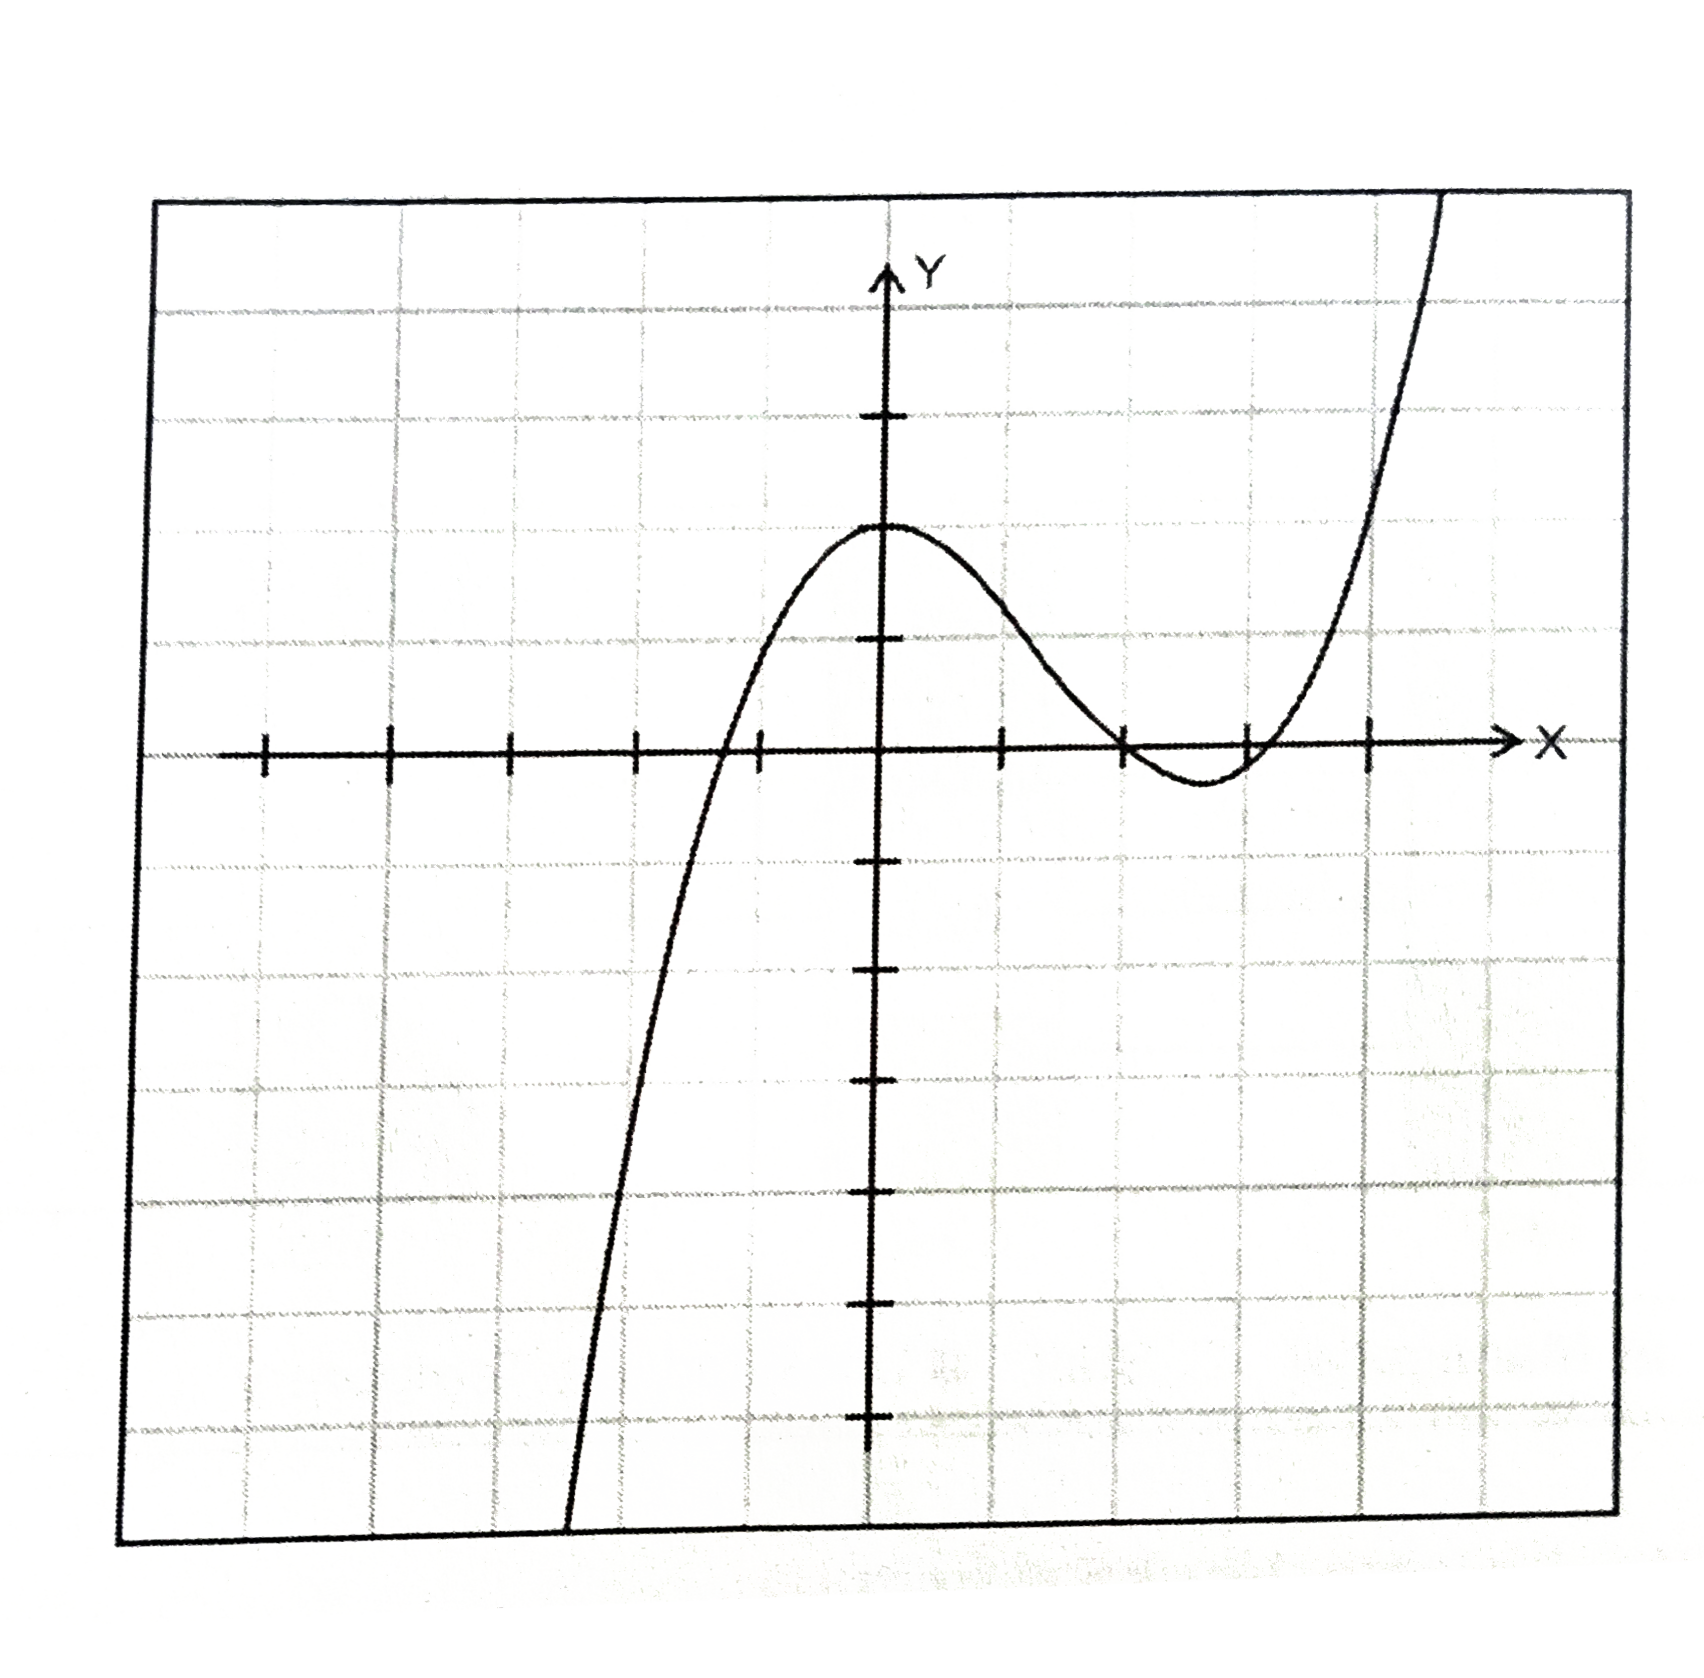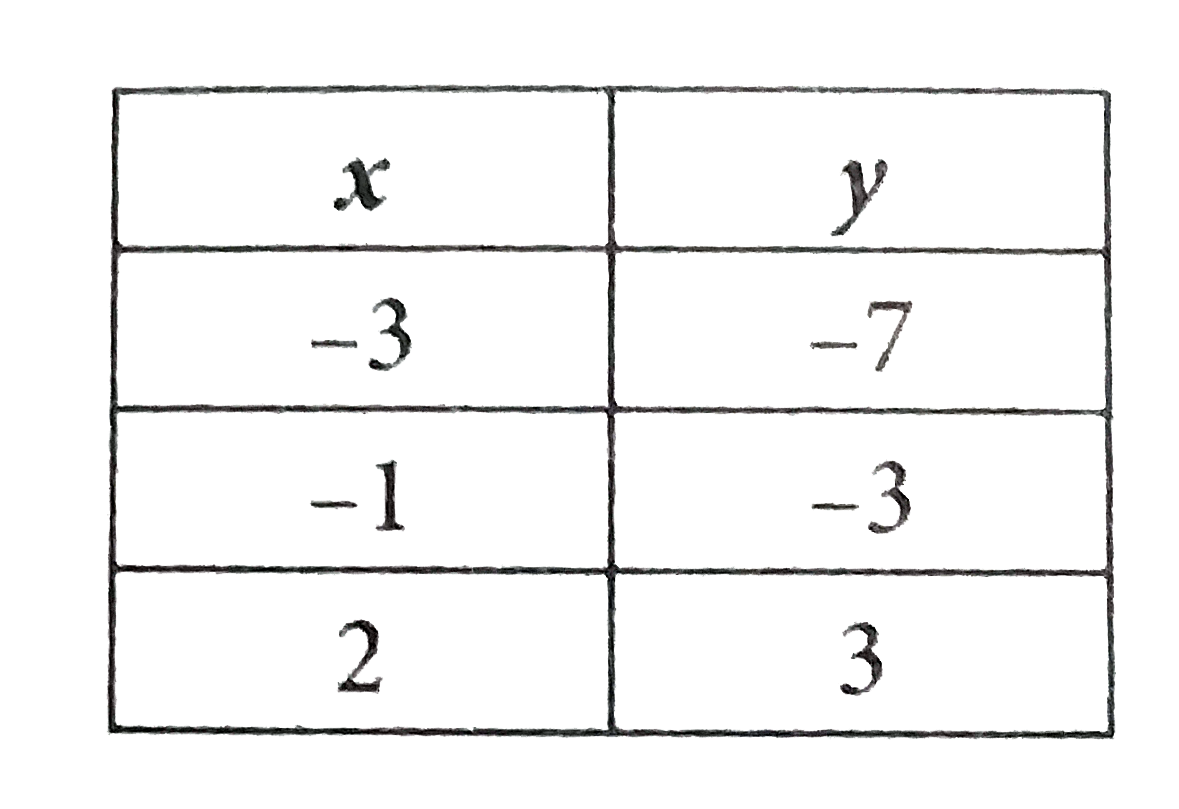
Based on the chart above, which of the following could express the relationship between x and y?
y=x-4
The correct Answer is:B
Step by step video, text & image solution for Based on the chart above, which of the following could express the relationship between x and y? by Maths experts to help you in doubts & scoring excellent marks in Class 12 exams.
Updated on:21/07/2023Topper's Solved these Questions
- FUNCTIONS AND GRAPHSBook:PRINCETONChapter:FUNCTIONS AND GRAPHSExercise:EXAMPLES
Explore 17 Videos
- FUN WITH FUNDAMENTALSBook:PRINCETONChapter:FUN WITH FUNDAMENTALSExercise:Fundamental Drill 2: Calculator- Permitted Section
Explore 6 Videos
- GEOMETRYBook:PRINCETONChapter:GEOMETRYExercise:Geometry Drill 1: No calculator Section
Explore 4 Videos
Similar Questions
Knowledge Check
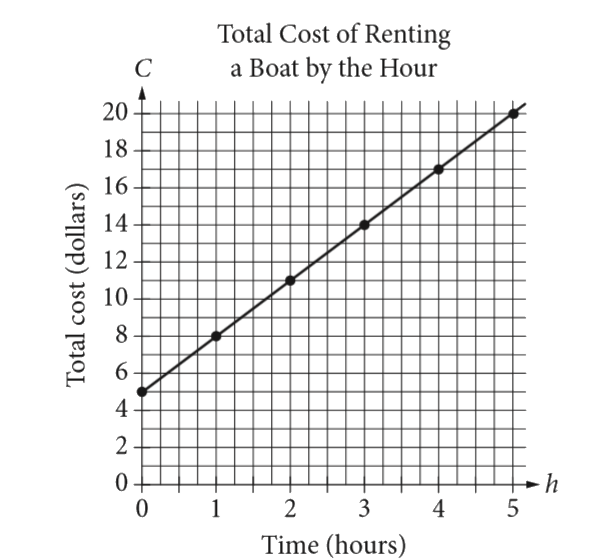
The graph above displays the total cost C, in dollars, of renting a boat for h hours.
Which of the following represents the relationship between h and C ?AC=5hBC=34h+5CC=3h+5Dh=3C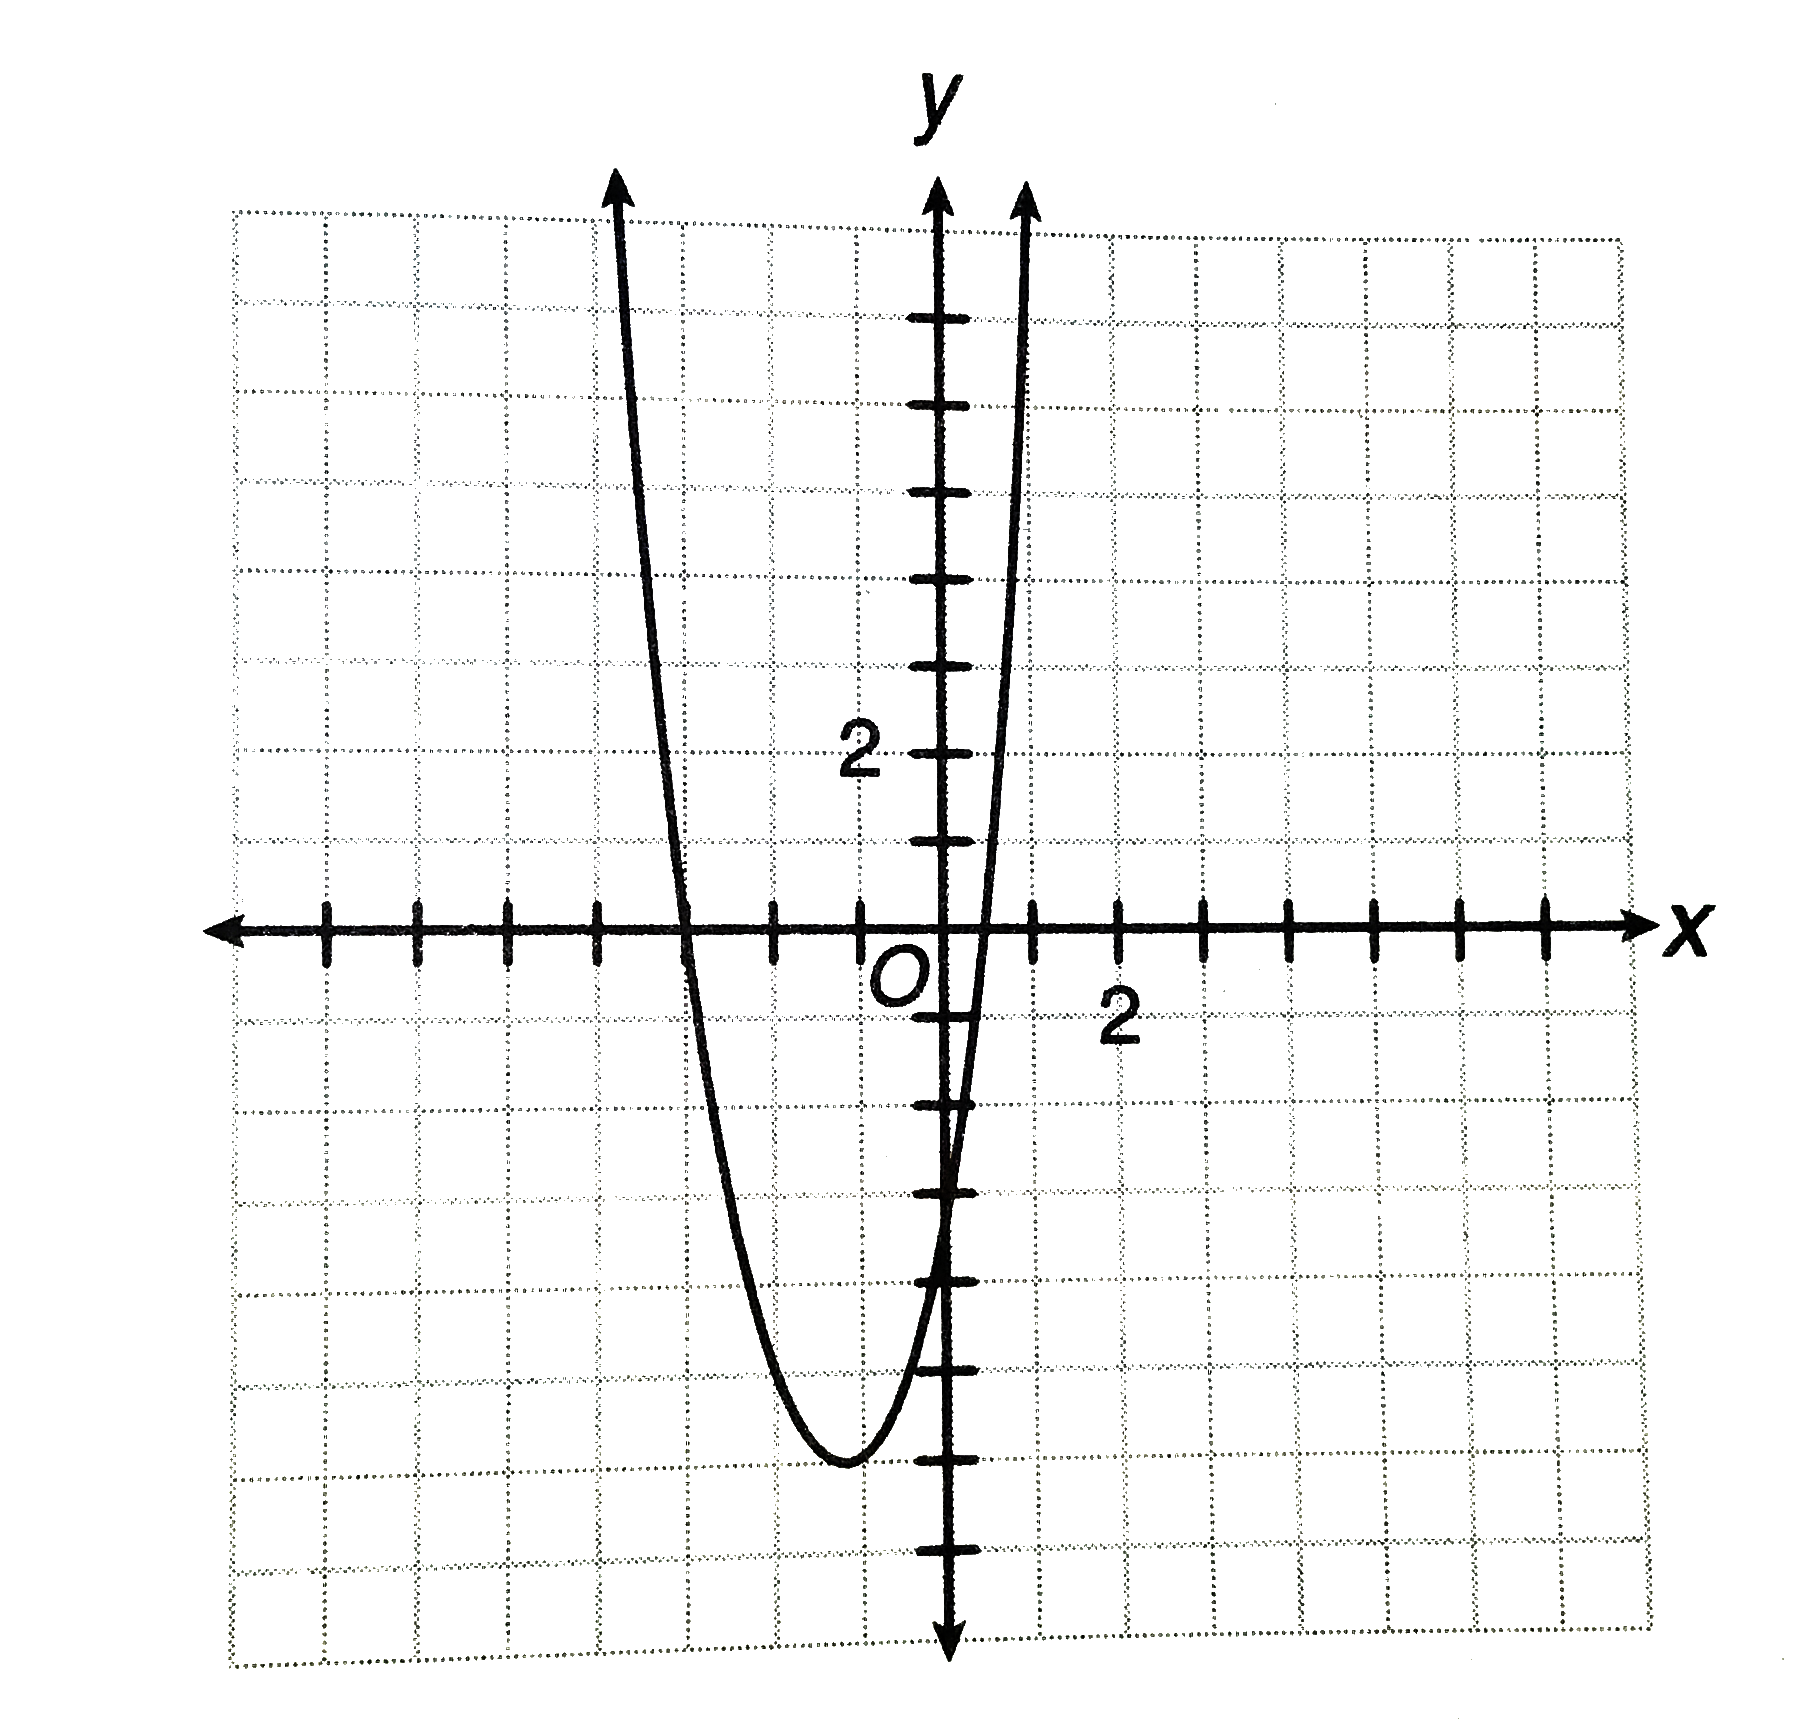
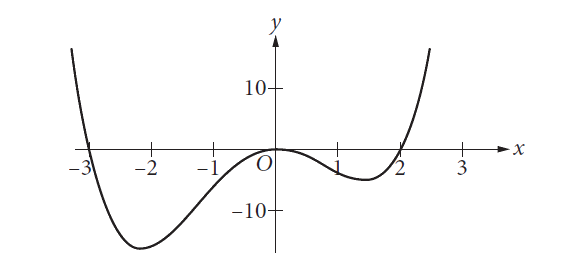
Which of the following could be the equation of the graph above?Ay=(x−3)(2x+1)By=(x+3)(2x−1)Cy=−(x−3)(1+2x)Dy=12(x+3)(x−1)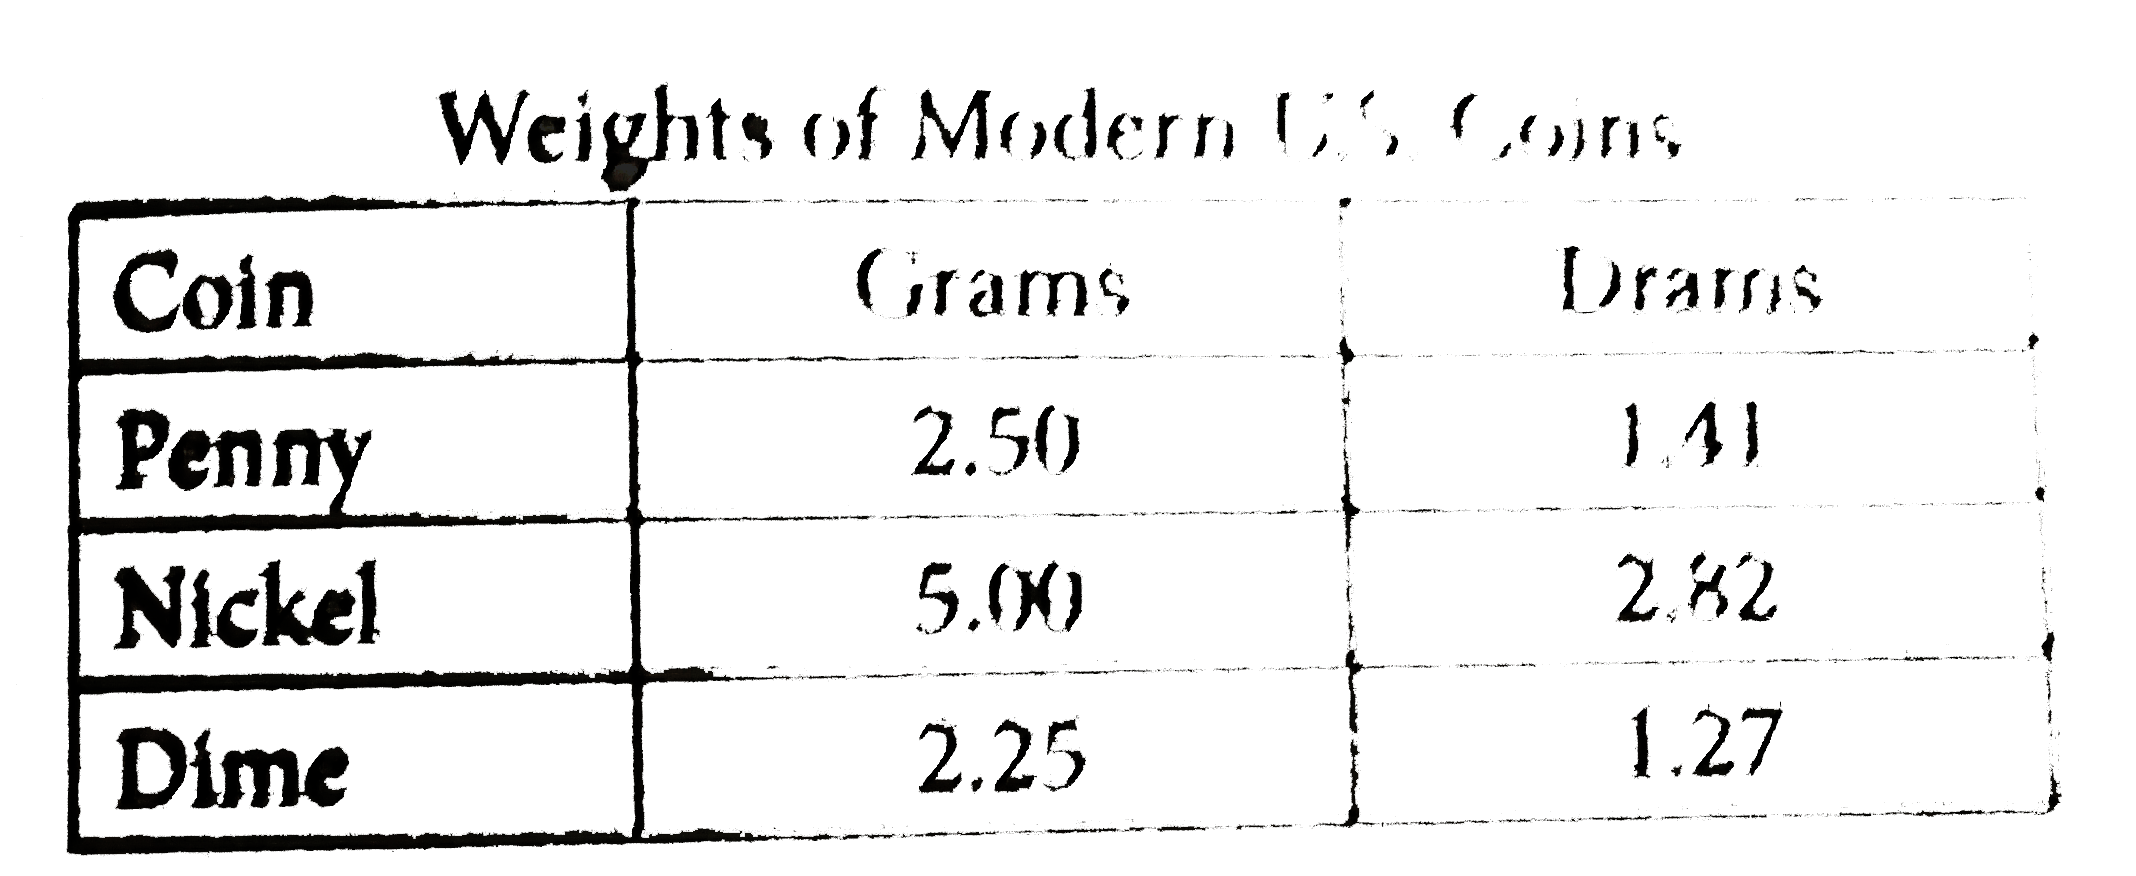
The table above gives the average weight, expressed in both grams and drams, of three types of modern U.S. coins.
IF y grams is equivalent to d drams, of the following. Which best represent the relationship between y and d?Ay=1.8dBd=1.8yCyd=1.8Dy=0.56d
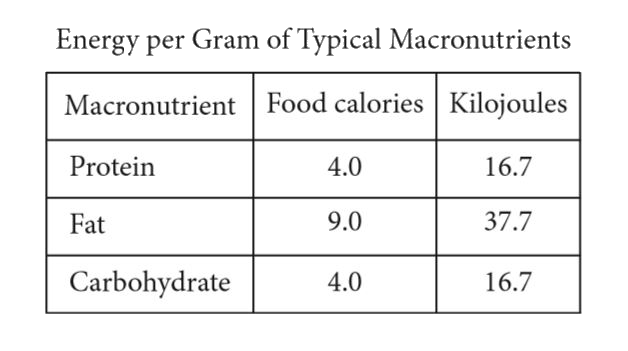
The table above gives the typical amounts of energy per gram, expressed in both food calories and kilojoules, of the three macronutrients in food
If x food calories is equivalent to k kilojoules, of the following, which best represents the relationship between x and k ?
View SolutionWhich of the following expressions gives the de-Broglie relationship?
View Solutiony<−x+a
y>x+b
In the xy-plane, if (0, 0) is a solution to the system of inequalities above, which of the following relationships between a and b must be true?
View SolutionWhich of the following could be the graph of y=3−2x ?
View Solution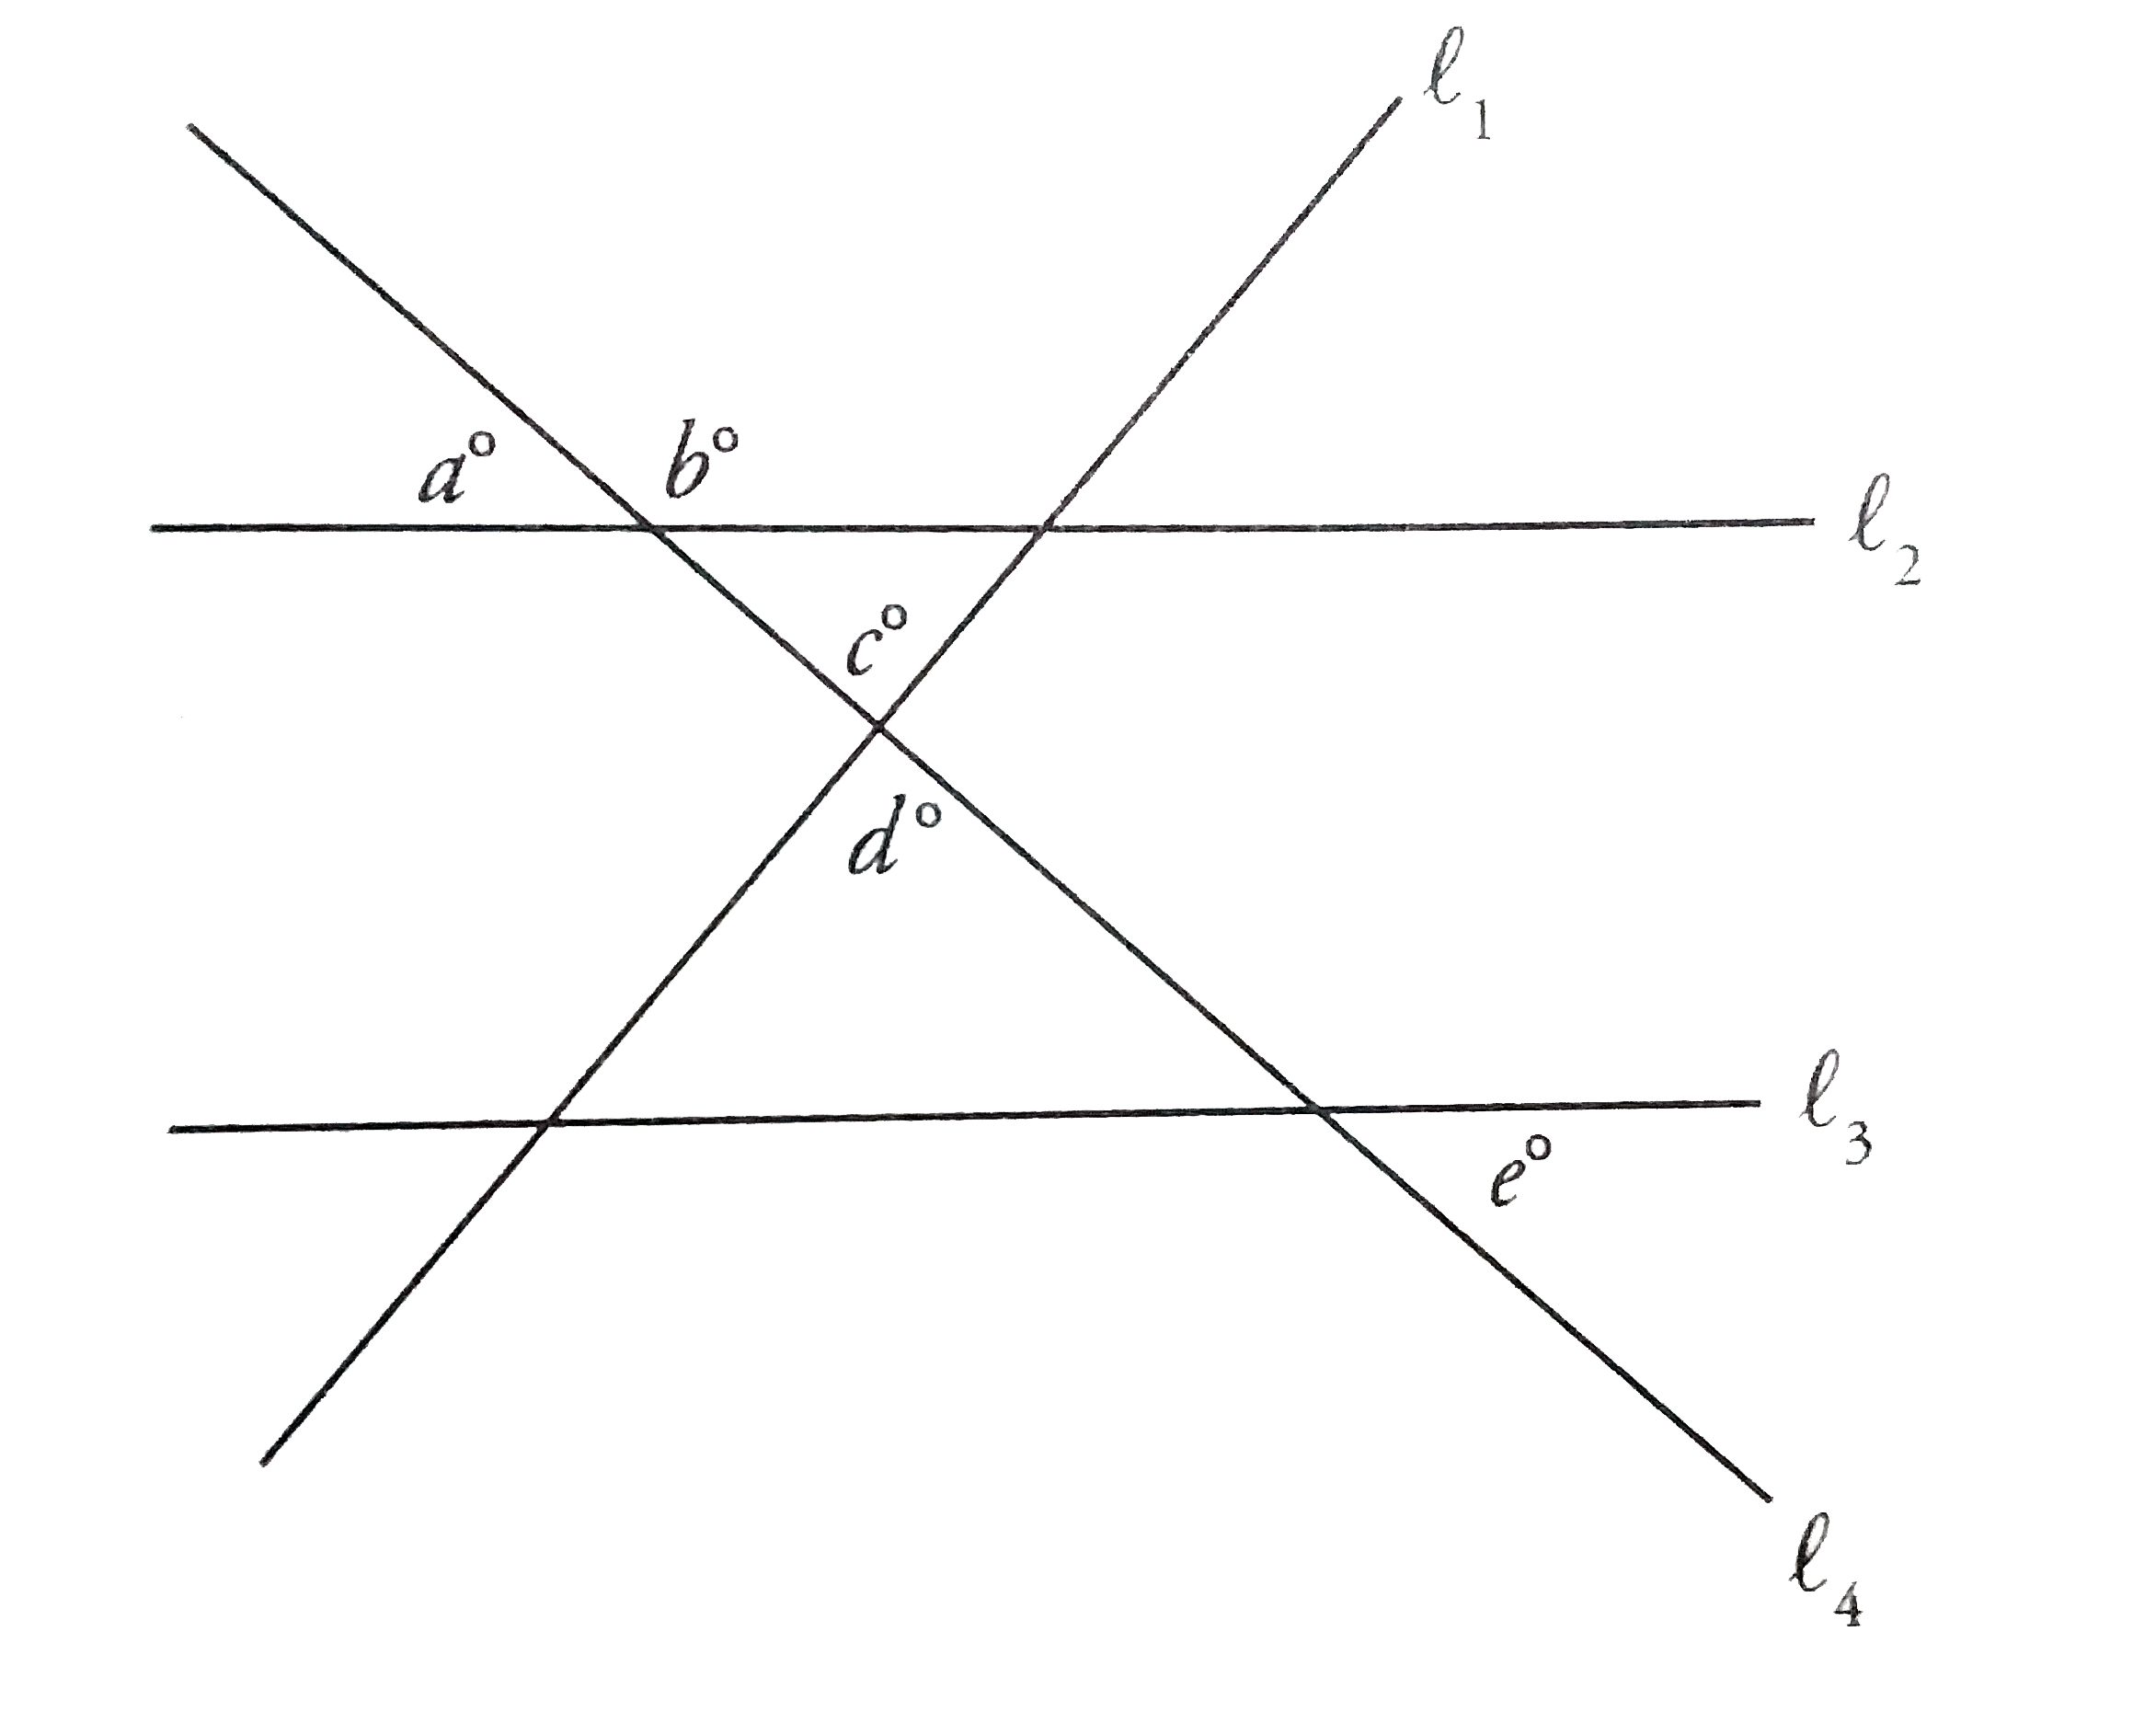
In the figure above l2∣∣l3, which of the following could be false?
View Solution


