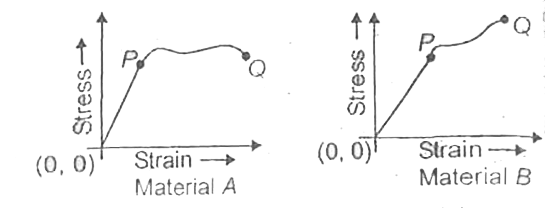
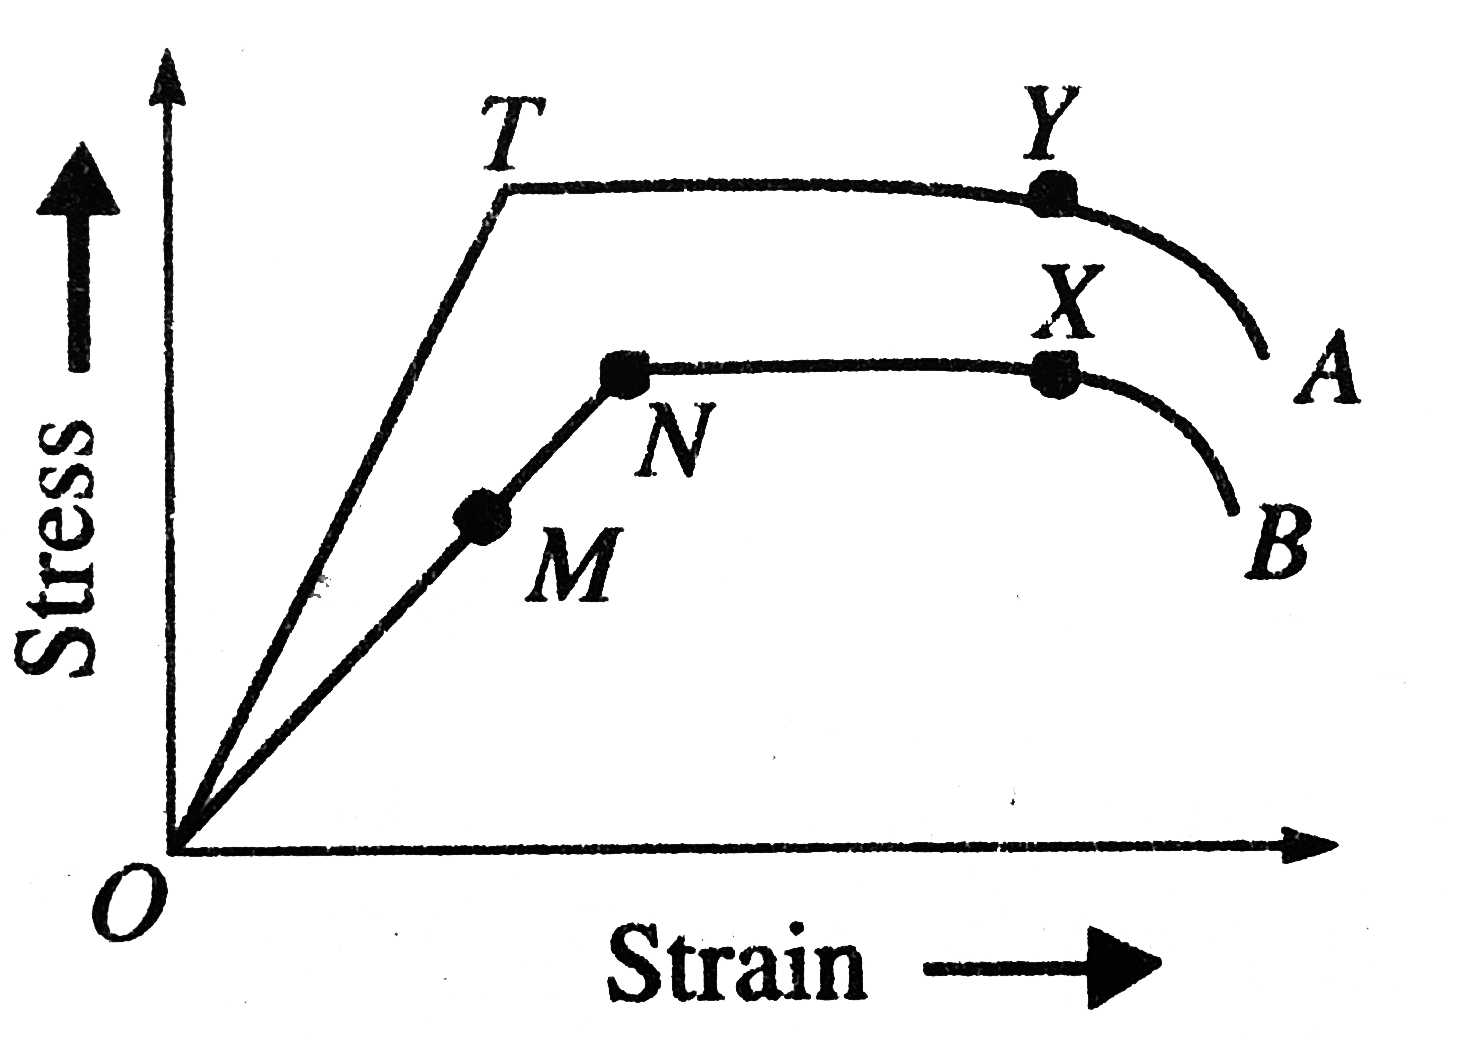
The stress and strain graphs for two materials, A and B are shown here. Answer the following:
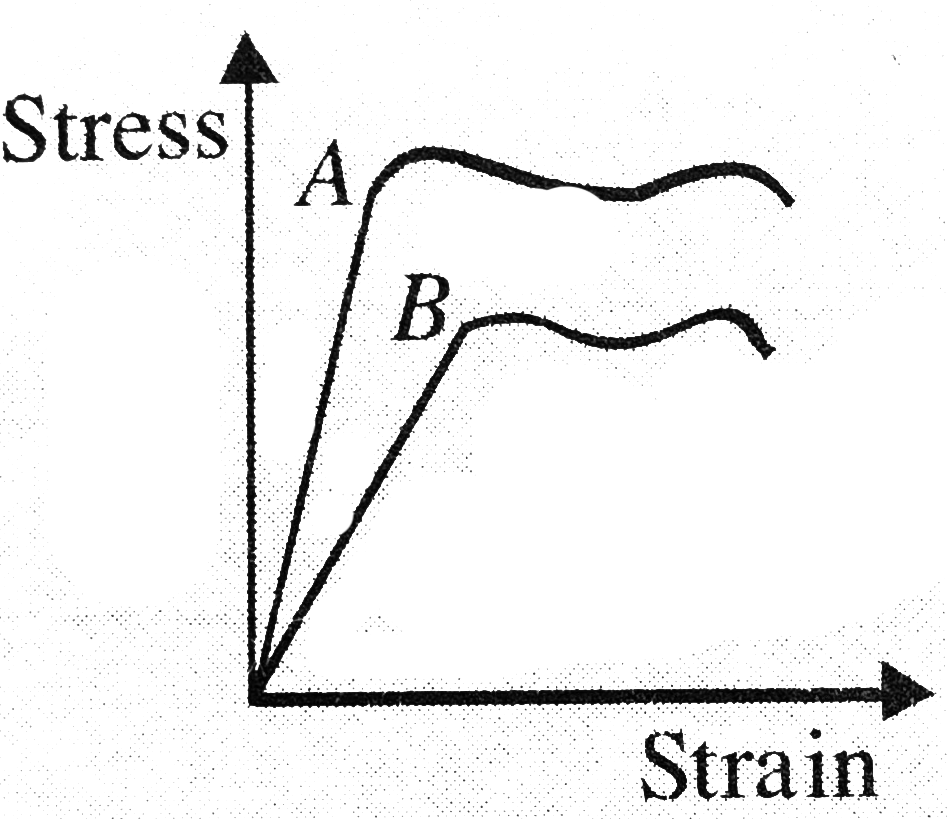 give reasons
a. Material A has greater value of Young's modulus, because slope of A is greater then that of B.
b. Material A is more ductile because ther is a large plastic defomation range between the elastic limit and the breaking point.
c. Material B ismore brittle because the plastric regiion between the elastic limit and breaking point is small.
d.Strength of a material is determined by the stress required to cause fracture. Material A is stronger than material B.
Topper's Solved these Questions
- ELASTICITYBOOK - MOTIONCHAPTER - ELASTICITYEXERCISE - QUESTION FOR PRACTICE
3 Videos
- ELASTICITYBOOK - MOTIONCHAPTER - ELASTICITYEXERCISE - EXERCISE -1
27 Videos
- CURRENT ELECTRICITYBOOK - MOTIONCHAPTER - CURRENT ELECTRICITYEXERCISE - EXERCISE -4 (Level -II)
25 Videos
- ELASTICITY AND THERMAL EXPANSIONBOOK - MOTIONCHAPTER - ELASTICITY AND THERMAL EXPANSIONEXERCISE - Exercise - 4 (Level-II)
11 Videos
Similar Questions
The stress-strain graphs for two materials A and B are shown in the figure. The graphs are drawn to the same scale.
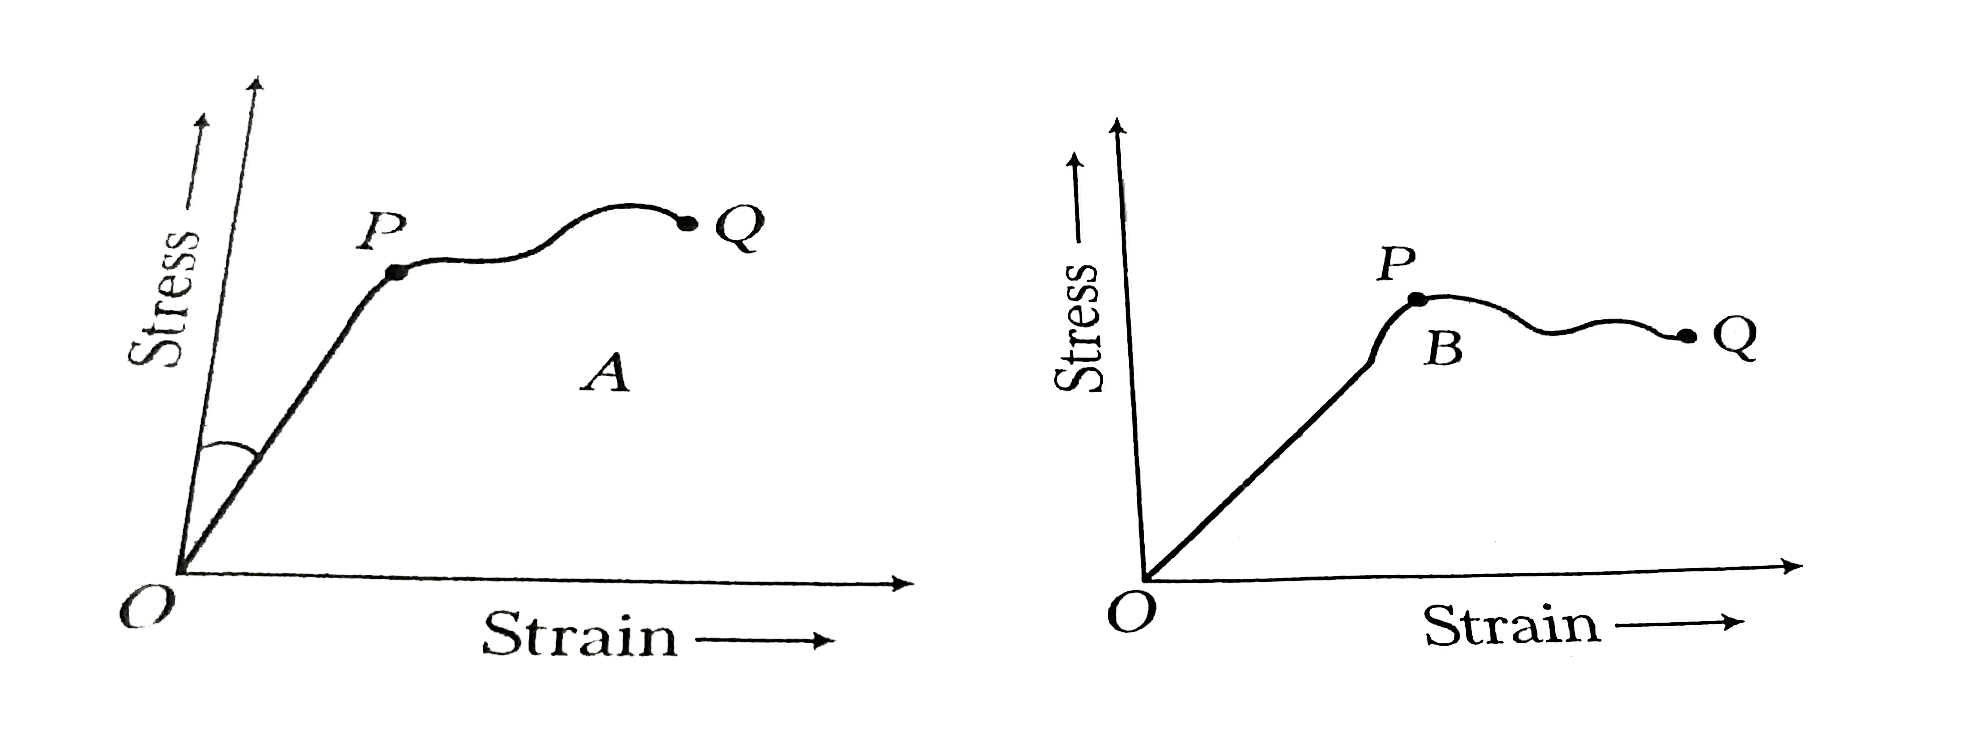
(a) Which material has a greater Young's modulus ?
(b) Which material is more ductile ?
(c) Which material is more brittle?
(d) Which of the two is the stronger material ?
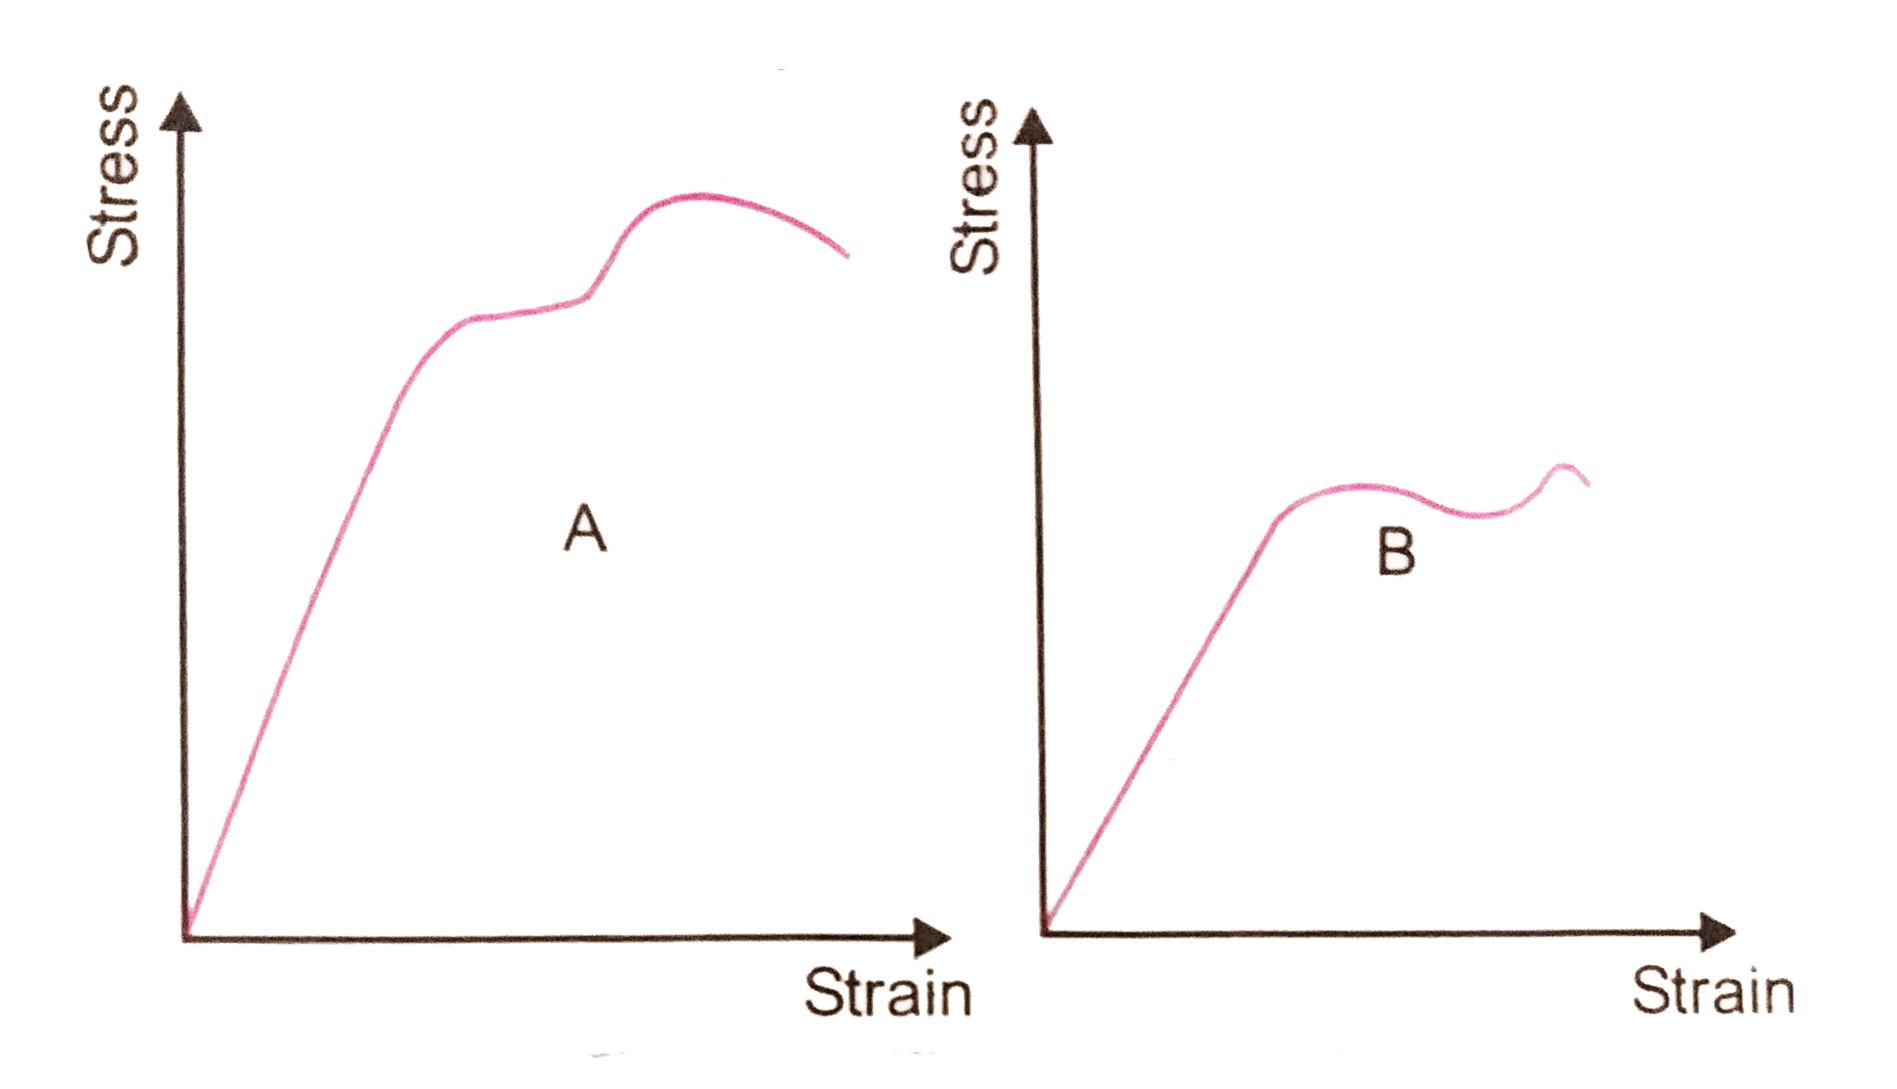
View SolutionThe stress versus strain graph for two materials A and B are shown in fig. the graph are on the same scale. ltbr> (a) Which materail has greater Young's modulus?
(b) which of the two is stronger materail?
View Solution
Knowledge Check
The stress- strain graphs for materials A and B are as shown. Choose the correct alternative
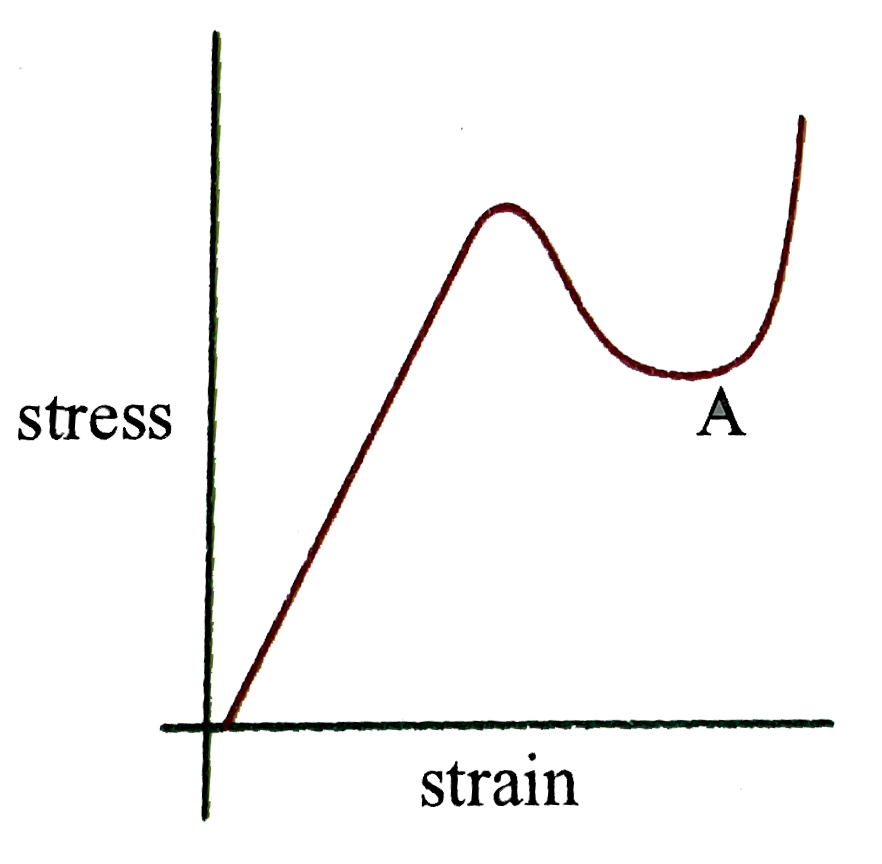
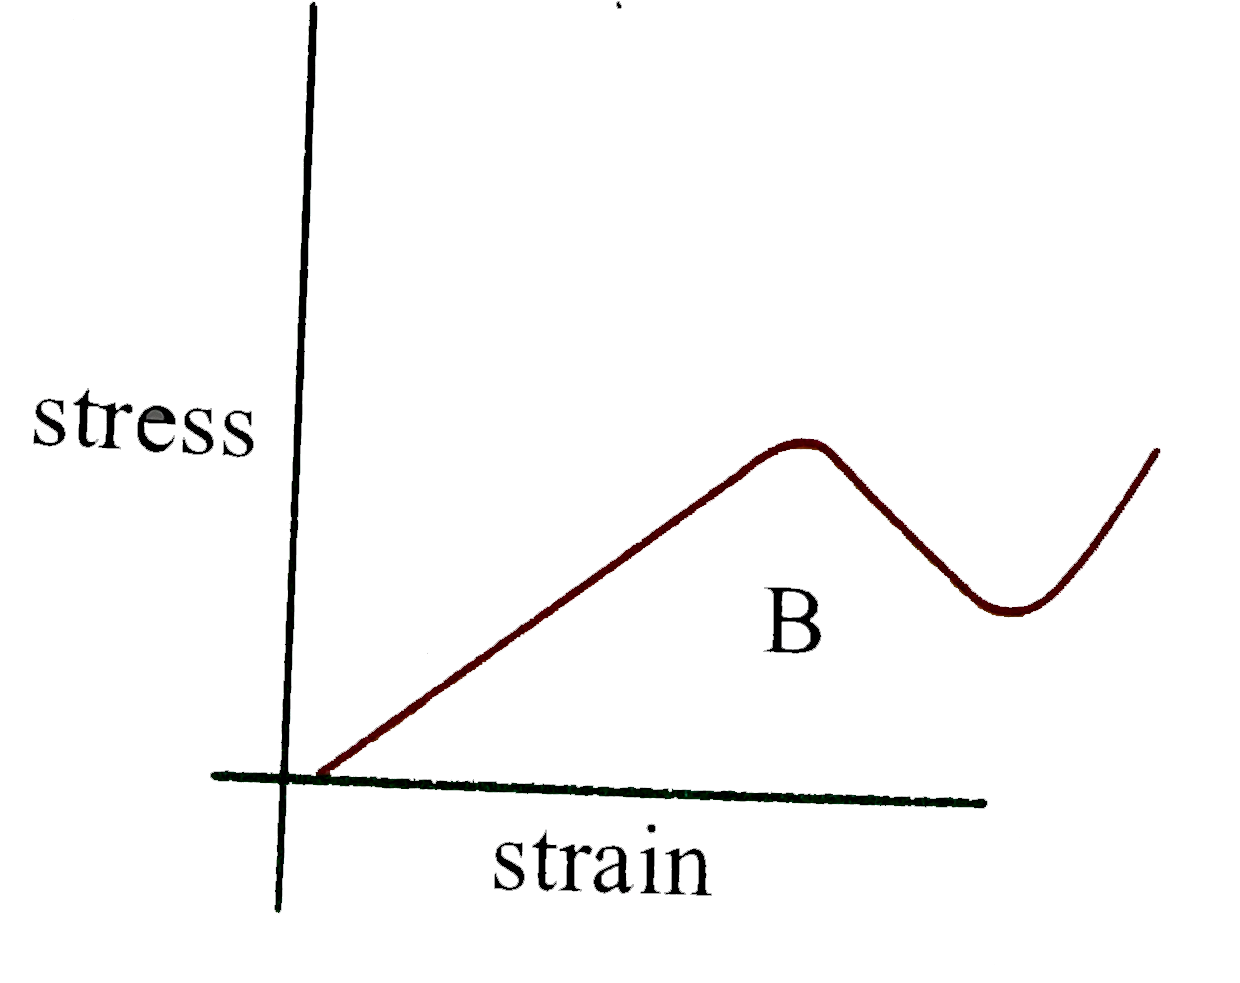 Amaterial A is stronger than material BBmaterial B is stronger than material ACYoung's modulus of A is greater than that of BDYoung's modulus of B is greater than that of A
Materials get deformed when force is applied. Some of them regain their status when the applied force is removed. They are termed as elastic. Those of which not regaining are called plastic. There may be delay in the regaining in some materials. They are said to have got elastic aftereffect, since they have gone beyond the elastic limit. Repeated application and removal of force leads to fatigueness in the material. Fatigued materials may break at any point time and so are avoided.
The stress strain graph for two materials A and B is shown in the following figure:
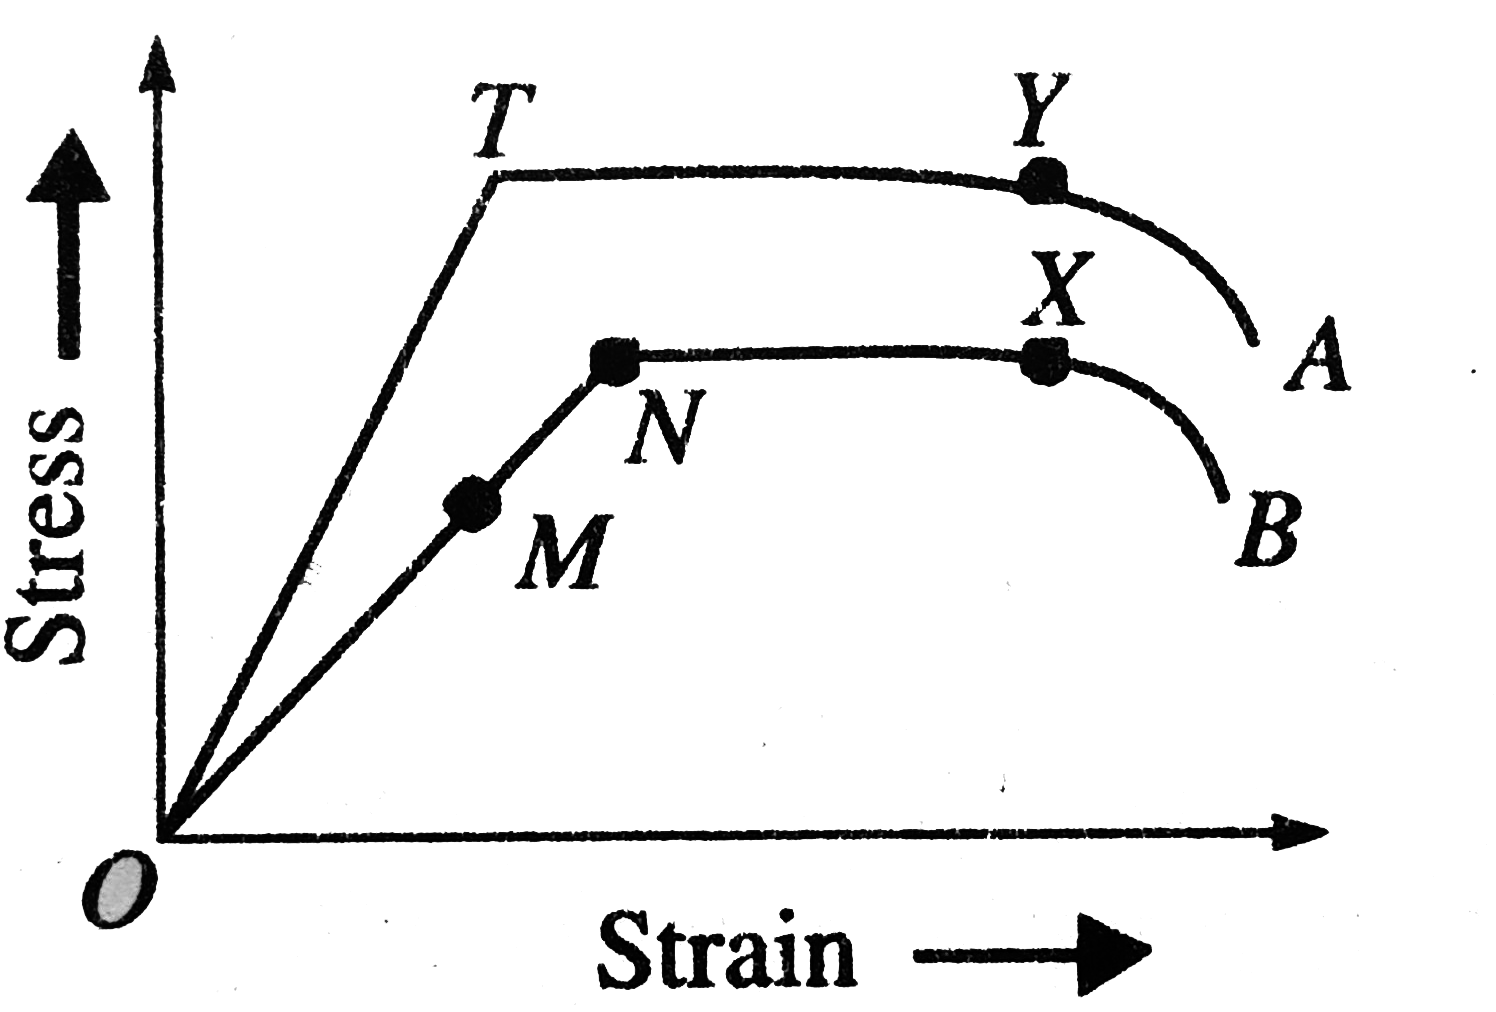
If the intensity of A and B is EA and EB, respectivelyAEA=EBBEA>EBCEA<EBDEA<<EBMaterials get deformed when force is applied. Some of them regain their status when the applied force is removed. They are termed as elastic. Those of which not regaining are called plastic. There may be delay in the regaining in some materials. They are said to have got elastic aftereffect, since they have gone beyond the elastic limit. Repeated application and removal of force leads to fatigueness in the material. Fatigued materials may break at any point time and so are avoided.
The stress strain graph for two materials A and B is shown in the following figure:
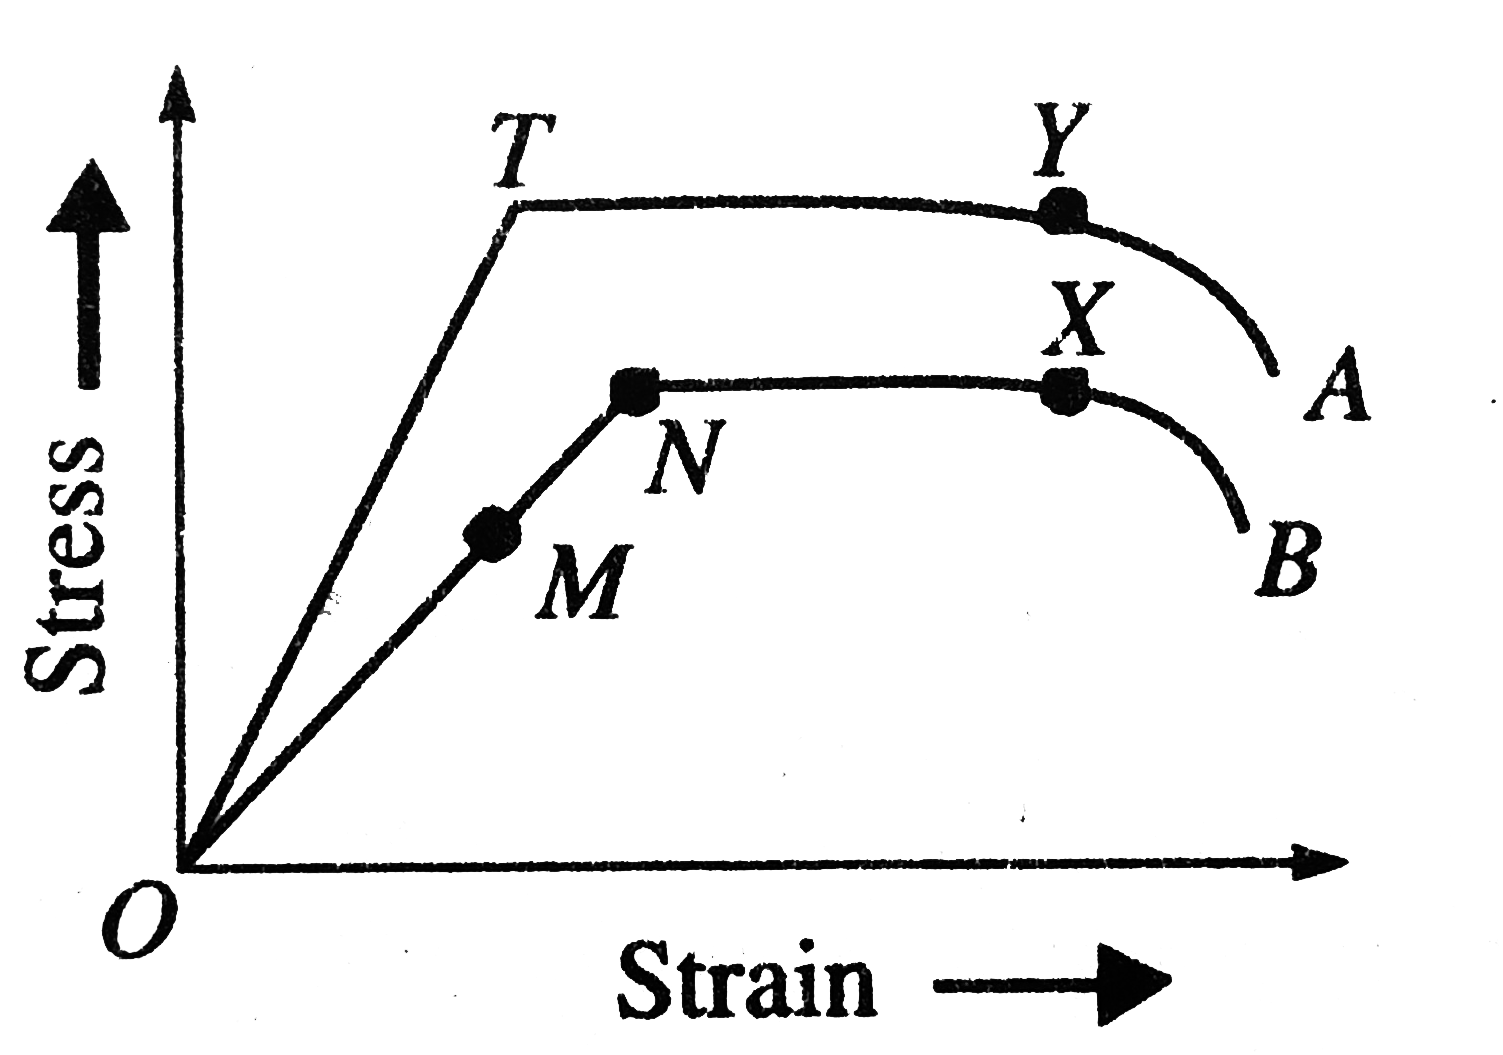
The time in which the two materials regain their original status is tA and tB related as tB=2tB. Then the material under elastic aftereffect (relatively) isABBACboth A and BDneighter A nor B
The stress-strain graphs for two materials A and are shown in figure. The graphs are drawn to the same scale. Select the correct statement
View SolutionMaterials get deformed when force is applied. Some of them regain their status when the applied force is removed. They are termed as elastic. Those of which not regaining are called plastic. There may be delay in the regaining in some materials. They are said to have got elastic aftereffect, since they have gone beyond the elastic limit. Repeated application and removal of force leads to fatigueness in the material. Fatigued materials may break at any point time and so are avoided.
The stress strain graph for two materials A and B is shown in the following figure:
The strength of the material A and B is SA and SB, respectively, while the longevity of plastic behaviour is LA and LB. Then
View Solution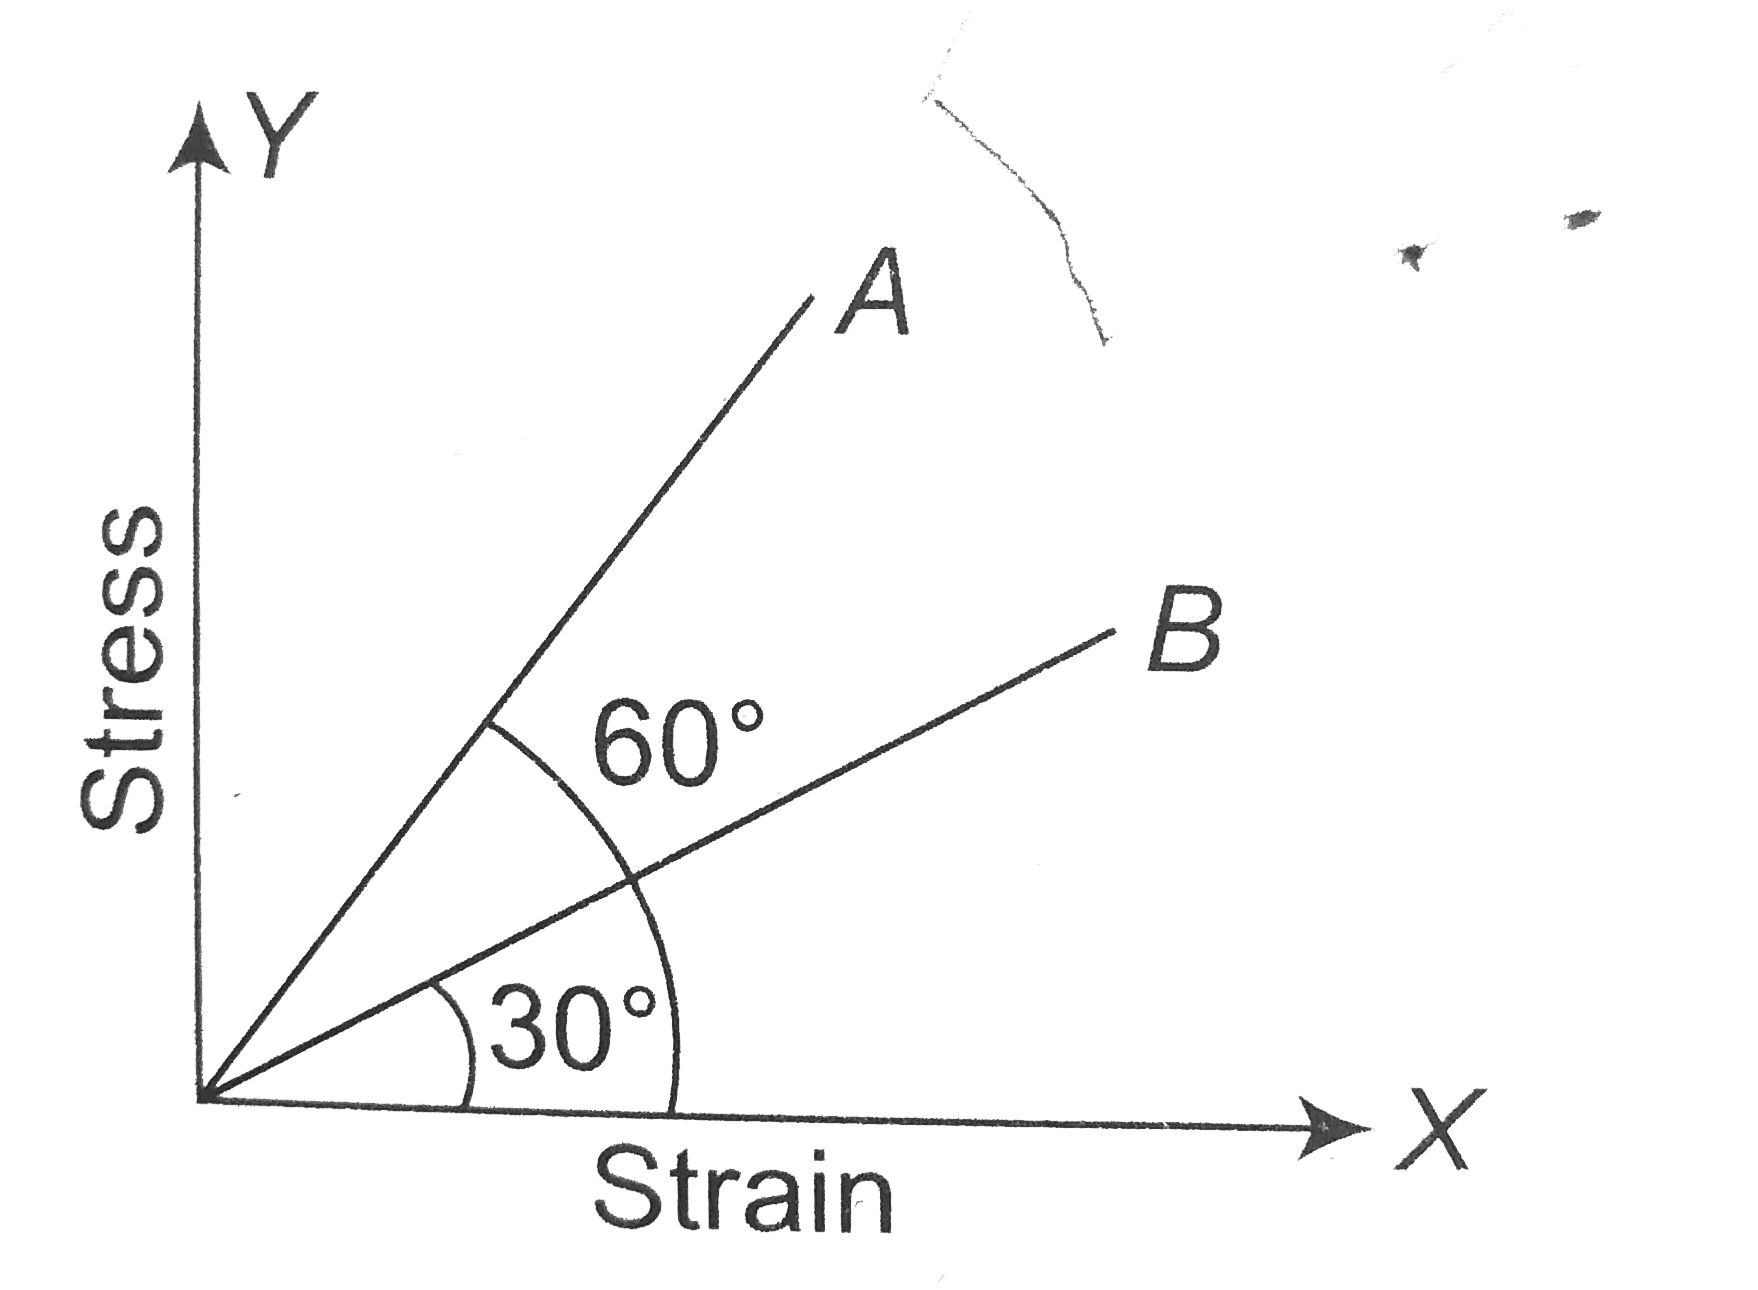
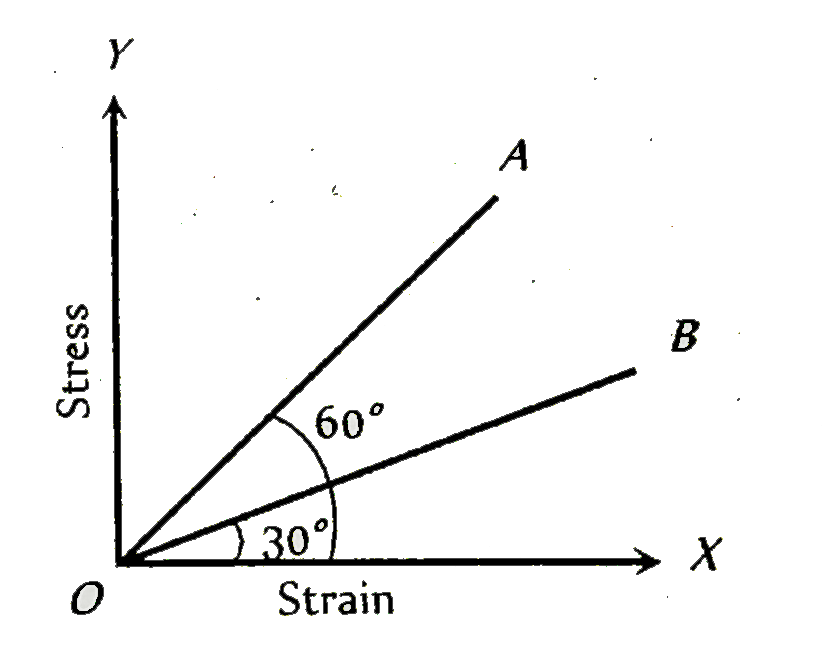
The stress versus strain graphs for wires of two materials A and B are as shown in the figure. If YA and YB are the Young's moduli of the materials then
View SolutionThe stress versus strain graphs for wires of two materials A and B are as shown in the figure. If YAandYB are the younng's moduli of the materials, then
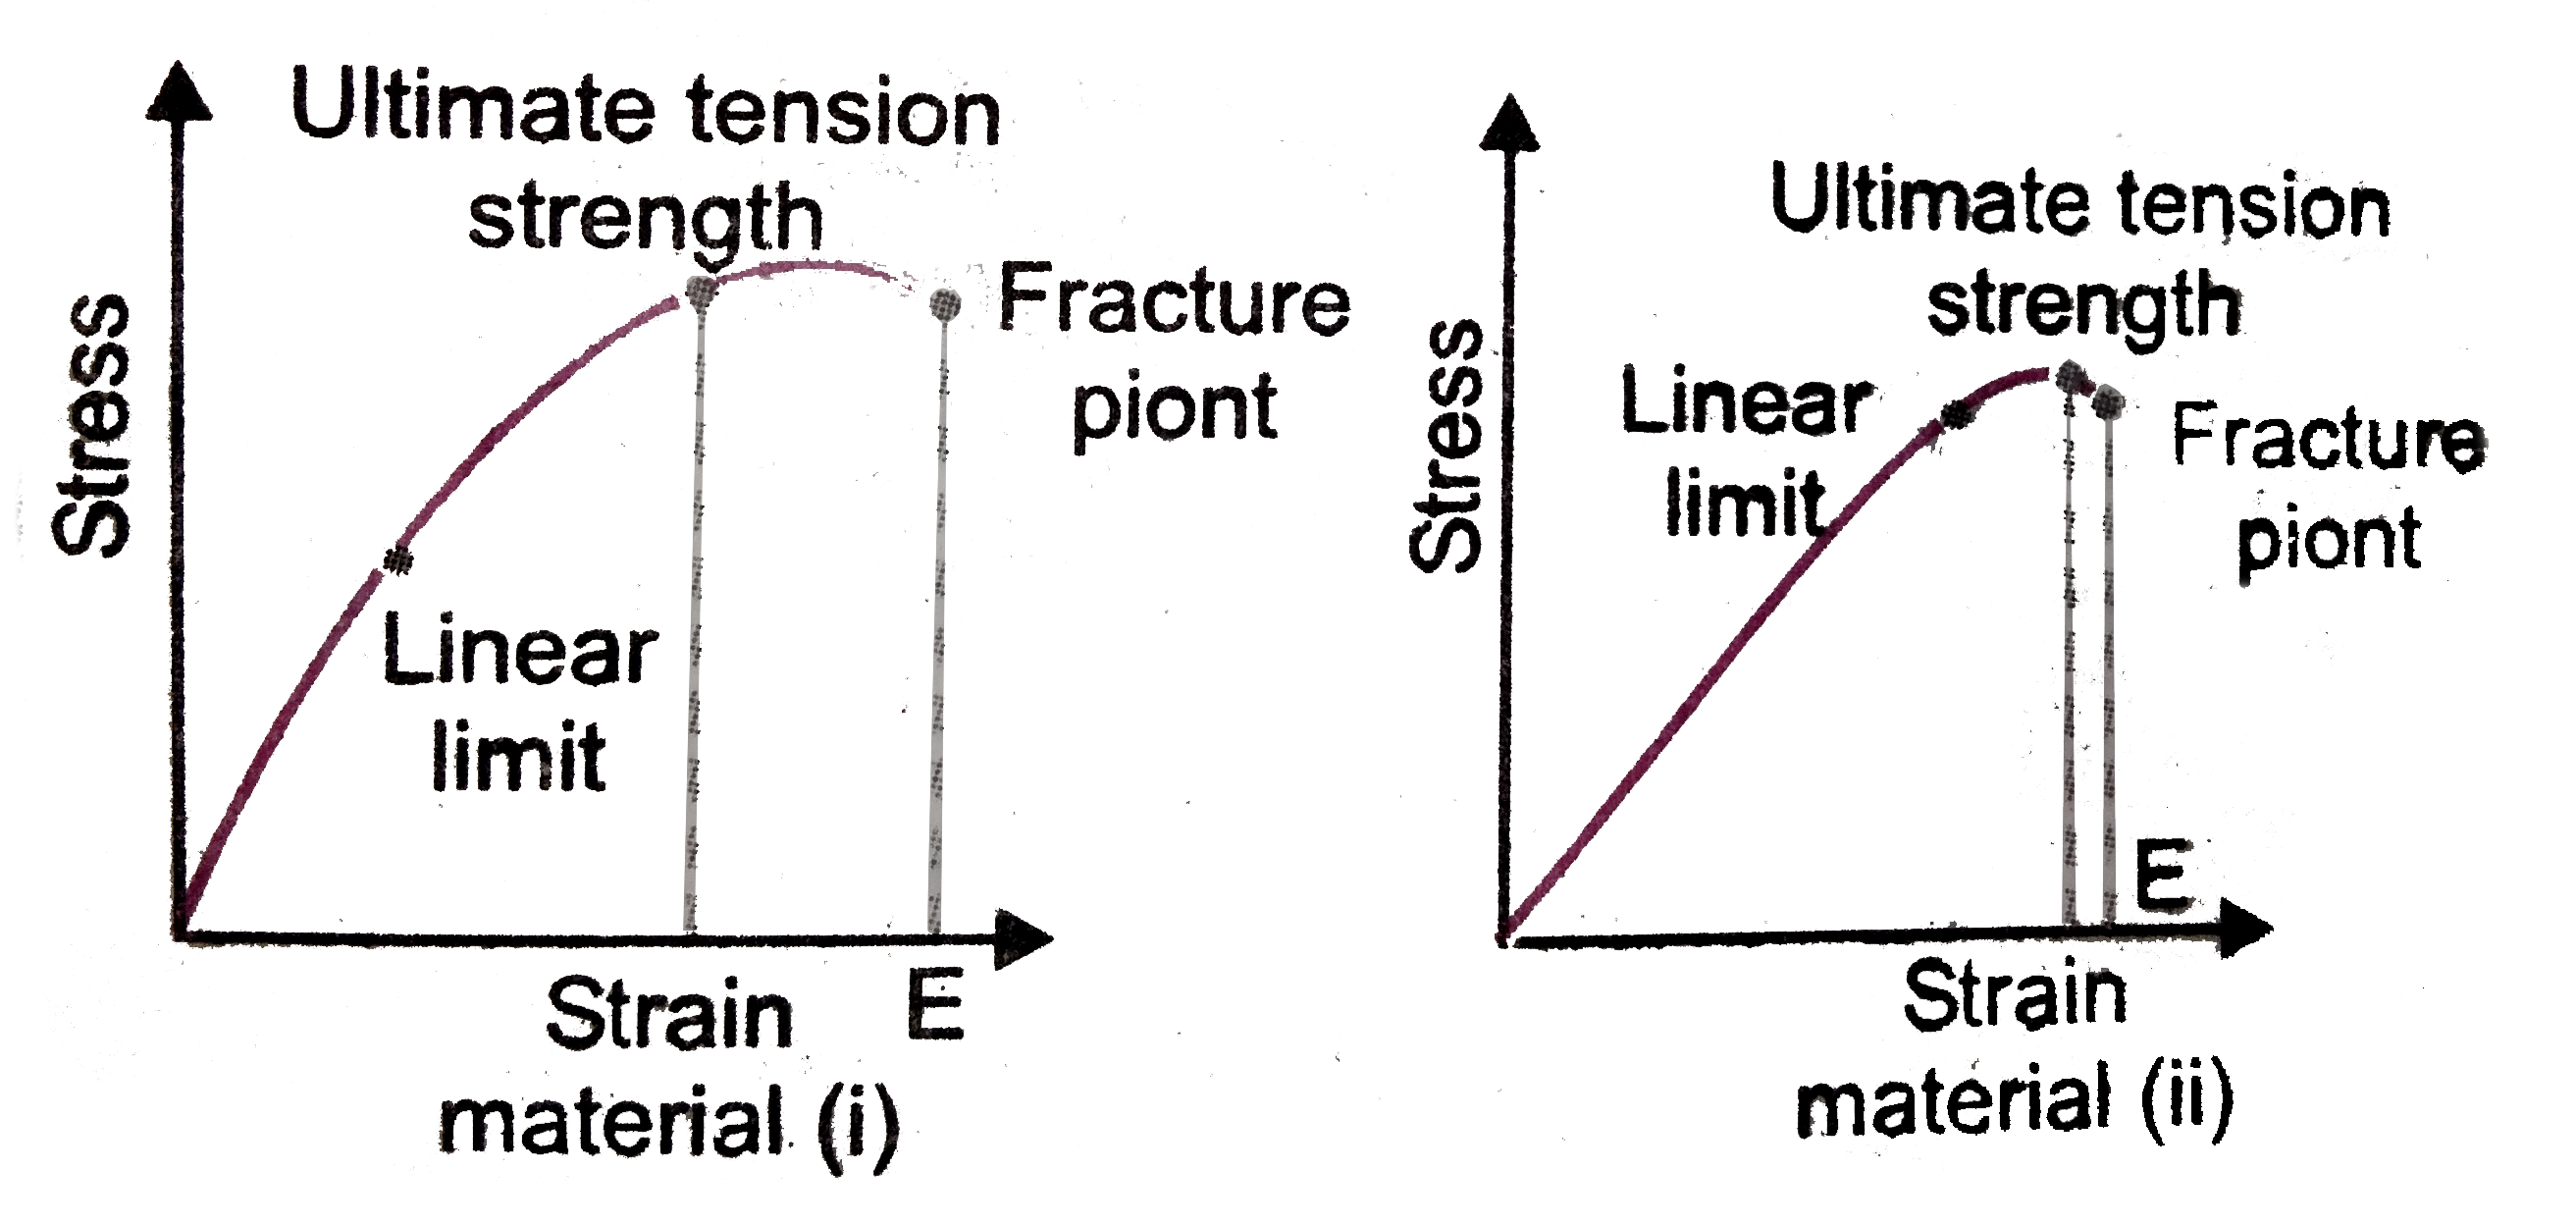
View SolutionThe stress-strain graphs for two materials are shown in Fig. 7(EP).3 (assume scale).
View Solution
