The diagram showing the variation of gravitational potential of earth with distance from the centre of earth is
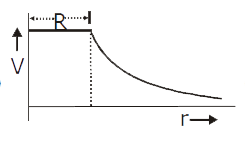
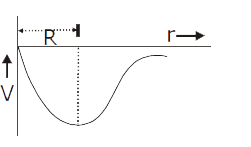
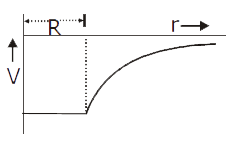
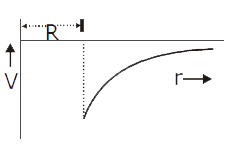
The correct Answer is:C
Step by step video, text & image solution for The diagram showing the variation of gravitational potential of earth with distance from the centre of earth is by Physics experts to help you in doubts & scoring excellent marks in Class 12 exams.
Updated on:21/07/2023Topper's Solved these Questions
- GRAVITATIONBOOK - MOTIONCHAPTER - GRAVITATIONEXERCISE - Exercise - 1 (Section - B :- Gravitational Acceleration and Its Variation)
20 Videos
- GRAVITATIONBOOK - MOTIONCHAPTER - GRAVITATIONEXERCISE - Exercise - 1 (Section - C :- Keplers Law, Orbital Velocity, Escape Velocity + Geo. Stationary Satellites )
47 Videos
- GRAVITATIONBOOK - MOTIONCHAPTER - GRAVITATIONEXERCISE - QUESTIONS FOR PRACTICE
38 Videos
- GEOMETRICAL OPTICSBOOK - MOTIONCHAPTER - GEOMETRICAL OPTICSEXERCISE - Exercise - 4 | Level-II
55 Videos
- HEAT - 1BOOK - MOTIONCHAPTER - HEAT - 1EXERCISE - EXERCISE -4 (Level - II) Previous Year | JEE Advanced
22 Videos
Similar Questions
Draw a graph showing the variation of the gravitational acceleration due to the Earth with depth and altitude.
View SolutionWhat is meant by gravitational potential energy of a body ? Derive an expression for the gravitational potential energy for a body of mass m lying at a distance r from the centre of Earth.
View Solution
Knowledge Check
The correct variation of gravitational potential V with radius r measured from the centre of earth of radius R is given by
A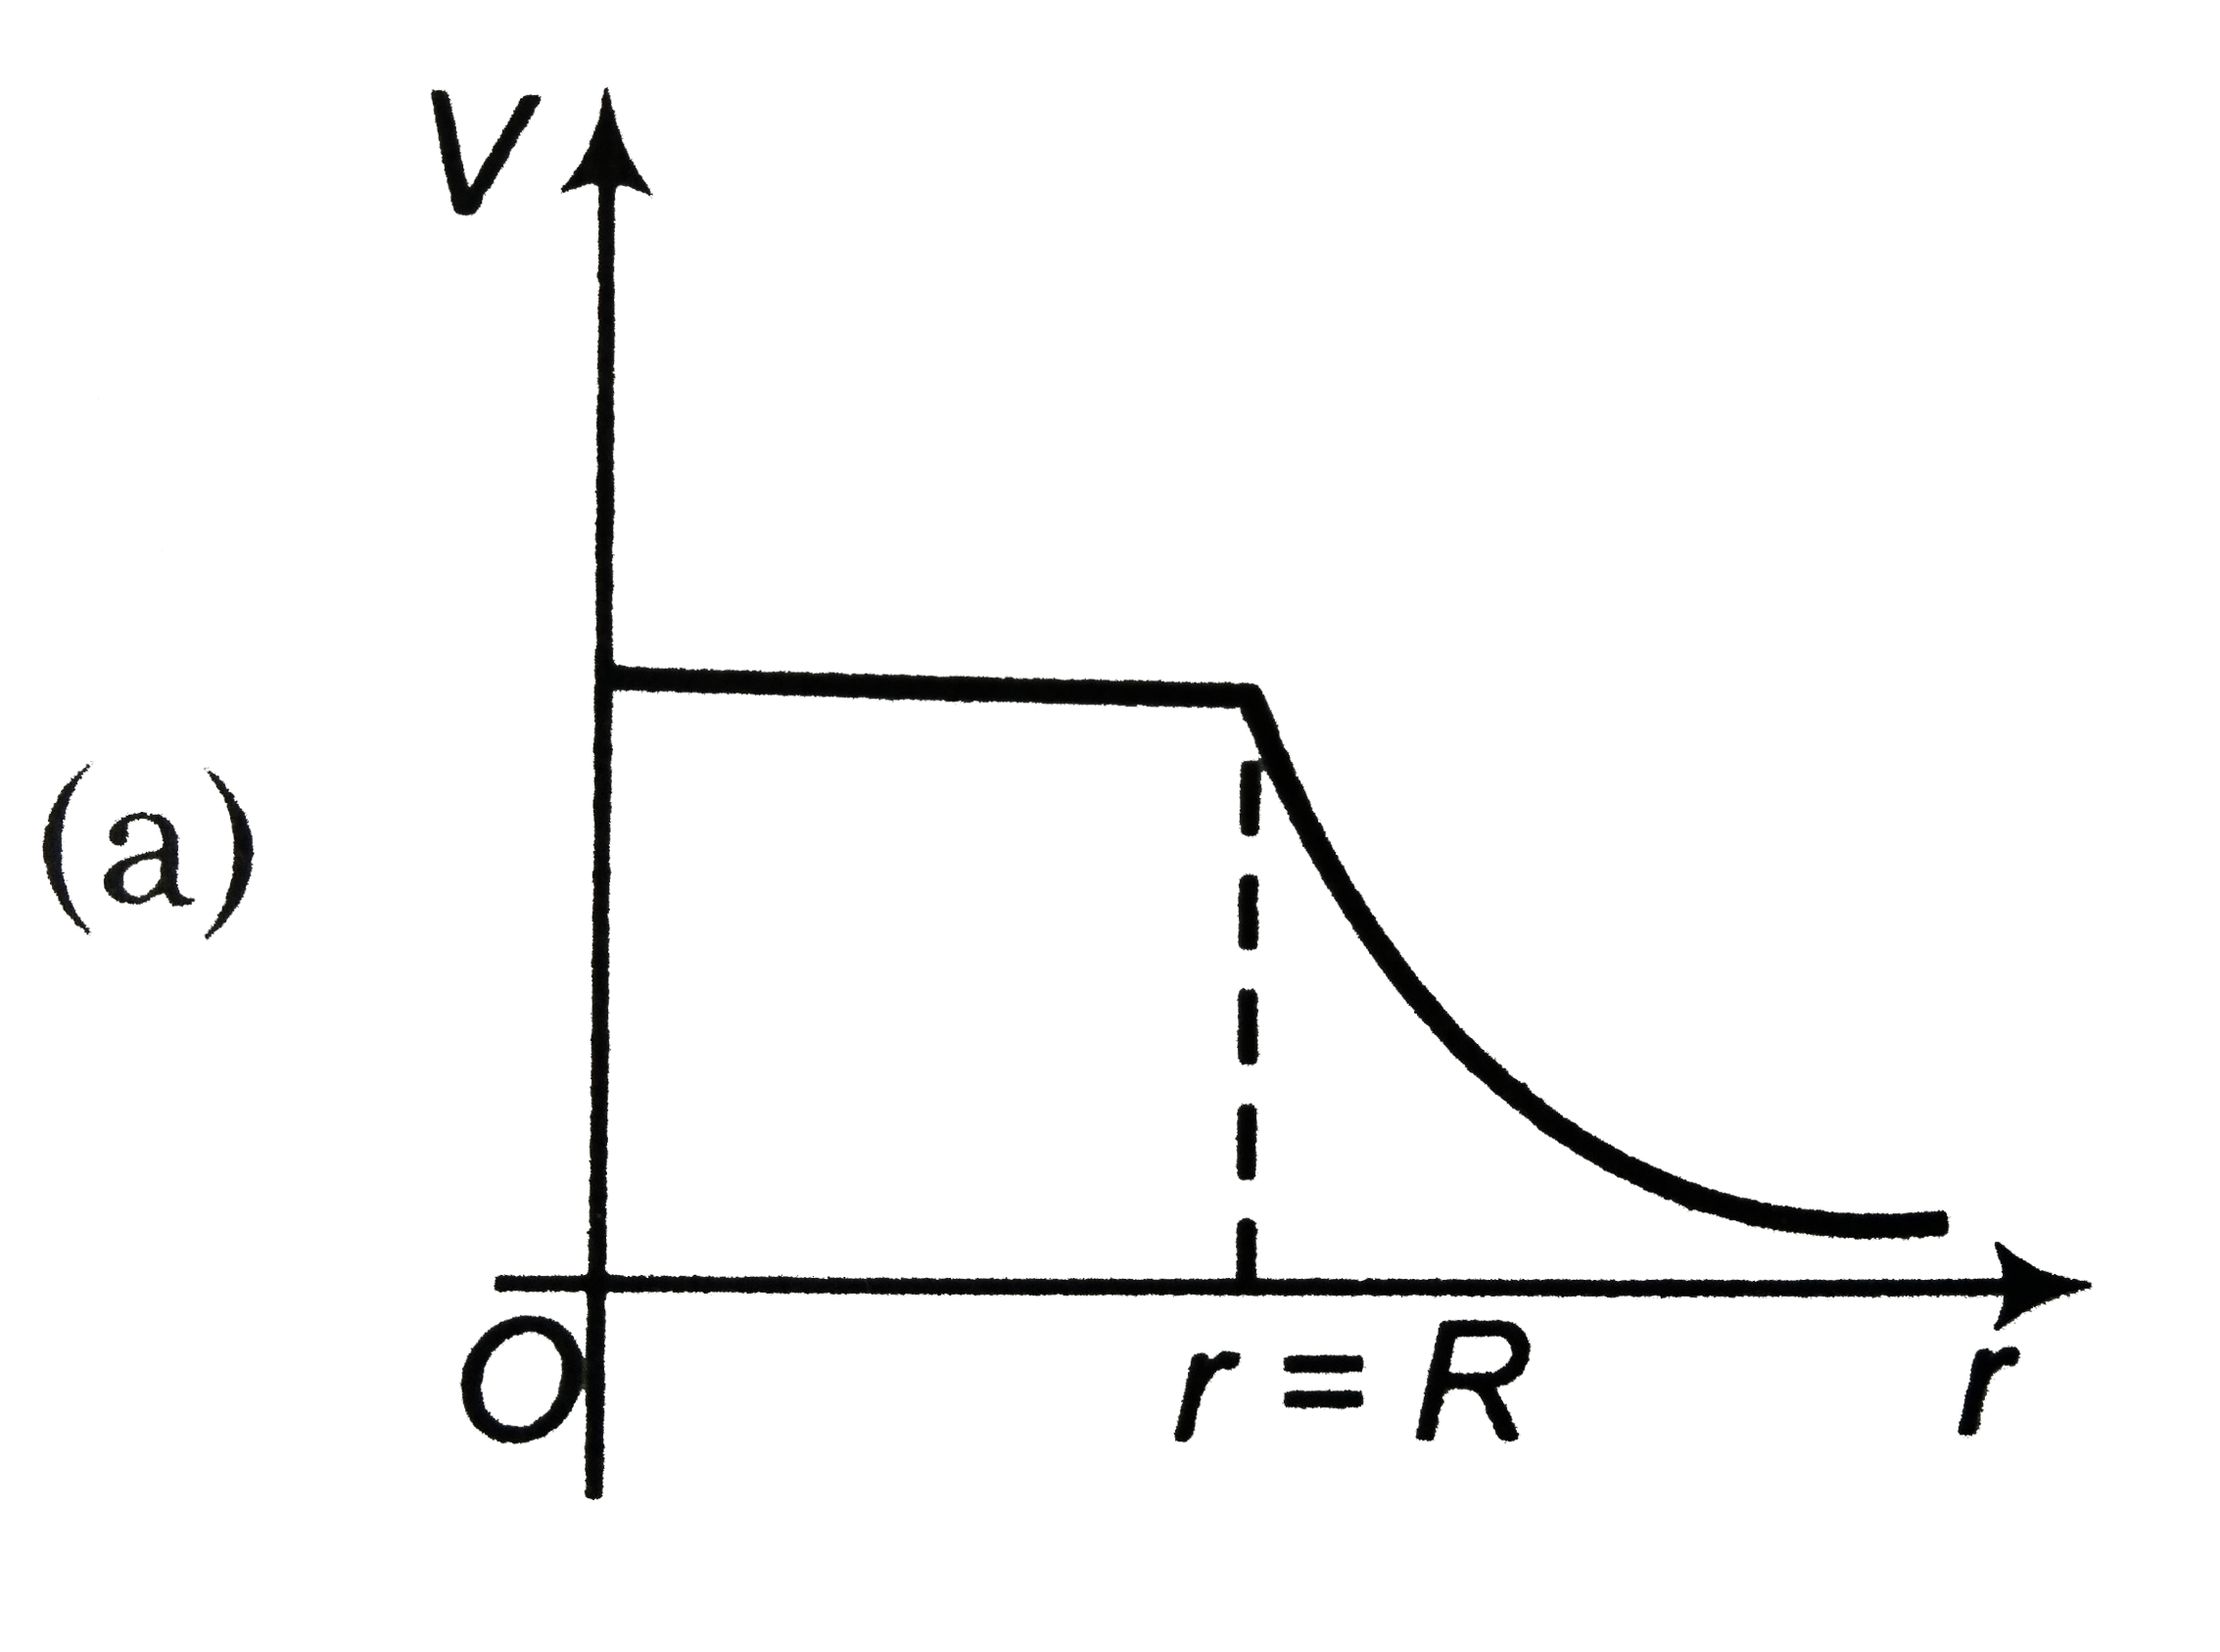 B
B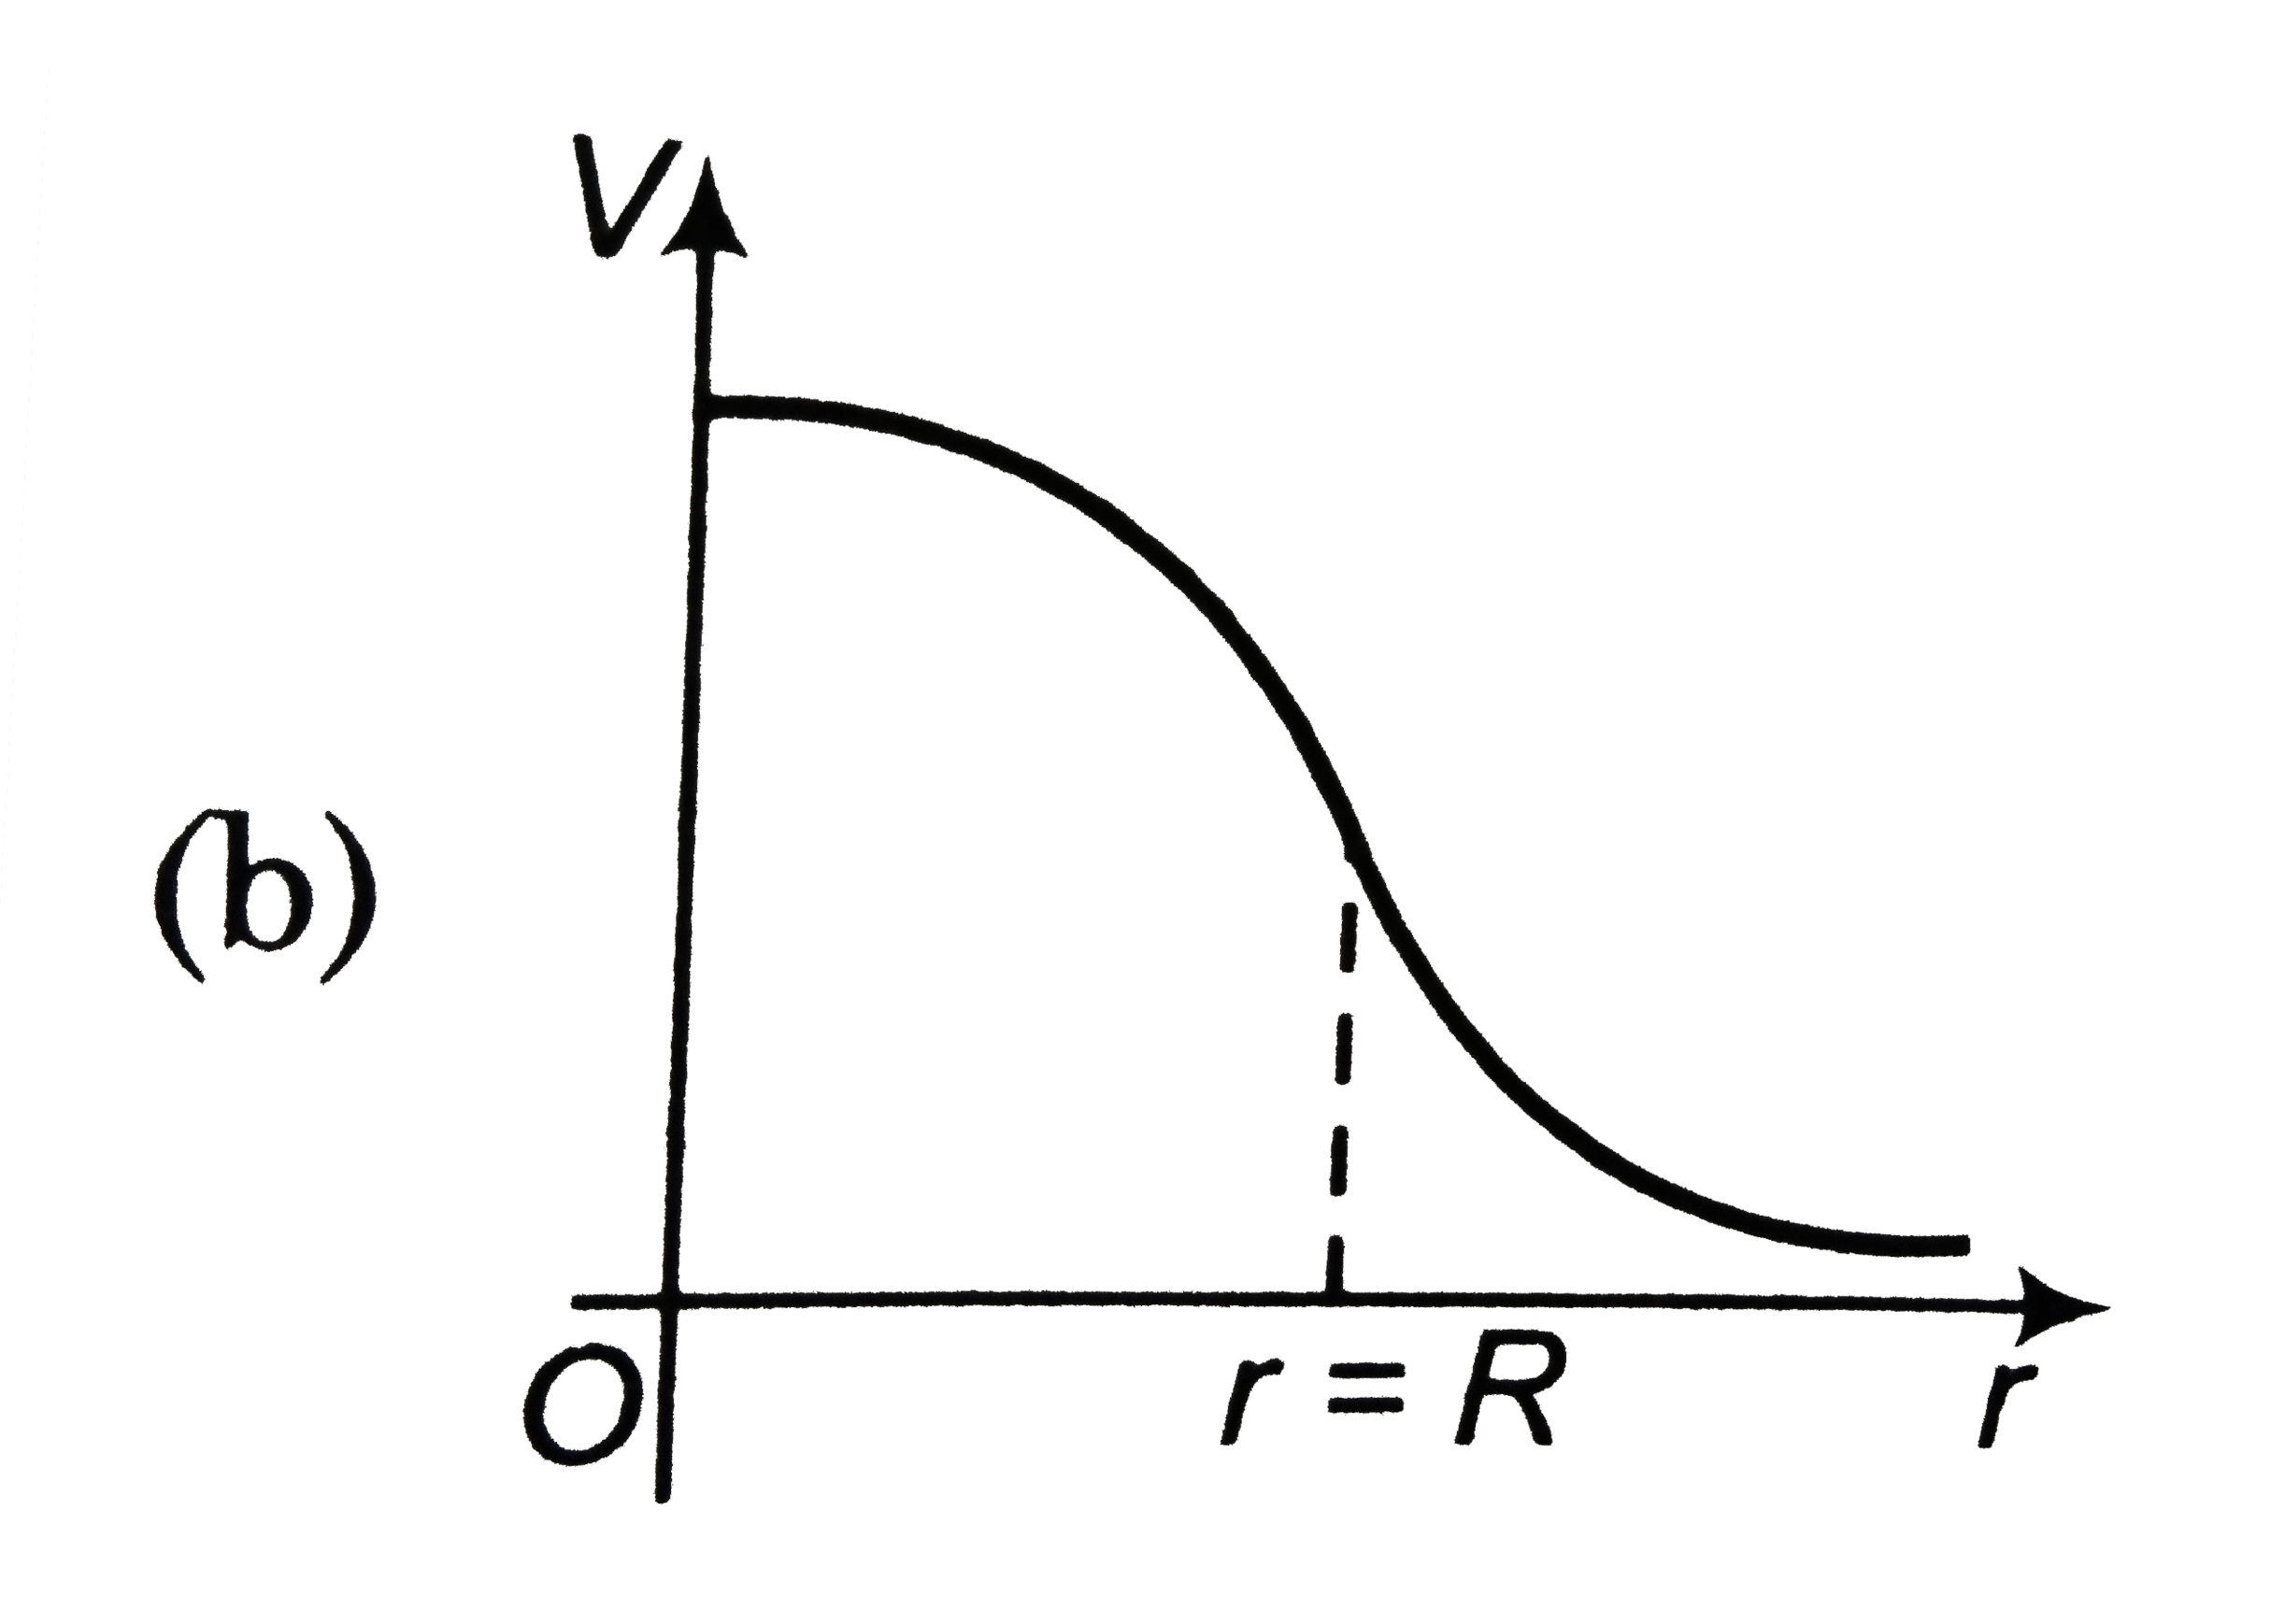 C
C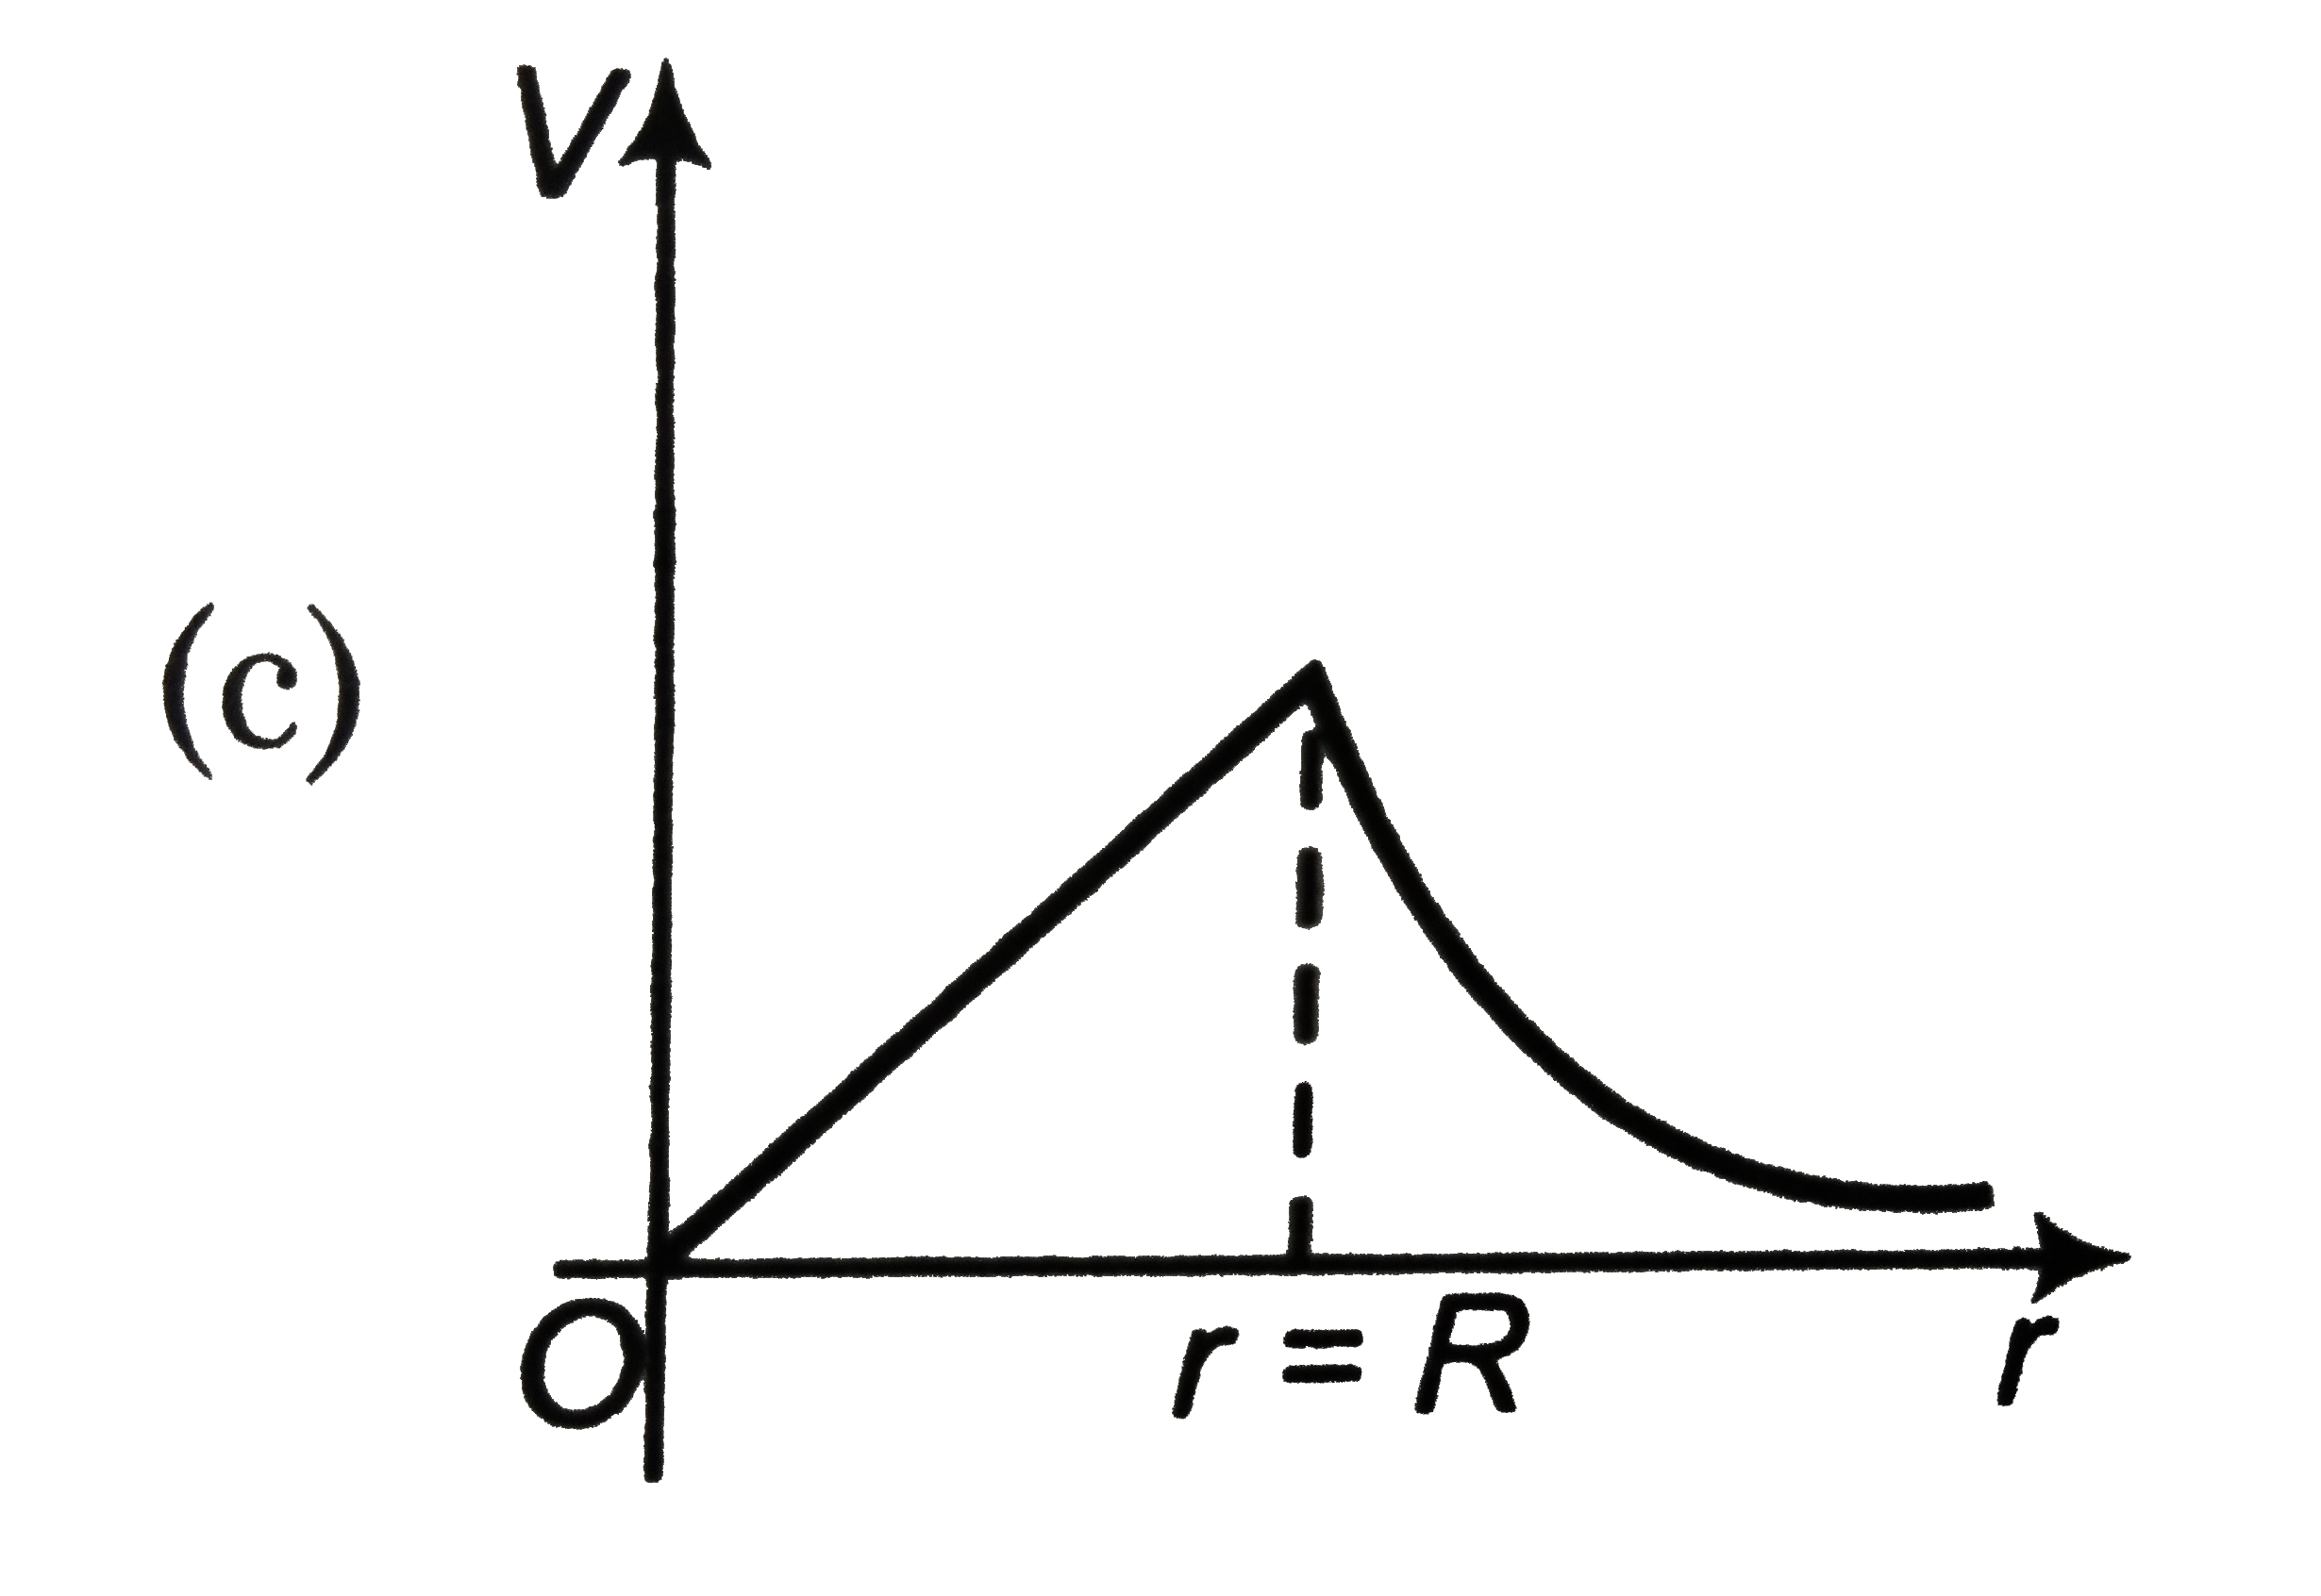 DNone of these
The magnitude of gravitational potential energy of a body at a distance r from the centre of earth is u. Its weight at a distance 2r from the centre of earth is
AurBu4rCu2rD4ruFollowing curve shows the variation of intesity of gravitational field (→I) with distance from the centre of solid sphere(r) :
A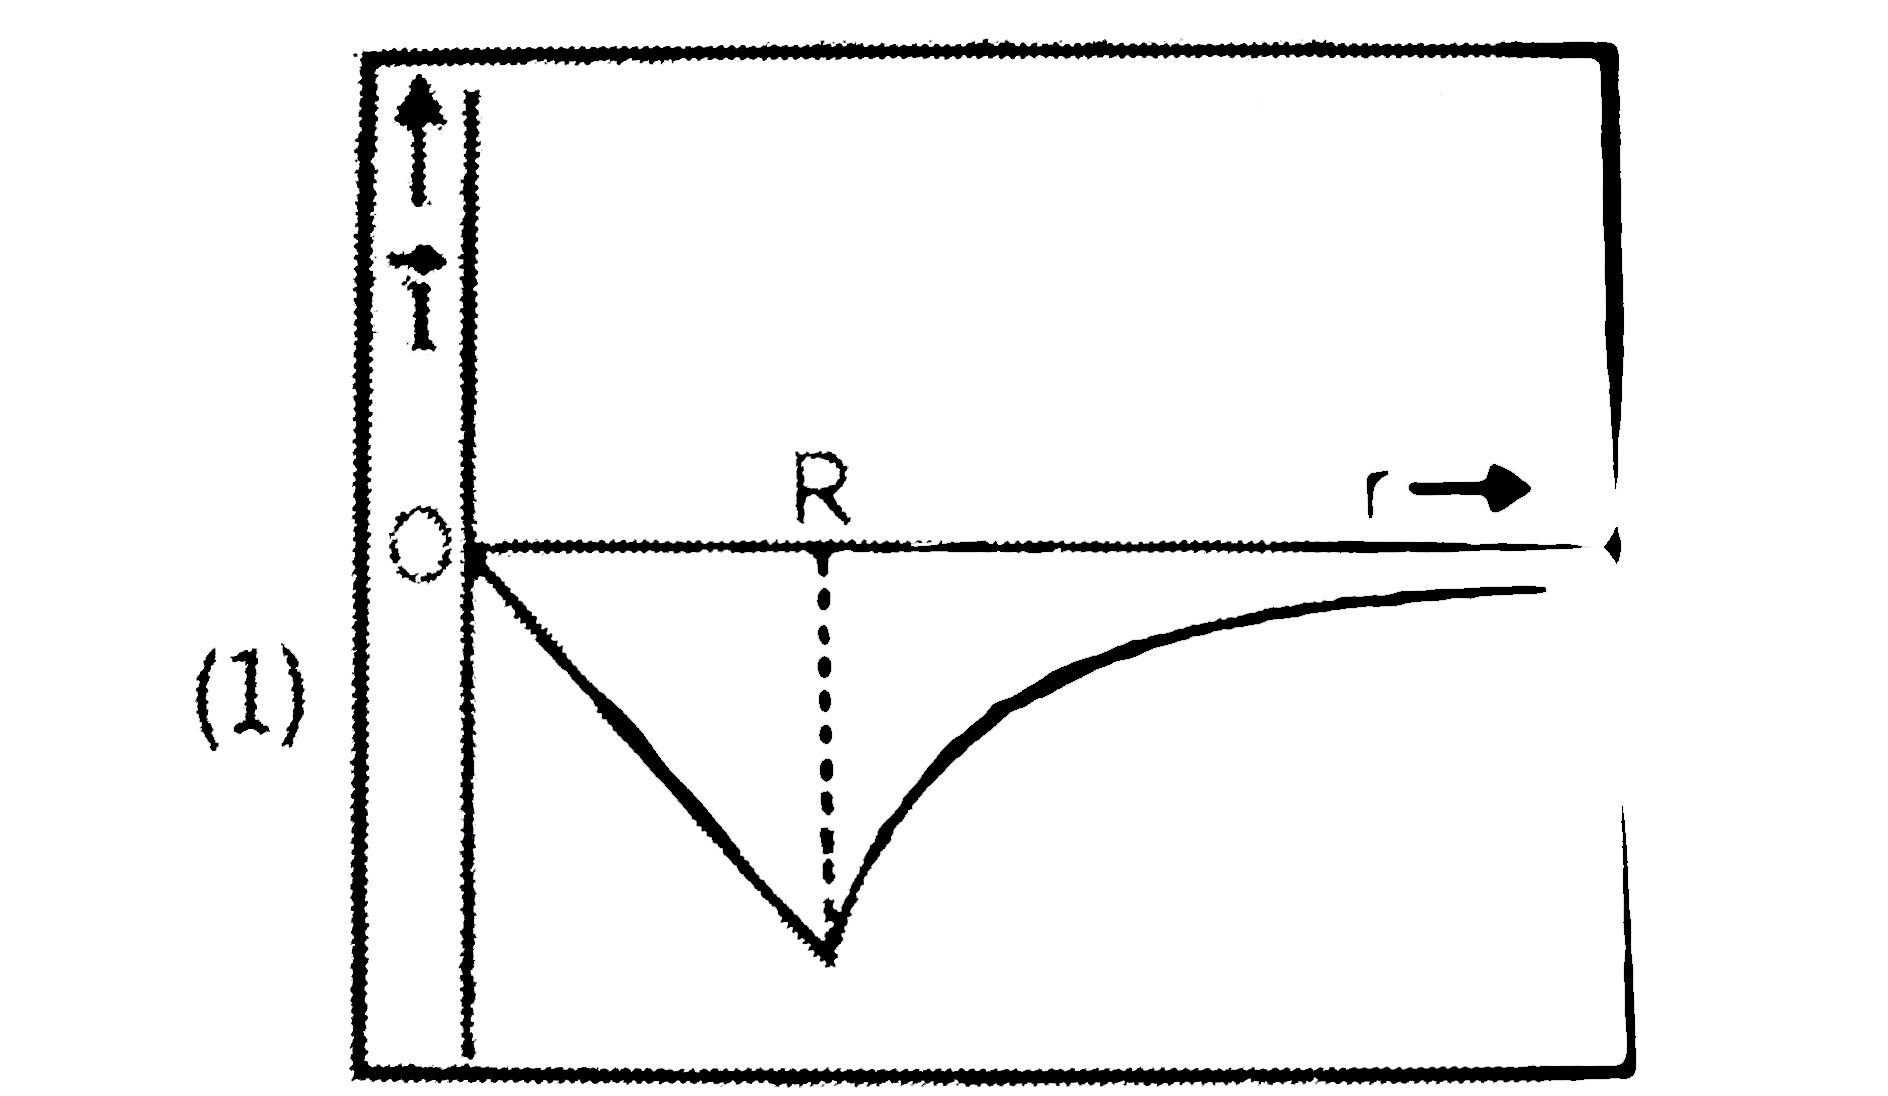 B
B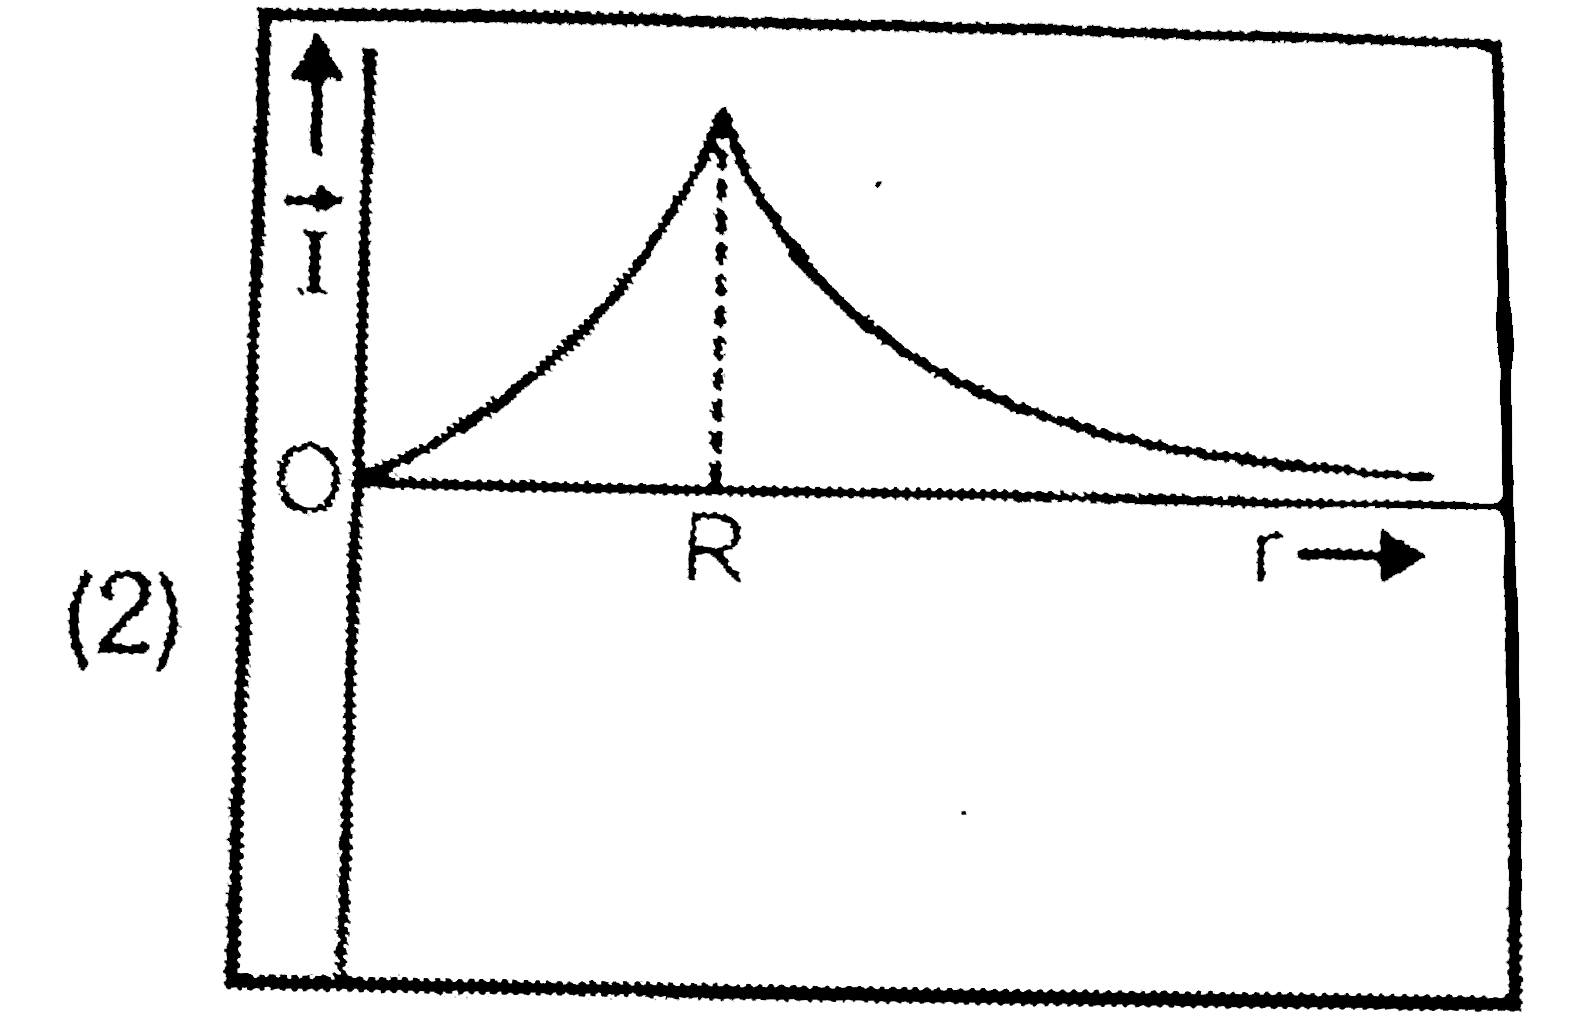 C
C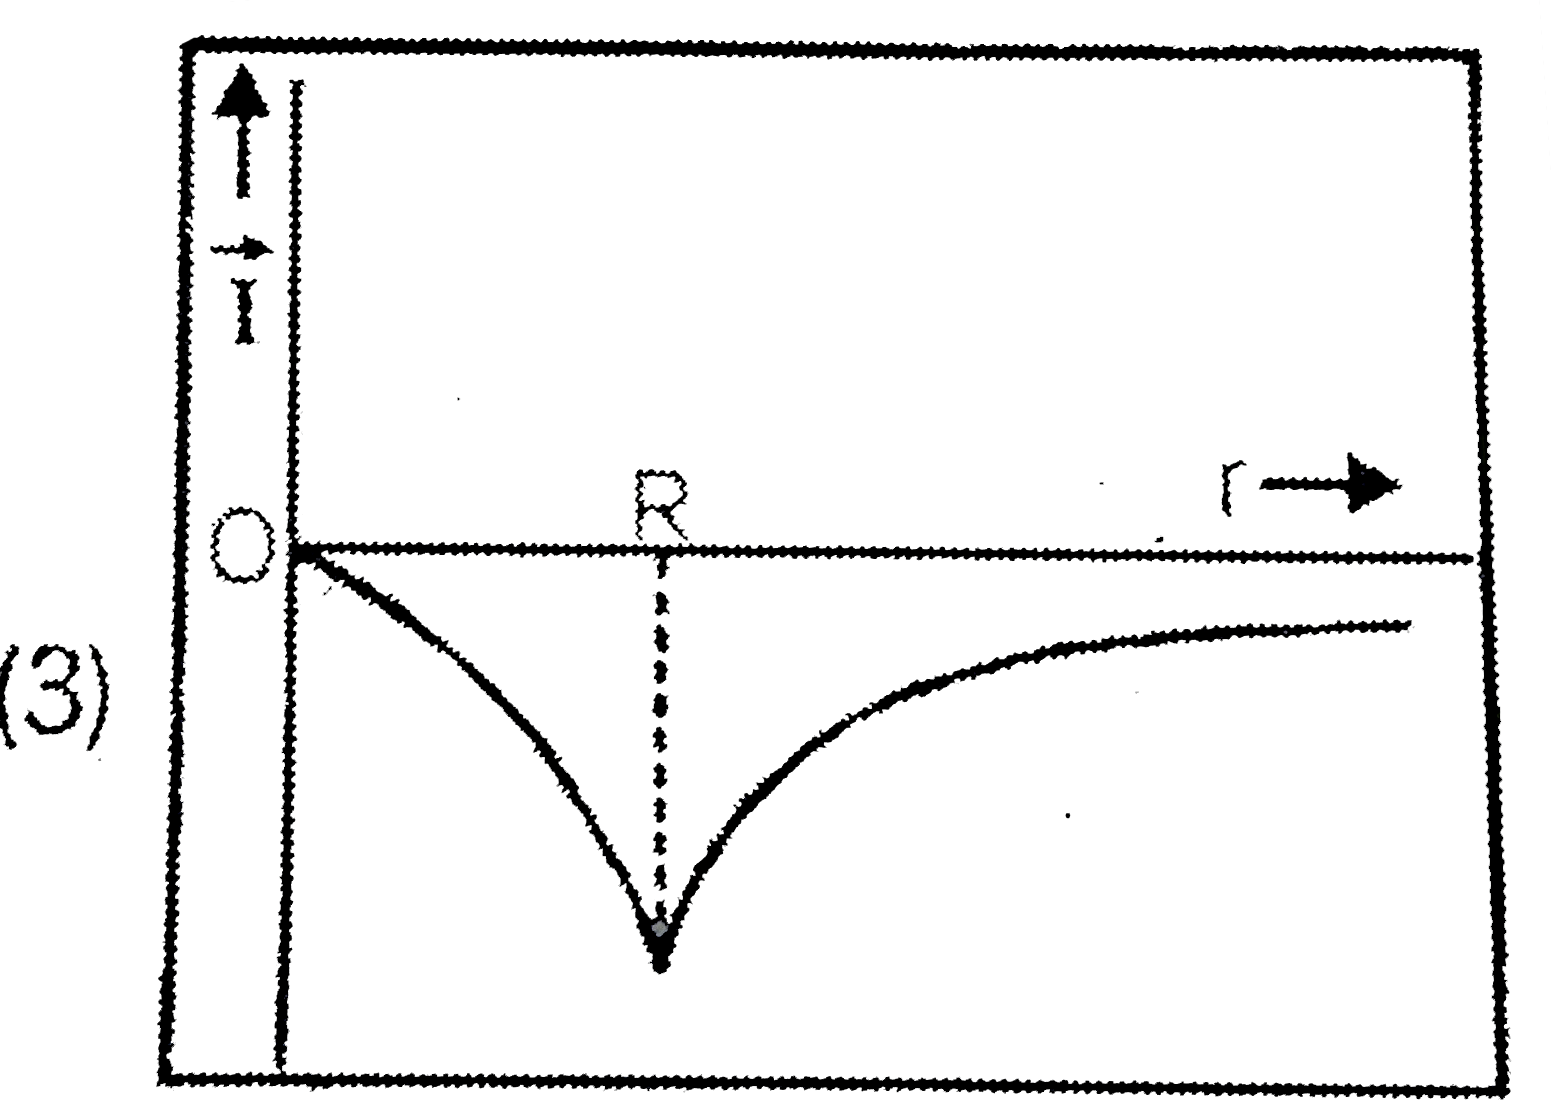 D
D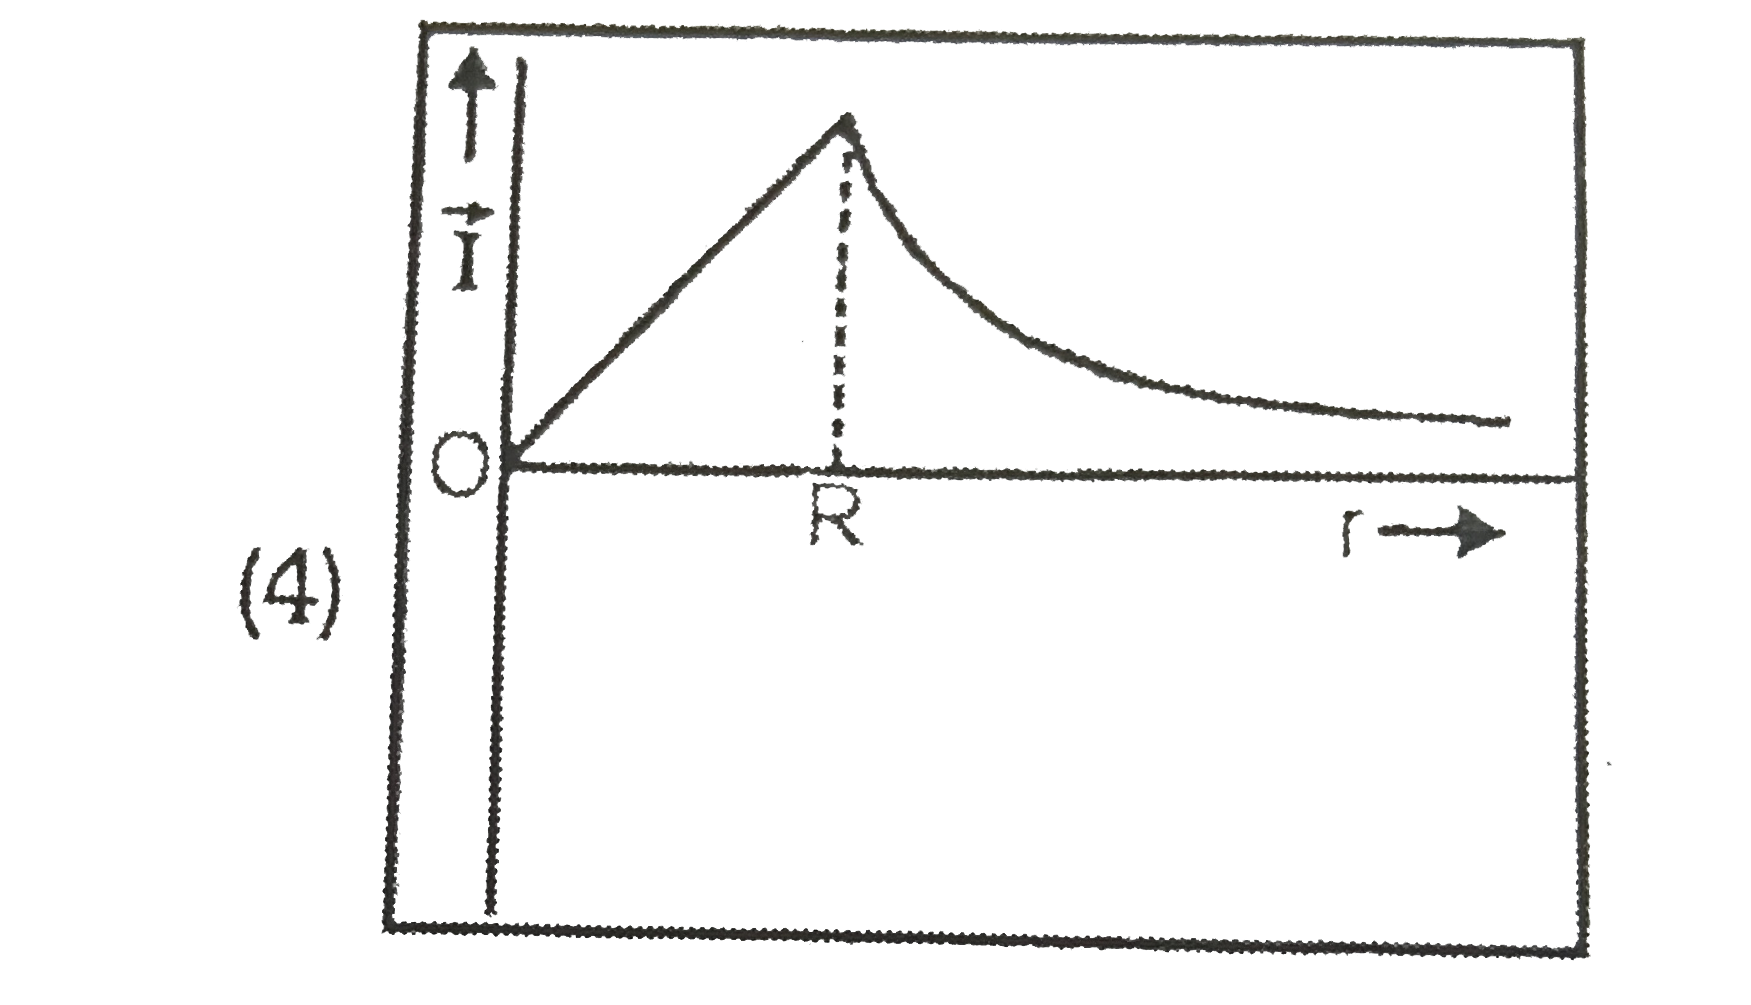
Dependence of intensity of gravitational field (E) of earth with distance (r) from centre of earth is correctly represented by
View SolutionThe gravitational potential due to the earth is minimum at
View SolutionThe acceleration due to gravity is g at a point distant r from the centre of earth of radius R. If r<R, then
View SolutionWhich graph correctly presents the variation of acceleration due to gravity with the distance form the centre of the earth?
View SolutionThe intensity of gravitational field at a point situated at a distance of 8000km form the centre of the earth is 6/kg. The gravitational potential at that point is -(in joule /kg)
View Solution
