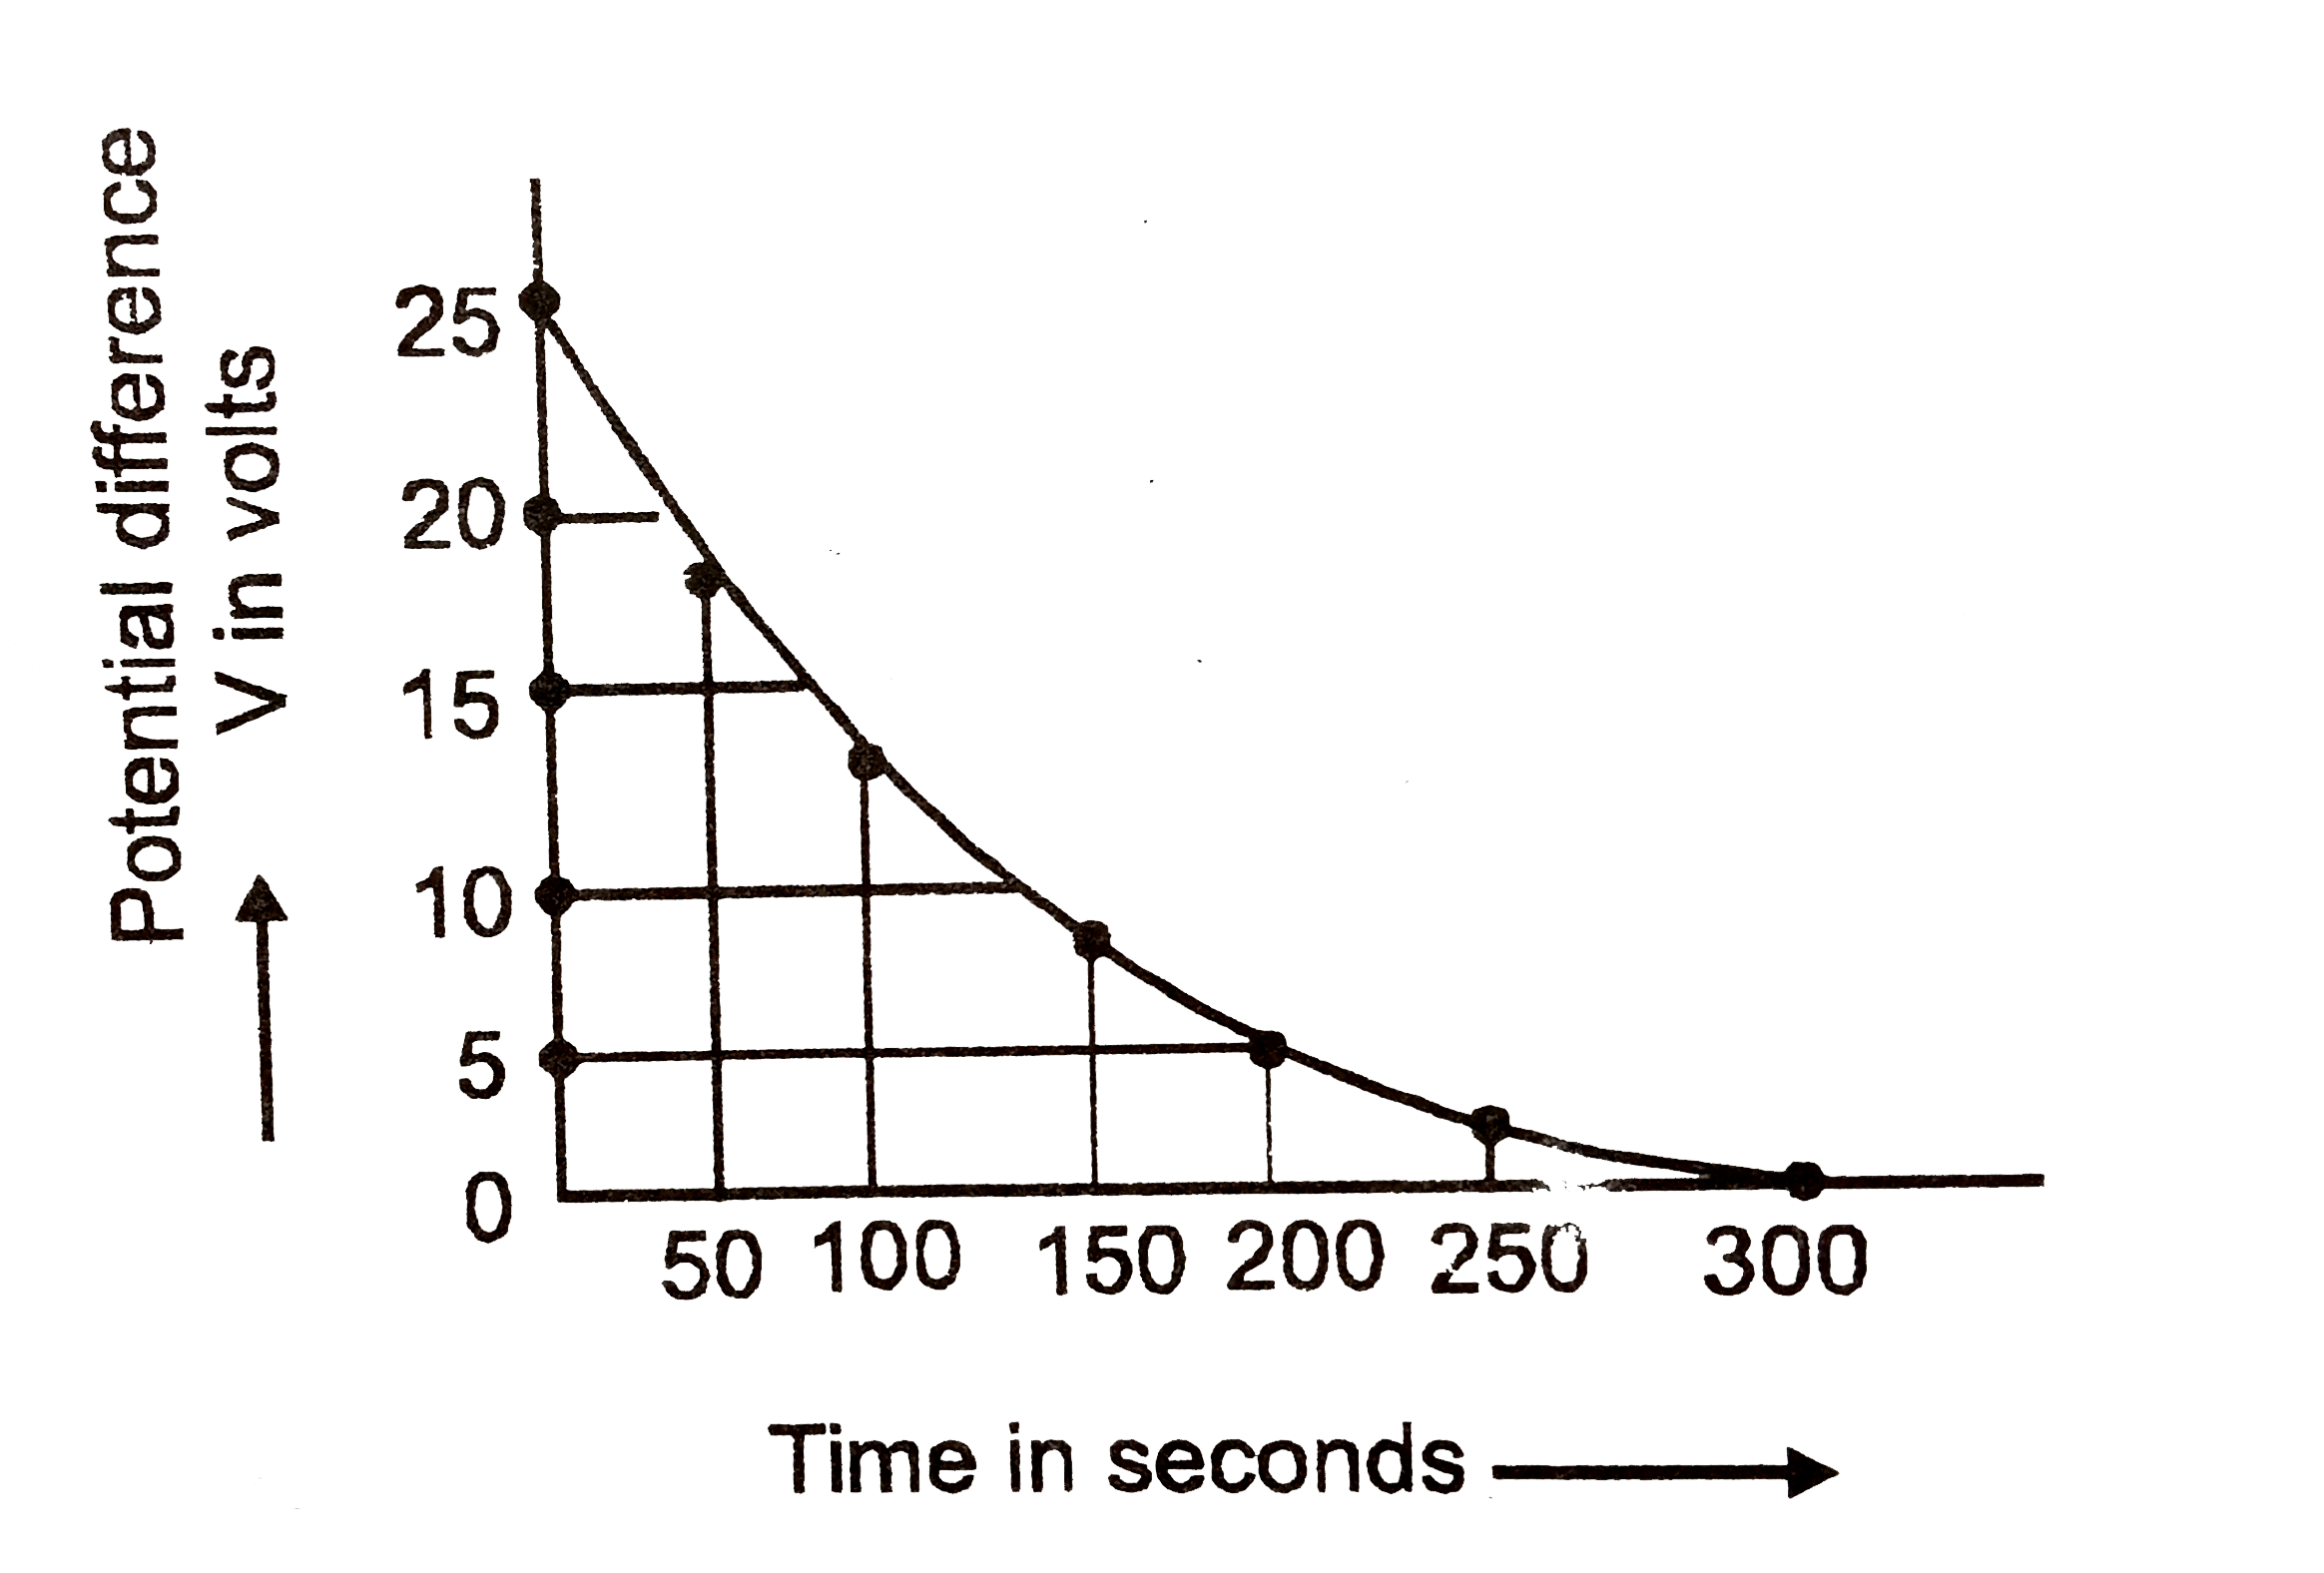
The figure shows an experimental plot discharging of a capacitor in an RC circuit. The time constant of this circuit lies between:
A
50 sec and 100 sec
B
100 sec and 150 sec
C
150 sec and 200 sec
D
0 and 50 sec
Video Solution
Text Solution
The correct Answer is:B
|
Answer
Step by step video & text solution for The figure shows an experimental plot discharging of a capacitor in an RC circuit. The time constant of this circuit lies between: by Physics experts to help you in doubts & scoring excellent marks in Class 12 exams.
Updated on:21/07/2023Topper's Solved these Questions
- Capacitance BOOK - MOTIONCHAPTER - Capacitance EXERCISE - EXERCISE -4 LEVEL II
19 Videos
- Capacitance BOOK - MOTIONCHAPTER - Capacitance EXERCISE - EXERCISE -3 LEVEL II
17 Videos
- CALORIMETRY BOOK - MOTIONCHAPTER - CALORIMETRY EXERCISE - EXERCISE - 3 Section - B
4 Videos
- CENTRE OF MASSBOOK - MOTIONCHAPTER - CENTRE OF MASSEXERCISE - Exercise - 4 Level-II
20 Videos
Similar Questions
Knowledge Check
The time constant of the circuit shown is
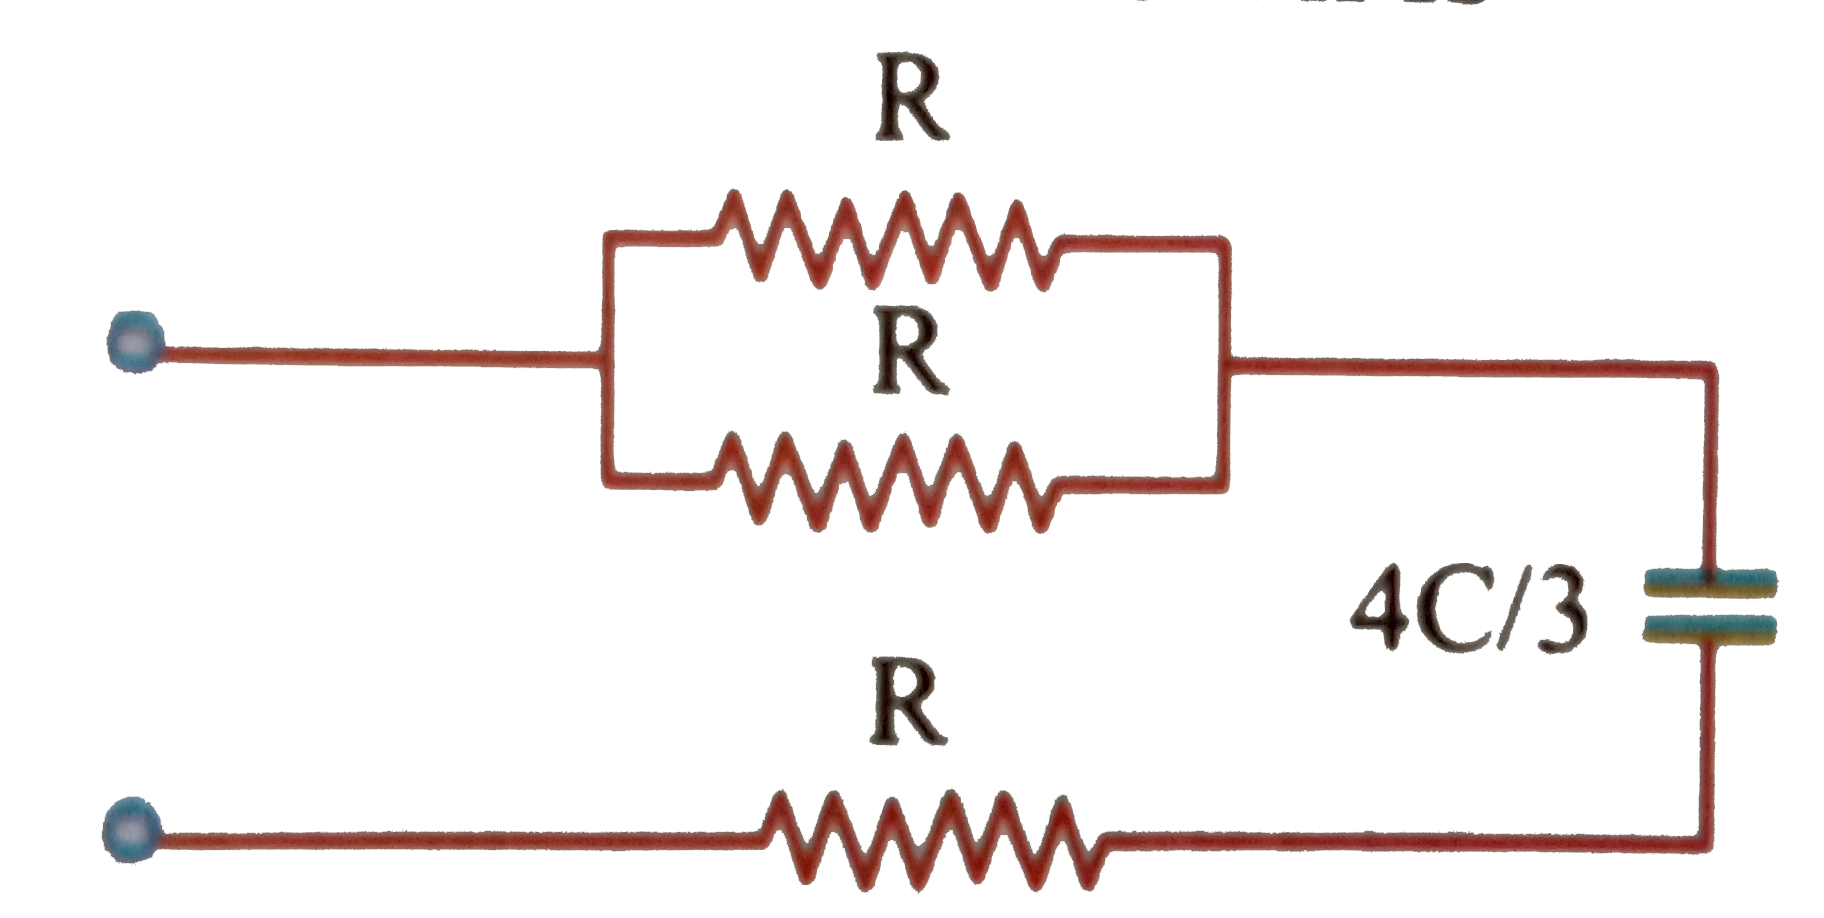 ARCB2RCC3RCD4RC
The time constant for the given circuit is
 A4sB1/4sC2sD1/2s
The time constant of the circuit shown is :
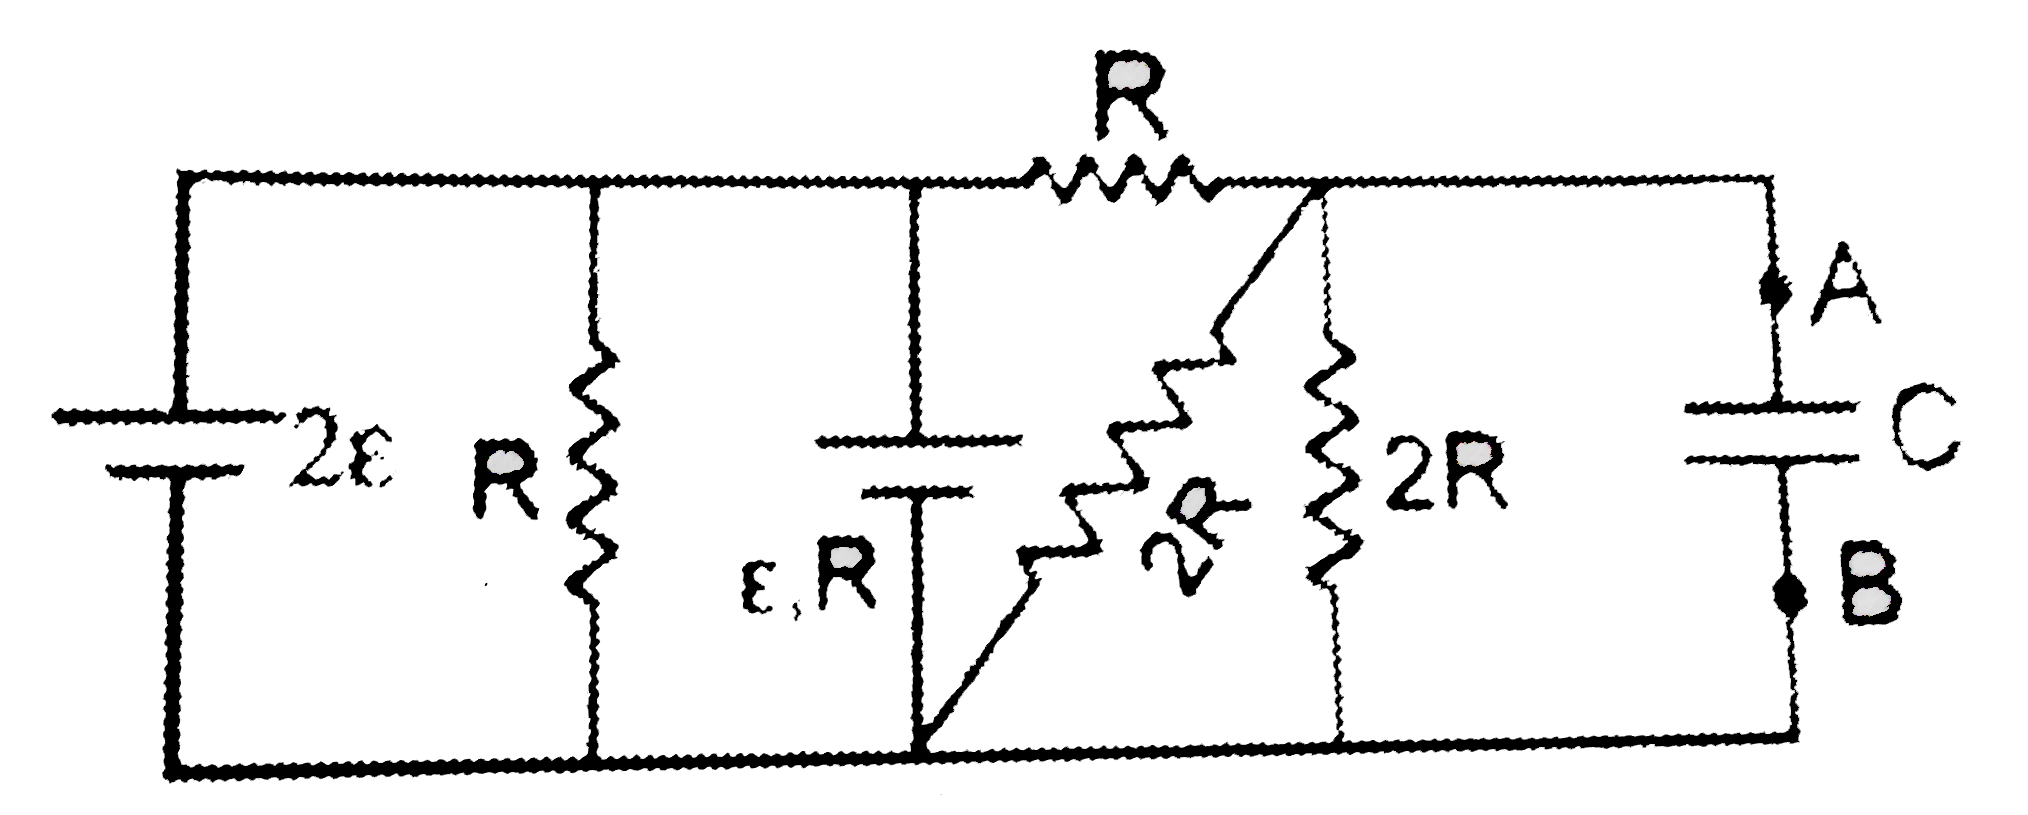 ARC2B3RC5CRC3DRC4
charging and discharging of capacitors in complex circuits
View SolutionTime constant of LR circuit will be
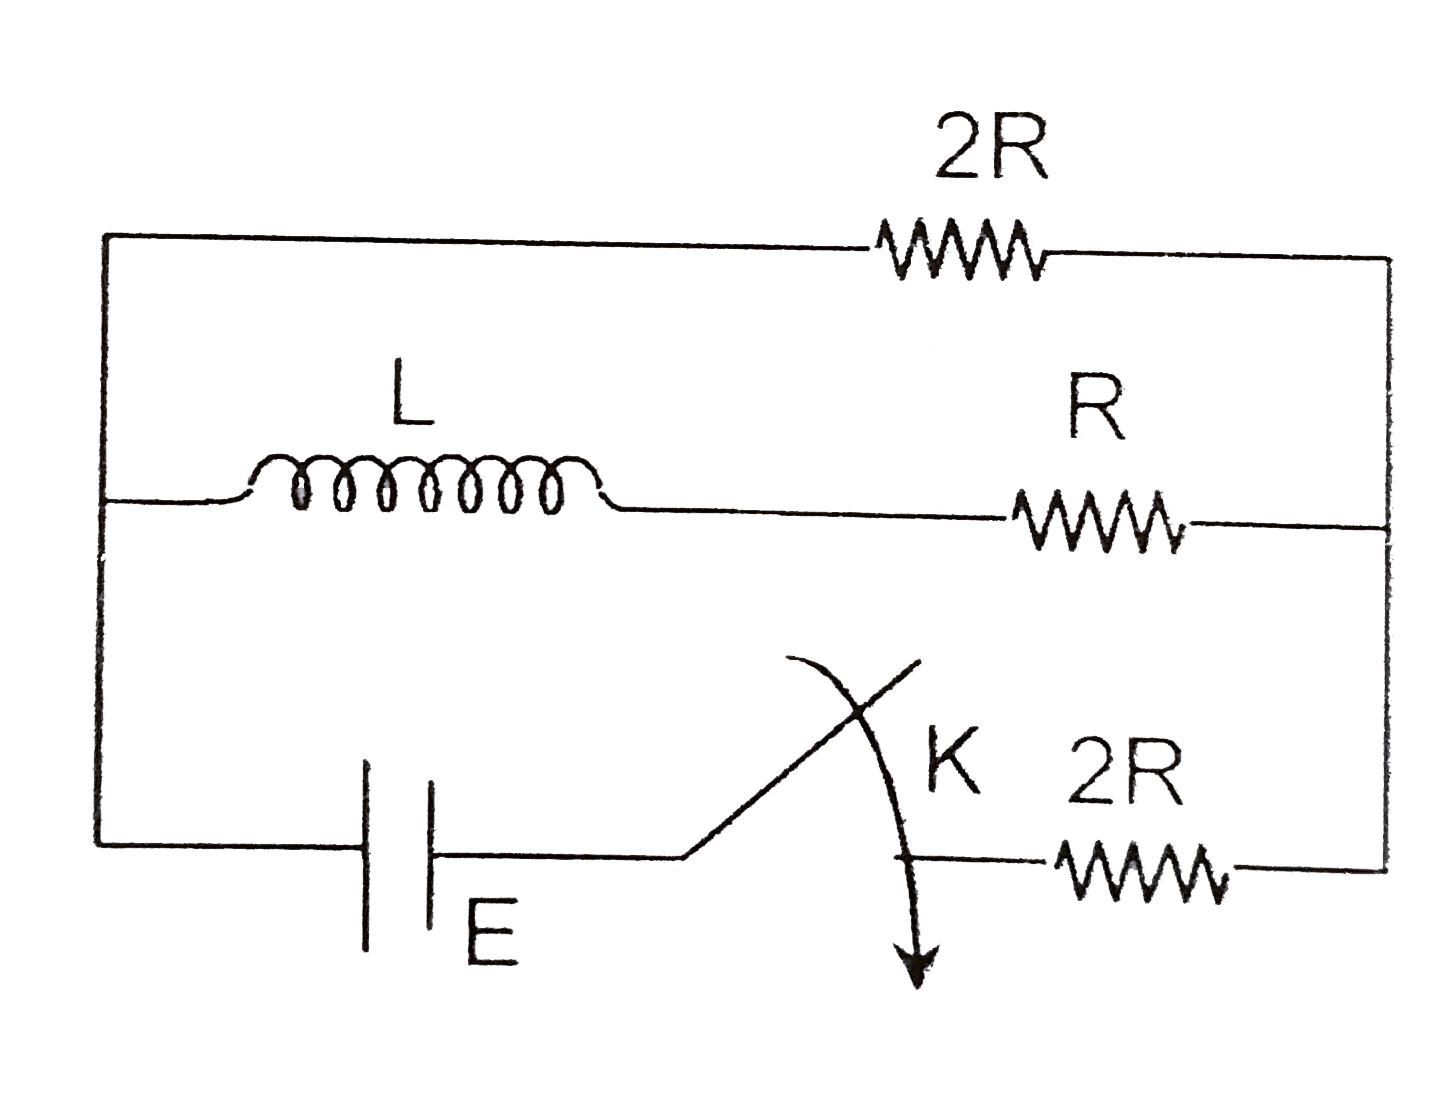
View SolutionThe figure shows an L−R circuit the time constant for the circuit is
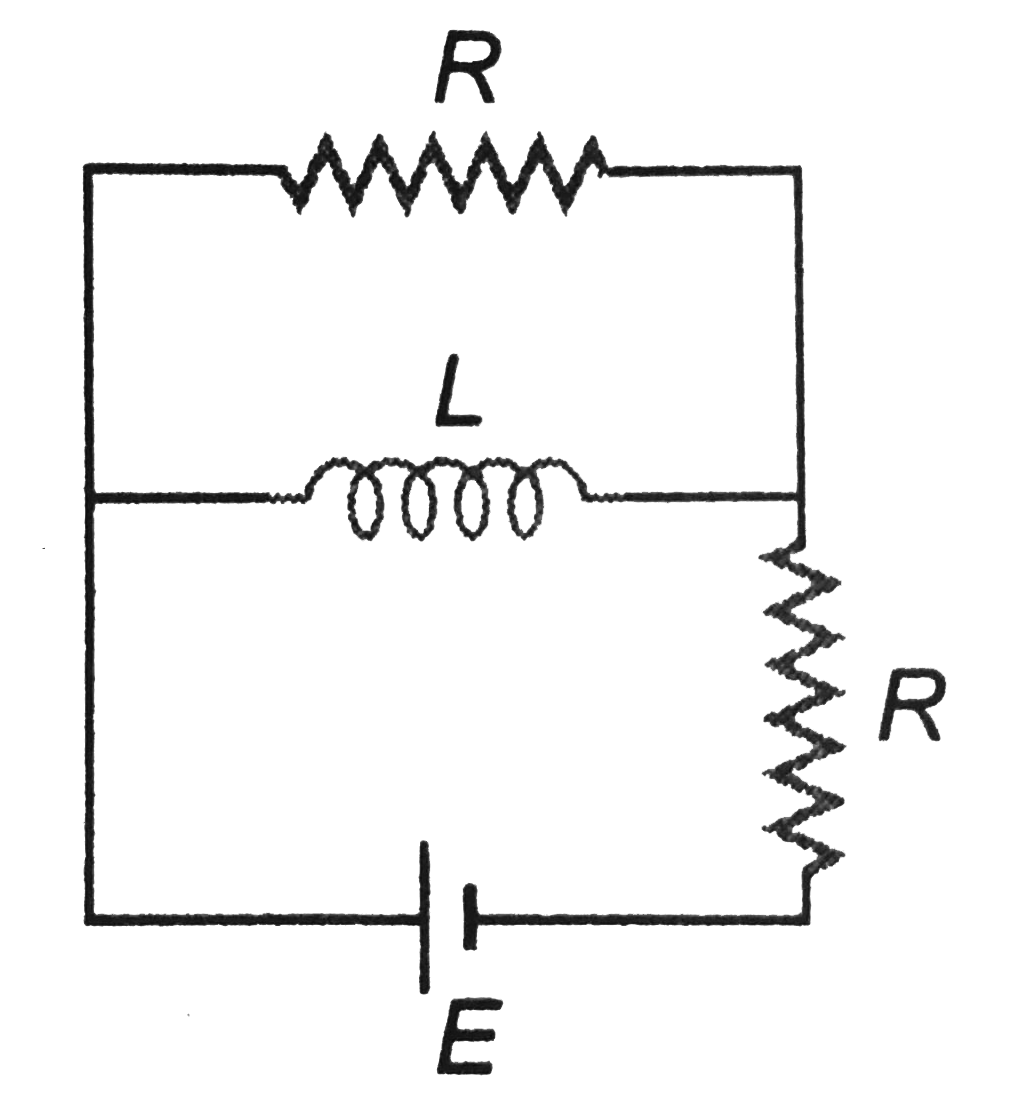
View SolutionThe time constant of the circuit shown in the figure is
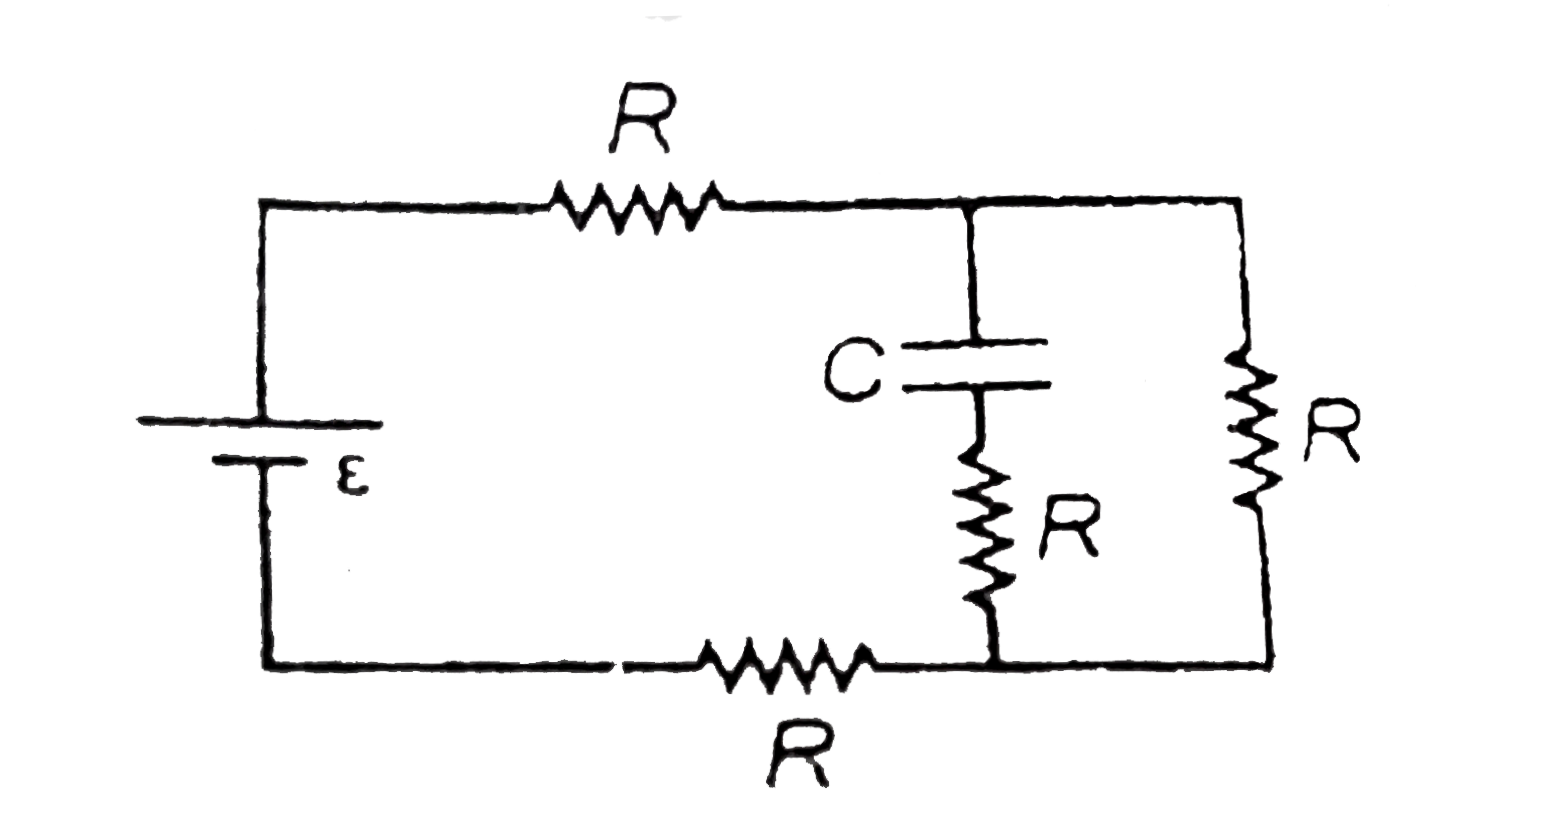
View SolutionThe time constant of the circuit shown in the figure is
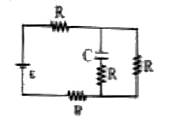
View Solution