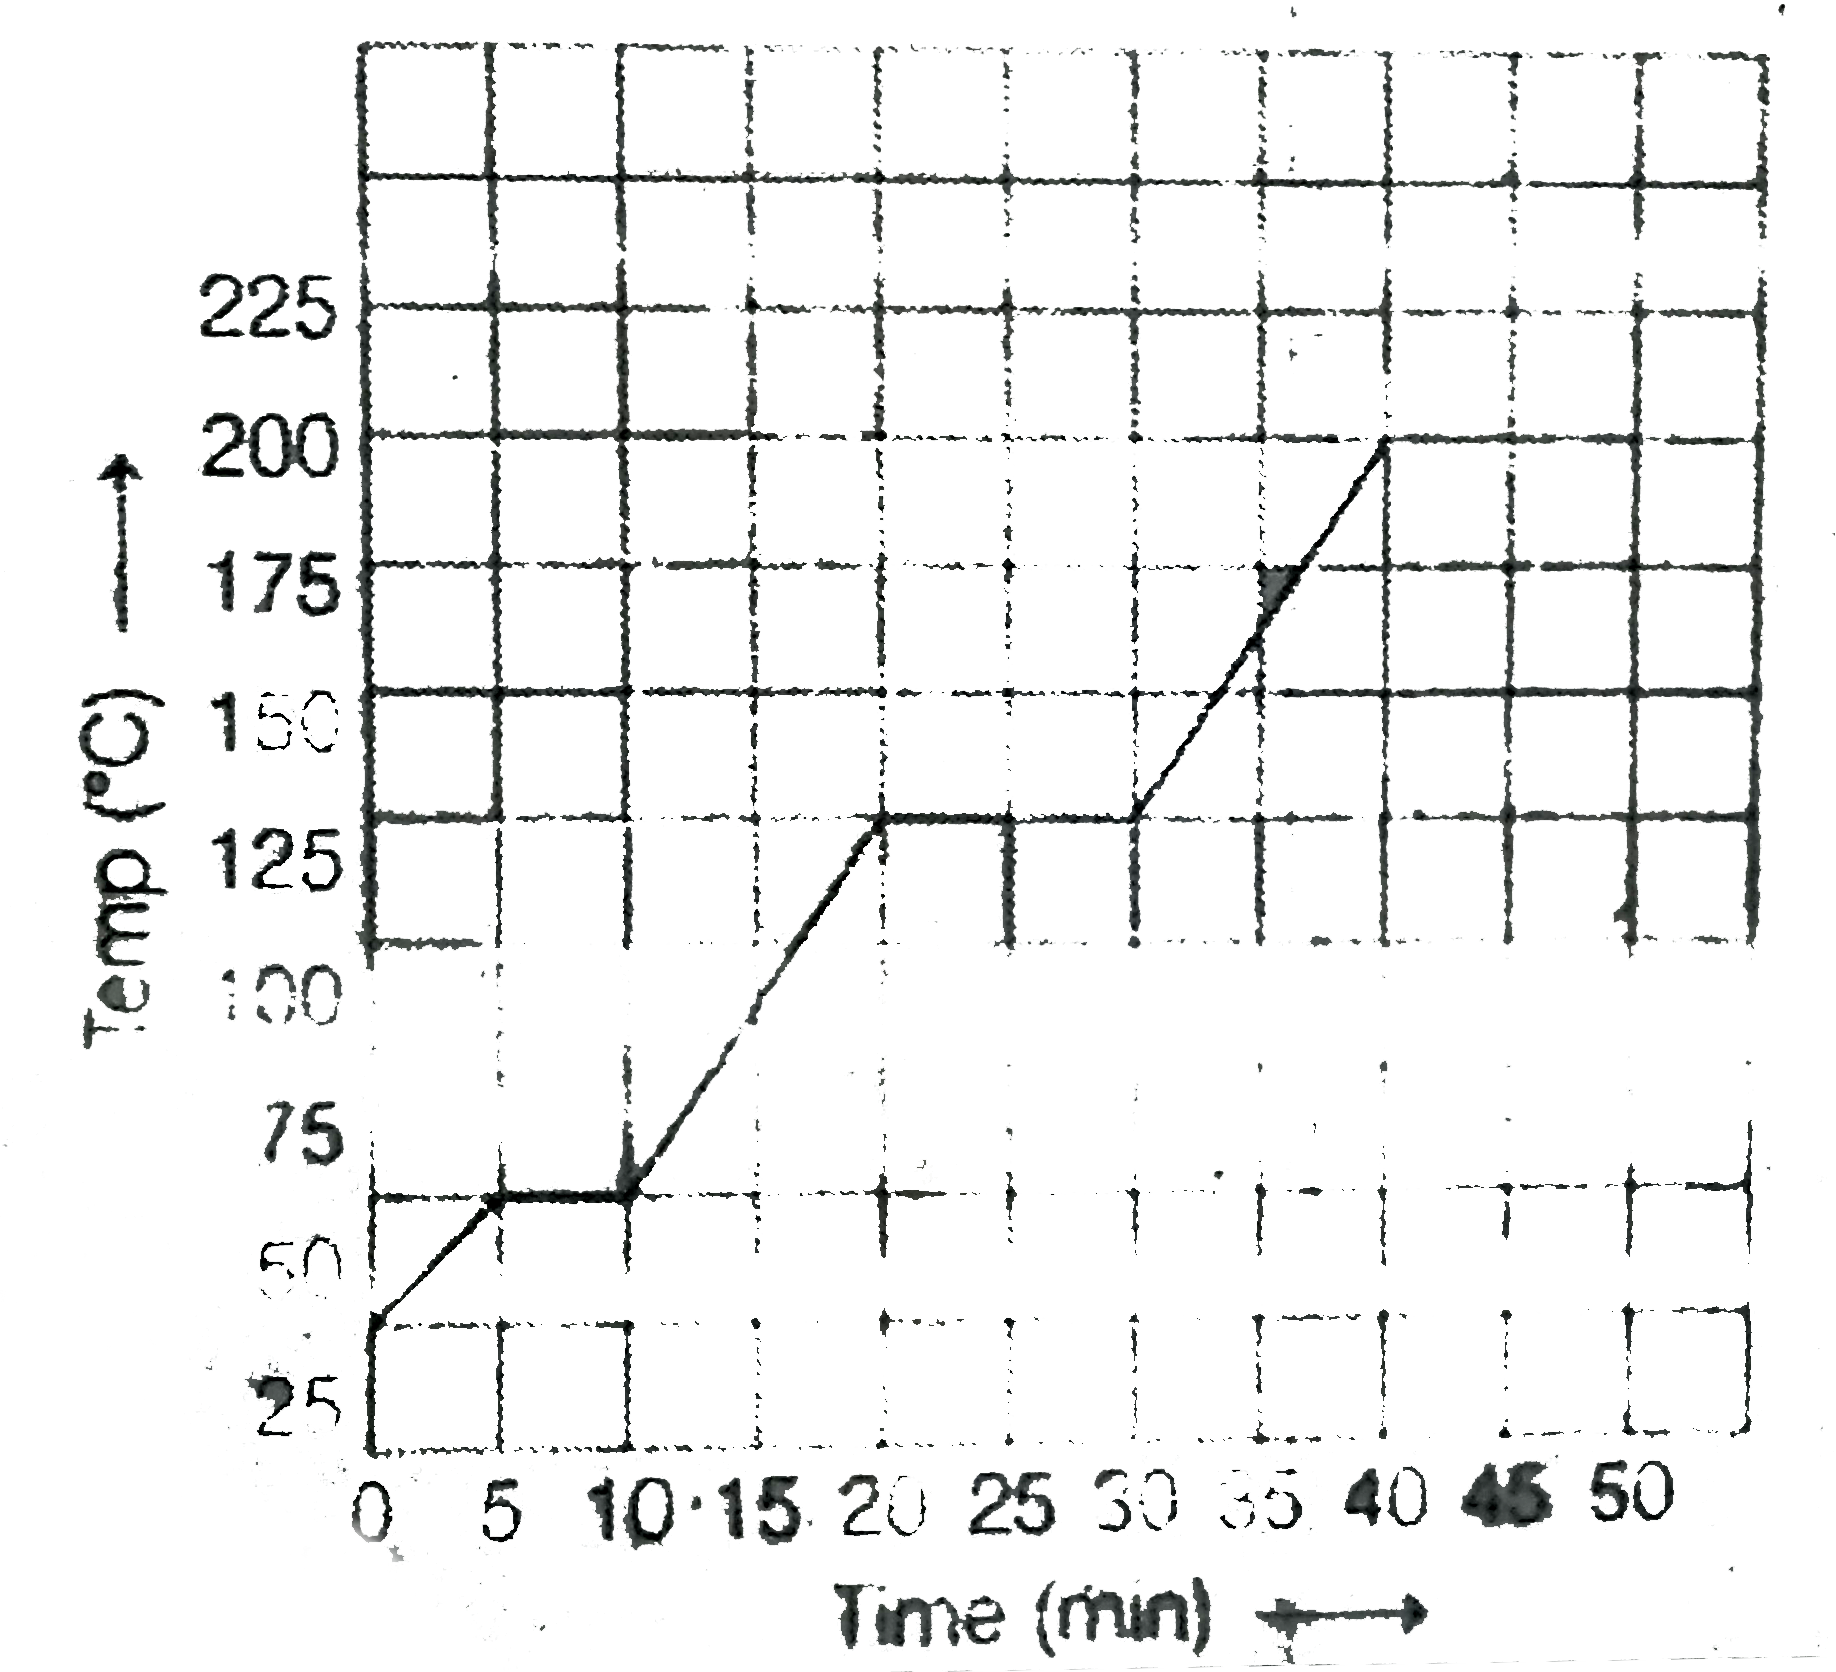
The graph shown in the figure represents change in the temperature of 5 kg of a substance as it absorbs heat at a costant rate of 42 kJ min−1. The latent heat of vaporization of the substance is :

630kJkg−1
126kJkg−1
84kJkg−1
12.6kJkg−1
The correct Answer is:C
Step by step video & image solution for The graph shown in the figure represents change in the temperature of 5 kg of a substance as it absorbs heat at a costant rate of 42 kJ "min"^(-1). The latent heat of vaporization of the substance is : by Physics experts to help you in doubts & scoring excellent marks in Class 12 exams.
Topper's Solved these Questions
- BOOK - MOTIONCHAPTER - HEAT - 1EXERCISE - EXERCISE -2 (Level - I) Objective Problems | JEE Main24videos
HEAT - 1
- BOOK - MOTIONCHAPTER - HEAT - 1EXERCISE - EXERCISE -2 (Level - II) Multiple Correct | JEE Advanced16videos
HEAT - 1
- BOOK - MOTIONCHAPTER - HEAT - 1EXERCISE - EXERCISE -4 (Level - II) Previous Year | JEE Advanced22videos
HEAT - 1
- BOOK - MOTIONCHAPTER - GRAVITATIONEXERCISE - Exercise - 4 Section - B Previous Years Problems15videos
GRAVITATION
- BOOK - MOTIONCHAPTER - HEAT TRANSFER & THERMAL EXPANSION EXERCISE - Exercise - 3 Section-B19videos
HEAT TRANSFER & THERMAL EXPANSION
Similar Questions
Knowledge Check
- Question 1 - Select One
The quantity of heat required to change the temperature of 1 kg of substance by 1∘––C in called its
ASpecific heatBthe total energyCthe latent -heatDheat of fusion - Question 2 - Select One
Heat required to raise the temperature of 1 mole of a substance by 1∘ C is called
ASpecific heatBMolar heat capacityCWater equivalentDSpecific gravity - Question 3 - Select One
Heat required to raise the temperature of 1 mole of a substance by 1∘ C is called
ASpecific heatBMolar heat capacityCWater equivalentDSpecific gravity
How will you explain the role of latent heat in the change of state of a substance?
View Solution
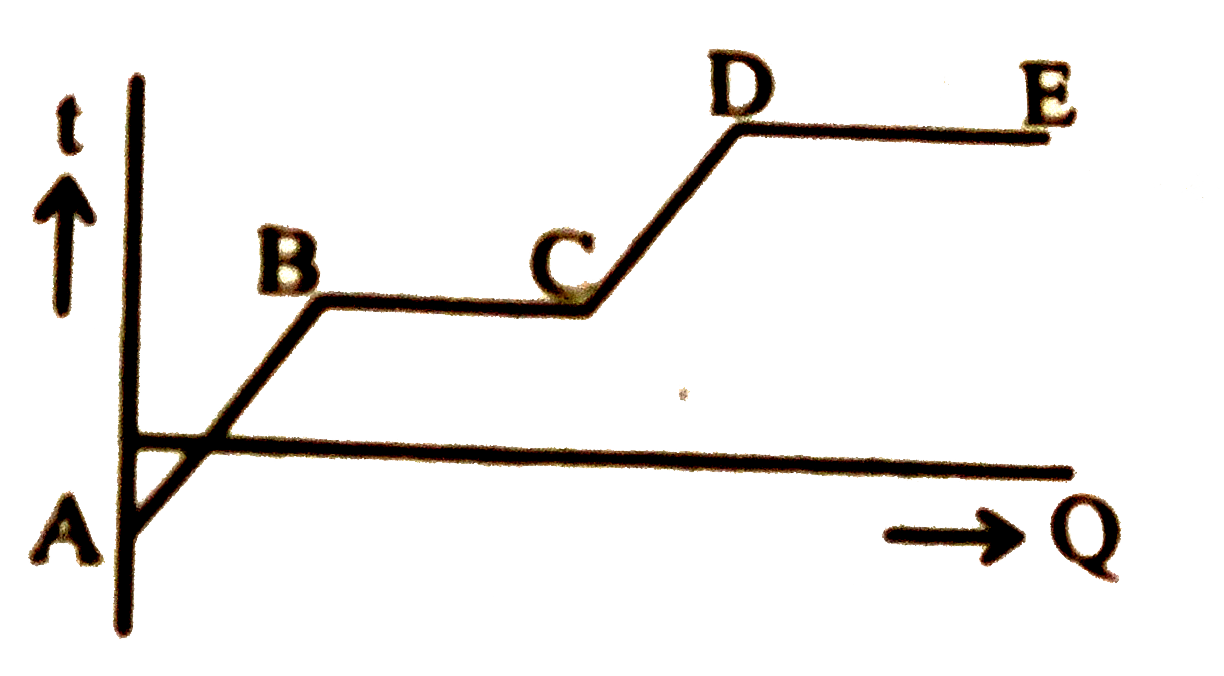
The graph given above indicates change in temperature (Δt) when heat (Q) was given to a substance. Which among the following parts of the graph correctly depict the latent heat of the substance?View SolutionThe amount of heat required to change the state of 1 kg of substance at constant temperature is called
View SolutionA ginven substance of mass 'm' is in solid state at certain temperature. Arrange the following steps in proper sequence to calcualte the total heat energy required to just convert the substance completely into gaseous state.
(a). Note down the specific latent heat of vaporization of the substance and calculate the heat supplied to convert from liquid to gaseous state using the formula.
(b) Note down the melting point of the substance and calculate the heat supplied to increase the temperature of the solid to its melting point.
(c) Note down the boiling point of the substance and calculate the heat supplied to increase the temperature of the substance from melting point to its boiling point.
(d). Add all the heat energies, it gives the resultant hea supplied to the solid to just convert it into gaseous state.
(e) Note down the specific latent heat of fusion of the substance and calculate the heat supplied to convert the substance from solid state to liquid state.View SolutionThe amount of heat required to raise the temperature of a substance through 1∘C is called
View Solution
