A particle of mass 1kg is udnergoing S.H.M., for which graph between force and displacement (from mean position) as shown.
Its time period, in seconds, is-

π/3
2π/3
π/6
3/π
The correct Answer is:B
Step by step video & image solution for A particle of mass 1 kg is udnergoing S.H.M., for which graph between force and displacement (from mean position) as shown. Its time period, in seconds, is- by Physics experts to help you in doubts & scoring excellent marks in Class 12 exams.
Related Playlists
- BOOK - MOTIONCHAPTER - SIMPLE HARONIC MOTION EXERCISE - EXERCISE -1 ( SECTION-B ) (Time per iod and angu larfrequency in SHM)8videos
SIMPLE HARONIC MOTION
- BOOK - MOTIONCHAPTER - SIMPLE HARONIC MOTION EXERCISE - EXERCISE -1 ( SECTION-C ) ( Two block system)6videos
SIMPLE HARONIC MOTION
- BOOK - MOTIONCHAPTER - SIMPLE HARONIC MOTION EXERCISE - EXERCISE -4 (Leve-II) [ JEE 2011]11videos
SIMPLE HARONIC MOTION
- BOOK - MOTIONCHAPTER - SIMPLE HARMONIC MOTIONEXERCISE - EXERCISE -3 Section - B Previous Year Problems | JEE MAIN23videos
SIMPLE HARMONIC MOTION
- BOOK - MOTIONCHAPTER - SOUND WAVESEXERCISE - Exercise - 3 (Section - B)14videos
SOUND WAVES
Similar Practice Problems
- Question 1 - Select One or More
The figure shows a graph between velocity and displacement (from mean position) of a particle performing SHM:
 Athe time period of the particle is 1.57sBthe maximum acceleration will be 40cm/s2Cthe velocity of particle is 2√21cm/s when it is at a distance 1cm from the mean position.Dnone of these
 - Question 1 - Select One
Graph between velocity and displacement of a particle, executing S.H.M. is
AA straight lineBA parabolaCA hyperbolaDAn ellipse - Question 1 - Select One
The displacement of a particle in S.H.M. in one time period is
AAB2AC4ADZero - Question 1 - Select One
The graph between total energy and displacement of a particle performing S.H.M. is
AparabolaBstraight lineCellipseDcircle - Question 1 - Select One
Statement-I : For a particle of mass 1kg, executing S.H.M., if slope of restoring force vs displacement graph is =−1, then the time period of oscillation with be 6.28s.
Statement-II : If 1kg mass is replaced by 2kg mass and rest of the information remains same as in statement-1, then the time period of oscillation with remain 6.28s.AStatement-I is true, Statement-Ii is true, Statement-II is a correct explanation for Statement-I.BStatement-I is true, Statement-II is true, Statement-II is NOT a correct explanantion for Statement-I.CStatement-I is true, Statement-II is falseDStatement-I is false, Statement-II is true - Question 1 - Select One
The graph between kinetic energy and displacement of a particle performing S.H.M. is
AparabolaBstraight lineCellipseDcircle - Question 1 - Select One
The graph between potential energy and displacement of a particle performing S.H.M. is
AparabolaBstraight lineCellipseDcircle - Question 1 - Select One
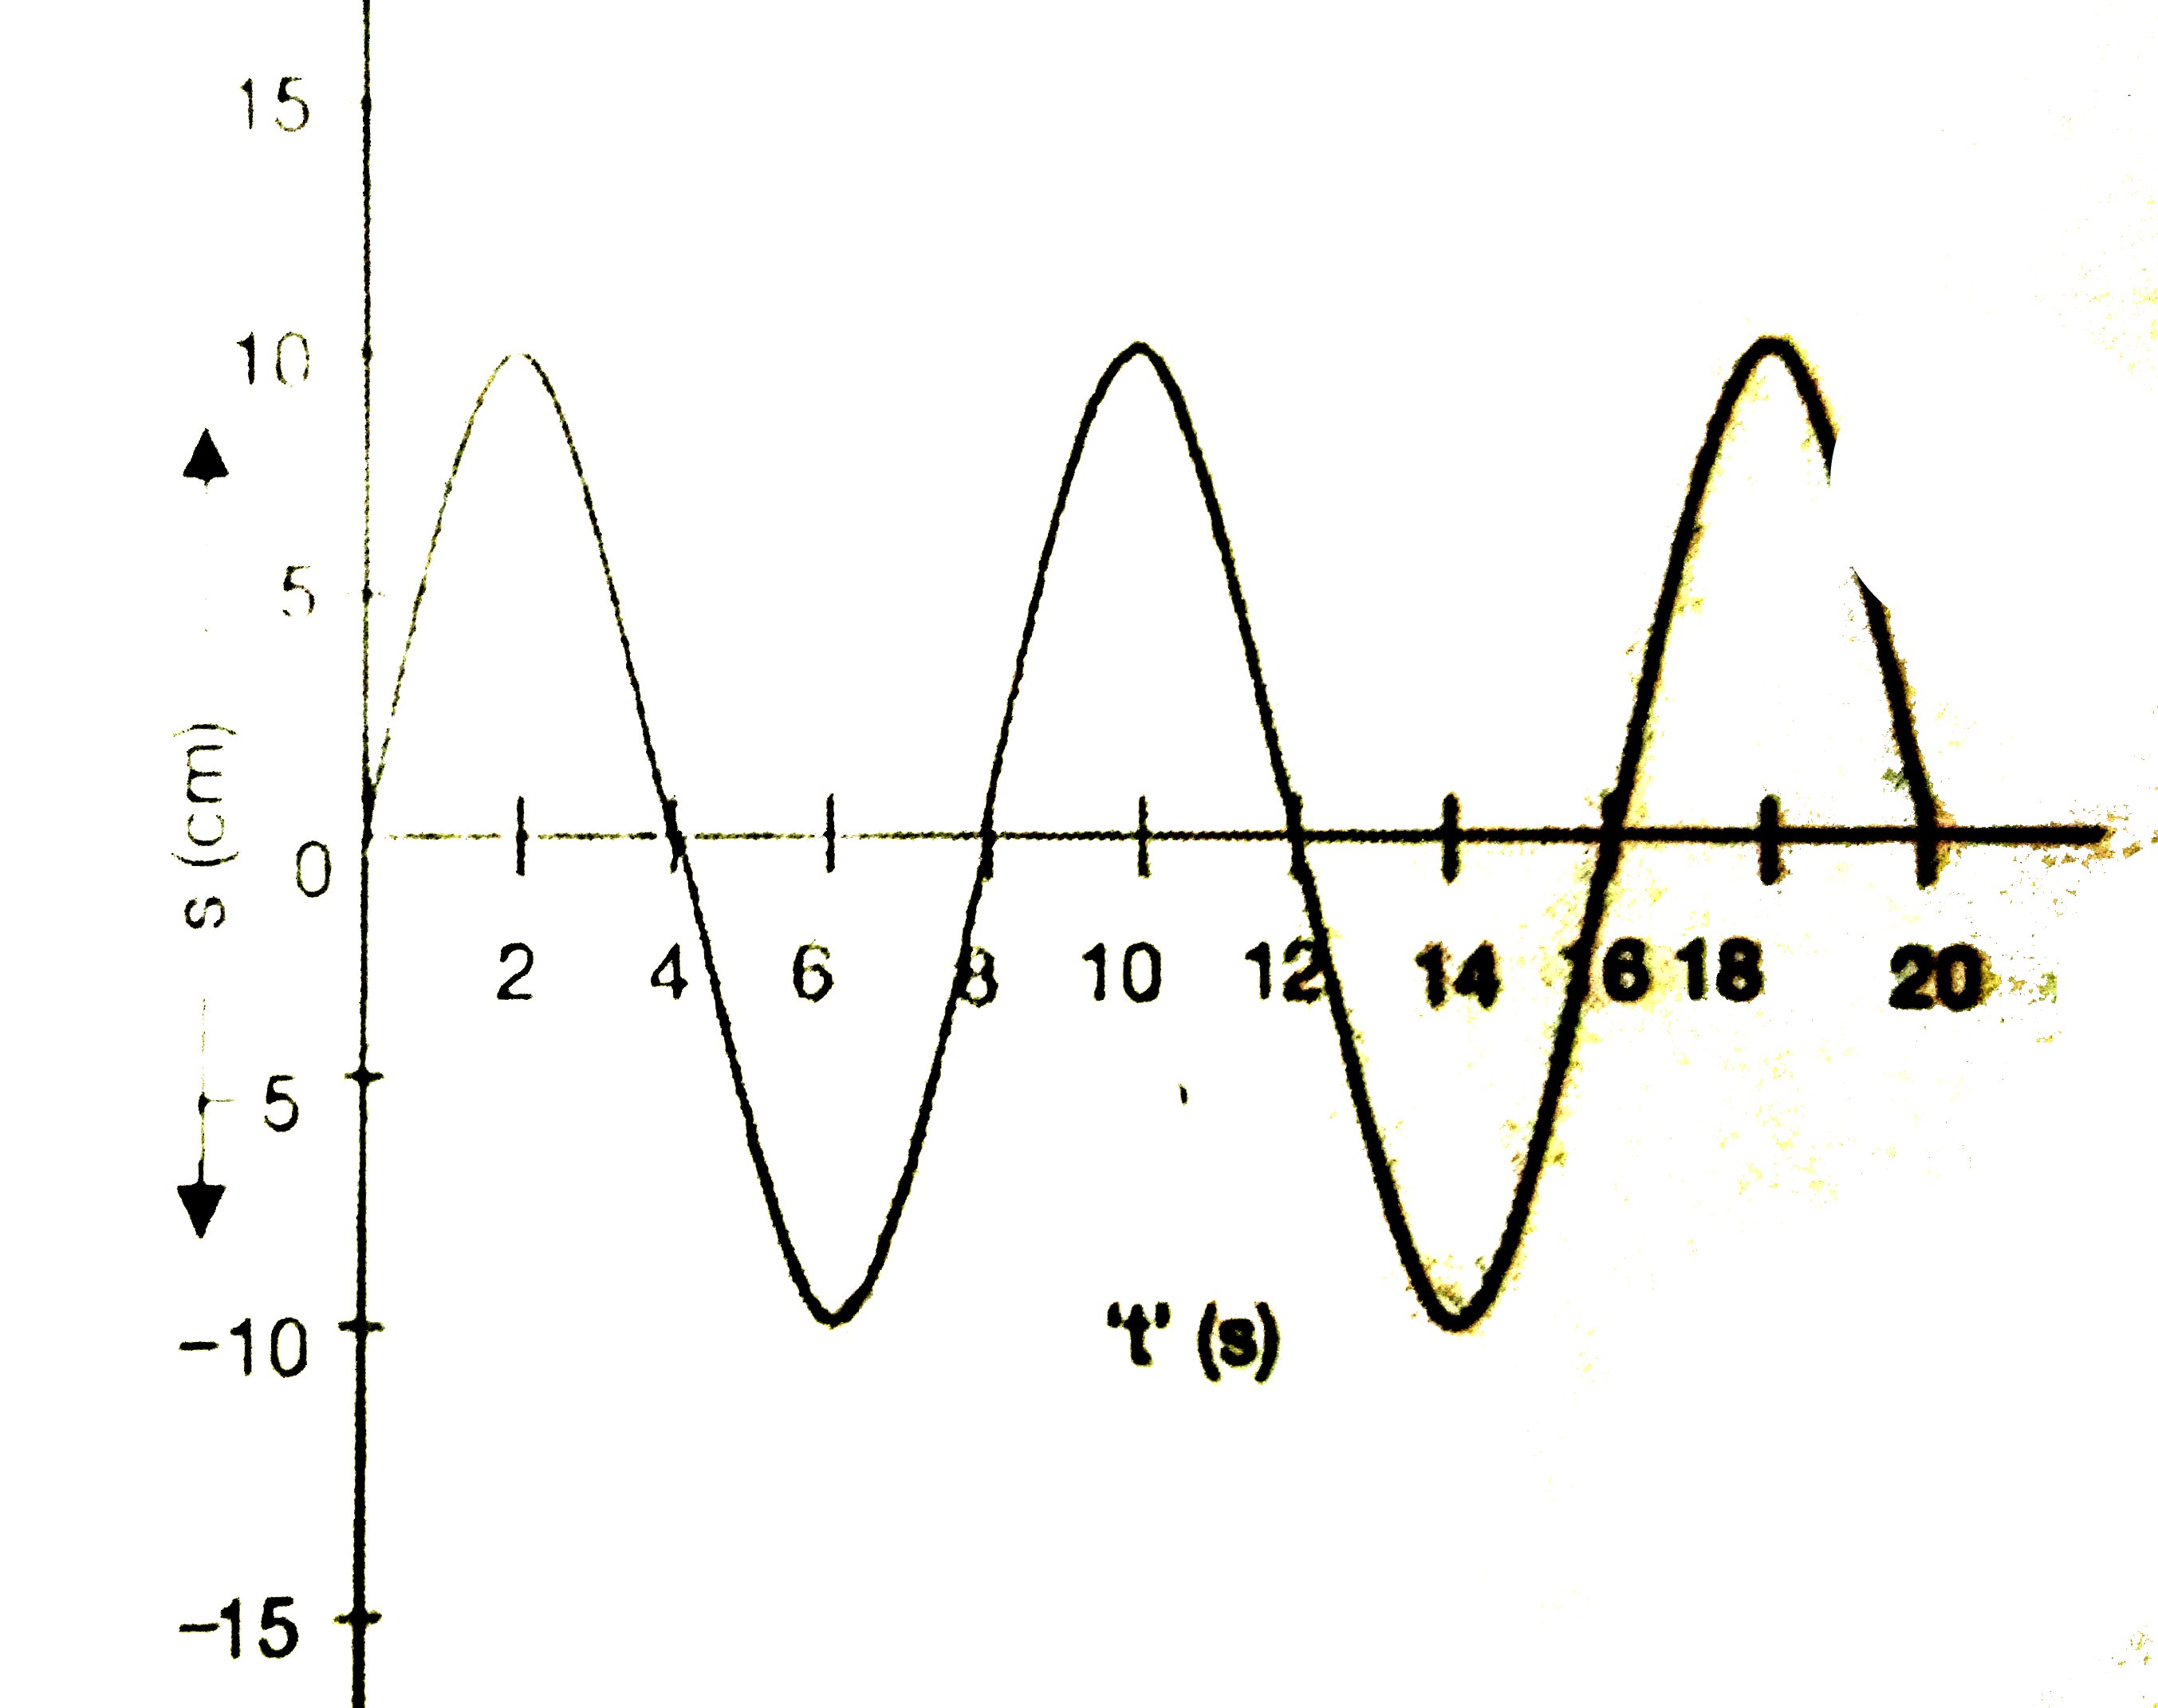
The following graph shows the displacement of the bob from its mean position versus time . The time period and the amplitude of the bob are :
 A4s , 5 cmB8s , 10 cmC4s , 10 cmD8s , 5 cm
Similar Questions
A body of mass 0.1 kg performing linear SHM experiences a restoring force of 1 N when its displacement from the mean position is 5 cm. Find (i) the force constant (ii) the period of SHM (iii) the acceleration of the body, when its displacement from the mean position is 1 cm./
View SolutionA particle is performing SHM aong x-axis,such that its velocity is v1 when its displacement from mean position is x1 and v2 when its displacement from mean position is x2.Time period of oscillation is
View Solution

