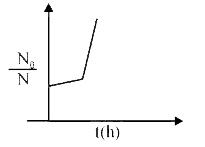
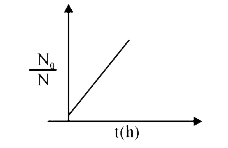
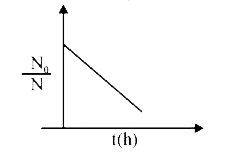
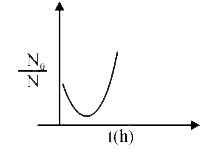
A bacterial infection in an internal wound grows as N'(t)=N0exp(t), where the time t is in hours.A dose of antibiotic, taken orally, needs 1 hour to reach the wound. Once it reaches there, the bacterial population goes down as dNdt=−5N2. What will be the plot of N0N vs. t after 1 hour?


The correct Answer is:B
To solve the problem step by step, we need to analyze the growth of the bacterial infection and the effect of the antibiotic over time.
Step 1: Understand the Growth of Bacteria
The bacterial population grows according to the equation:
N′(t)=N0et
where N0 is the initial bacterial population and t is the time in hours.
Step 2: Calculate Bacterial Population Before Antibiotic Effect
For the first hour (from t=0 to t=1):
At t=1:
N(1)=N0e1=N0e
Step 3: Effect of Antibiotic After 1 Hour
After 1 hour, the antibiotic reaches the wound, and the bacterial population starts to decrease according to the equation:
dNdt=−5N2
Step 4: Solve the Differential Equation
We need to solve the differential equation:
dNdt=−5N2
Rearranging gives:
dNN2=−5dt
Now, we integrate both sides. The left side integrates to:
∫dNN2=−1N
The right side integrates to:
−5∫dt=−5t+C
Step 5: Apply Initial Conditions
At t=1, N=N0e:
−1N0e=−5(1)+C
Thus,
C=−1N0e+5
Step 6: Substitute Back to Find N
Substituting C back into the equation gives:
−1N=−5t−1N0e+5
Rearranging gives:
1N=5t−5+1N0e
Step 7: Express N0N
To find N0N:
N0N=N015t−5+1N0e
This simplifies to:
N0N=N0(5t−5+1N0e)
Step 8: Analyze the Plot of N0N vs. t
The equation for N0N is linear in t:
N0N=5N0t−5N0+1e
This indicates that the plot of N0N vs. t will be a straight line with a slope of 5N0 and a y-intercept of −5N0+1e.
Conclusion
The plot of N0N vs. t after 1 hour will be a straight line with a positive slope.
---
The bacterial population grows according to the equation:
N′(t)=N0et
where N0 is the initial bacterial population and t is the time in hours.
For the first hour (from t=0 to t=1):
At t=1:
N(1)=N0e1=N0e
After 1 hour, the antibiotic reaches the wound, and the bacterial population starts to decrease according to the equation:
dNdt=−5N2
We need to solve the differential equation:
dNdt=−5N2
dNN2=−5dt
∫dNN2=−1N
−5∫dt=−5t+C
At t=1, N=N0e:
−1N0e=−5(1)+C
Thus,
C=−1N0e+5
Substituting C back into the equation gives:
−1N=−5t−1N0e+5
1N=5t−5+1N0e
To find N0N:
N0N=N015t−5+1N0e
This simplifies to:
N0N=N0(5t−5+1N0e)
The equation for N0N is linear in t:
N0N=5N0t−5N0+1e
This indicates that the plot of N0N vs. t will be a straight line with a slope of 5N0 and a y-intercept of −5N0+1e.
The plot of N0N vs. t after 1 hour will be a straight line with a positive slope.
Similar Questions
At time t = 0, a material is composed of two radioactive atoms A and B, where NA0=2NB0.
The decay constant of both kind of radioactive atoms is λ . However, A disintegrates to B and B disintegrates to C. Which of the following figures represents the evolution of NB(t)/NB(0) with respect to time t?
[NA(0)=No. of A atoms at t = 0]
[NB(0)= No. of B atoms at t= 0 ]
View SolutionA balloon starts from the state of rest from the ground with constant acceleration g/n. after time T, a stone is dropped from the balloon. If stone takes time T to reach the ground then calculate value of n.
View Solution
Knowledge Check
Growth of a bacteria is represented as N(t)=N0eλt
After one hour a drug is given which decreases bacterial growth as dNdt=−5N2
Which of the following graph is correct.A_2019_CBT5_E01_025_O01.png) B
B_2019_CBT5_E01_025_O02.png) C
C_2019_CBT5_E01_025_O03.png) D
D_2019_CBT5_E01_025_O04.png)
The half-life of a sample of a radioactive substance is 1 hour. If 8×10¹⁰ atoms are present at t=0, then the number of atoms decayed in the duration t=2 hour to t=4 hour will be
A2×1010B1.5×1010CZeroDInfinityThe half-life of a sample of a radioactive substance is 1 hour. If 8×10¹⁰ atoms are present at t=0, then the number of atoms decayed in the duration t=2 hour to t=4 hour will be
A2×1010B1.5×1010CzeroDinfinity
A population p(t) of 1000 bacteria introduced into nutrient medium grows according to the relation p(t)=1000+1000t100+t2. The maximum size of this bacterial population is equal to N then sum of the digits in N is
View Solution8 grams of a radioactive substance is reduced to 0.5 g after 1 hour . The t1/2 of the radioactive substance is
View Solution8 grams of a radioactive substance is reduced to 0.5 g after 1 hour . The t1/2 of the radioactive substance is
View SolutionIf S=tn, where n≠0, then velocity equal acceleration at time t=3 sec if : n=
View SolutionInternal energy of n1 moles of hydrogen at temperature T is equal to the internal energy of n2 moles of helium at temperature 2T. Then the ratio n1/n2 is
View Solution
